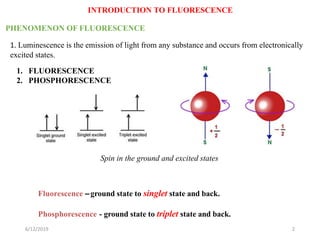
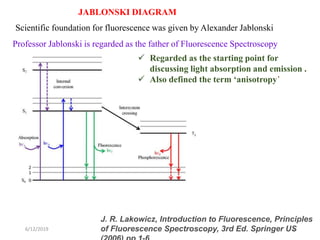
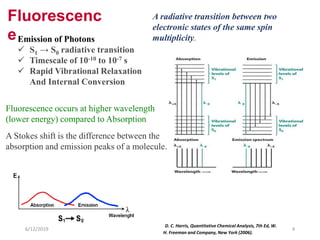
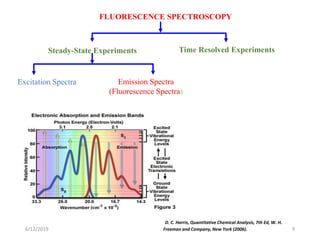
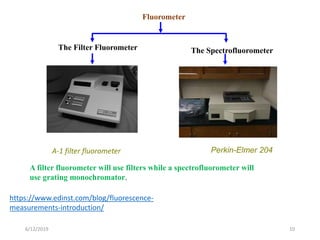
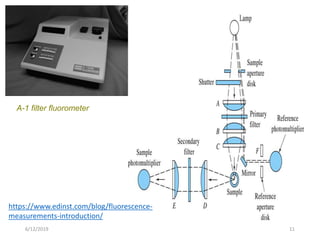
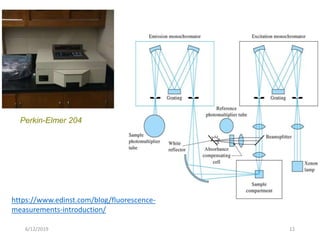
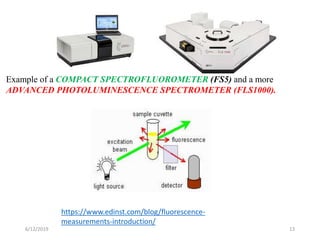
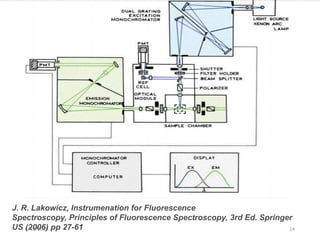
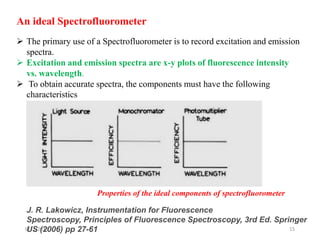
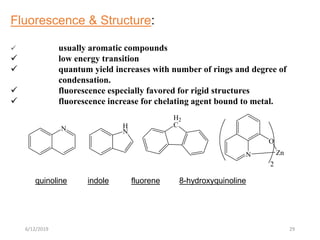
FLUORESCENCE
SPECTROSCOPY
JAYAKRISHNA J
MPHIL STUDENT
DEPARTMENT OF CHEMISTRY
UNIVERSITY OF KERALA
KARIAVATTOM CAMPUS
6/12/2019 1
J Cell Sci. 124 (2): 157–160
PHENOMENON OF FLUORESCENCE
INTRODUCTION TO FLUORESCENCE
1. Luminescence is the emission of light from any substance and occurs from electronically
excited states.
1. FLUORESCENCE
2. PHOSPHORESCENCE
Spin in the ground and excited states
Fluorescence –ground state to singlet state and back.
Phosphorescence - ground state to triplet state and back.
6/12/2019 2
6/12/2019 3
JABLONSKI DIAGRAM
Scientific foundation for fluorescence was given by Alexander Jablonski
Professor Jablonski is regarded as the father of Fluorescence Spectroscopy
J. R. Lakowicz, Introduction to Fluorescence, Principles
of Fluorescence Spectroscopy, 3rd Ed. Springer US
 Regarded as the starting point for
discussing light absorption and emission .
 Also defined the term ‘anisotropy’
Fluorescenc
eEmission of Photons
 S1 → S0 radiative transition
 Timescale of 10-10 to 10-7 s
 Rapid Vibrational Relaxation
And Internal Conversion
D. C. Harris, Quantitative Chemical Analysis, 7th Ed, W.
H. Freeman and Company, New York (2006).
Fluorescence occurs at higher wavelength
(lower energy) compared to Absorption
A Stokes shift is the difference between the
absorption and emission peaks of a molecule.
6/12/2019 4
A radiative transition between two
electronic states of the same spin
multiplicity.
Blue glass Filter
Church Window!
<400nm
Quinine
Solution
Yellow glass of wine
Em filter, transmits > 400 nm
Adapted from HORIBA JobinYvon Inc., Leading the 21 st Century in Time-
Resolved Fluorescence Instrumentation Dr. Adam M. Gilmore
Applications Scientist Fluorescence slide share
FIRST OBSERVED FROM QUININE BY SIR J.W.HERSHEL IN 1845
3.The first observation of fluorescence was reported by Sir John Frederick William
Herschel in 1845
4.He states that superficial colour presented by a homogenous liquid internally
colourless
6/12/2019 6
.
Fig Adapted Article by: Hobart M. King, Ph.D., RPG
The term fluorescence comes from the MINERAL FLUORSPAR (CALCIUM FLUORIDE)
coined by SIR GEORGE G. STOKES.
Fluorescent fluorite: Tumble-polished
specimens of fluorite in normal light (top)
and under short-wave ultraviolet light
(bottom).
J. R. Lakowicz, Introduction to
Fluorescence, Principles of Fluorescence
6/12/2019 7
CHARACTERISTICS OF FLUORESCENCE EMISSION
1. Stokes Shift
2. Kasha Rule
Fluorescence Typically occurs at lower energies or longer
wavelengths
J. R. Lakowicz, Introduction to Fluorescence, Principles of
Fluorescence Spectroscopy, 3rd Ed. Springer US (2006) pp
Stokes Shift:
Difference in energy/wavelength
between absorption max and emission
max.
Kasha’s Rule:
Emission predominantly occurs from the
lowest excited state (S0 OR T1)
6/12/2019 8
Fluorescence is now a dominant methodology used in
1. Environmental Monitoring,
2. Medical Diagnostics,
3. DNA Sequencing,
4. Forensics,
5. Genetic Analysis,
6. Sensing Applications.
1. High sensitivity
2.Fluorescence intensity, Fluorescence maximum, spectral shape,
fluorescence anisotropy, fluorescence lifetime, time-dependence of
anisotropy, fluorescence correlation spectroscopy
3. Relatively simple experimentation
4. Lower cost of equipment compared to similar other techniques
6/12/2019 9
FLUORESCENCE SPECTROSCOPY
Steady-State Experiments Time Resolved Experiments
Excitation Spectra Emission Spectra
(Fluorescence Spectra)
D. C. Harris, Quantitative Chemical Analysis, 7th Ed, W. H.
Freeman and Company, New York (2006).
6/12/2019 10
Fluorometer
The Filter Fluorometer The Spectrofluorometer
A-1 filter fluorometer Perkin-Elmer 204
A filter fluorometer will use filters while a spectrofluorometer will
use grating monochromator.
https://www.edinst.com/blog/fluorescence-
measurements-introduction/
A-1 filter fluorometer
6/12/2019 11
https://www.edinst.com/blog/fluorescence-
measurements-introduction/
Perkin-Elmer 204
6/12/2019 12
https://www.edinst.com/blog/fluorescence-
measurements-introduction/
Example of a COMPACT SPECTROFLUOROMETER (FS5) and a more
ADVANCED PHOTOLUMINESCENCE SPECTROMETER (FLS1000).
6/12/2019 13
https://www.edinst.com/blog/fluorescence-
measurements-introduction/
6/12/2019 14
J. R. Lakowicz, Instrumenation for Fluorescence
Spectroscopy, Principles of Fluorescence Spectroscopy, 3rd Ed. Springer
US (2006) pp 27-61
6/12/2019 15
 The primary use of a Spectrofluorometer is to record excitation and emission
spectra.
 Excitation and emission spectra are x-y plots of fluorescence intensity
vs. wavelength.
 To obtain accurate spectra, the components must have the following
characteristics
An ideal Spectrofluorometer
J. R. Lakowicz, Instrumentation for Fluorescence
Spectroscopy, Principles of Fluorescence Spectroscopy, 3rd Ed. Springer
US (2006) pp 27-61
Properties of the ideal components of spectrofluorometer
6/12/2019 16
J. R. Lakowicz, Instrumentation for Fluorescence
Spectroscopy, Principles of Fluorescence Spectroscopy, 3rd Ed. Springer
US (2006) pp 27-61
 Light Sources, Monochromators, And Photomultiplier Tubes With Such Ideal
Characteristics Are Not Available.
 There is need to correct for the non ideal response of the instrument .
 Fluorescence Intensity Measurements Are Absolute, Not Relative.
• In absorption spectrum, the intensity of light transmitted by the sample is
measured relative to that of a reference (or blank).
https://www.edinst.com/blog/fluorescence-
measurements-introduction/
Introduction to Instrumentation
The figure above shows the layout of
an FLS1000 Photoluminescence
Spectrometer
6/12/2019 17
6/12/2019 18
Light Sources
1. Arc and Incandescent Xenon Lamps
2. Pulsed Xenon Lamps
3. High Pressure Mercury Lamps
4. LED Light Sources
5. Laser Diodes
J. R. Lakowicz, Instrumentation for Fluorescence
Spectroscopy, Principles of Fluorescence Spectroscopy, 3rd Ed. Springer
US (2006) pp 27-61
 At present the most versatile light source for a steady-state spectrofluorometer
is a high-pressure xenon (Xe) arc lamp.
 light output from 250 to 700 nm
 number of sharp line 450 nm and above 800 nm.
6/12/2019 19
J. R. Lakowicz, Instrumentation for Fluorescence
Spectroscopy, Principles of Fluorescence Spectroscopy, 3rd Ed. Springer
US (2006) pp 27-61
Spectral output of a continuous Xenon arc lamp
• The wavelength-dependent output of Xe lamps is a major reason for distortion
of the excitation spectra of compounds that absorb in the visible and
ultraviolet.
6/12/2019 20
J. R. Lakowicz, Instrumentation for Fluorescence
Spectroscopy, Principles of Fluorescence Spectroscopy, 3rd Ed. Springer
US (2006) pp 27-61
 Xenon lamps are usually contained within specially designed housings.
 A xenon lamp that is on should never be observed directly.
 The extreme brightness will damage the retina, and the ultraviolet light
can damage the cornea.
6/12/2019 21
MONOCHROMATORS
J. R. Lakowicz, Introduction to Fluorescence, Principles of Fluorescence
Spectroscopy, 3rd Ed. Springer US (2006) pp 27-61
 Monochromators are used to disperse polychromatic or white light into the
various colors or wavelengths.
 This dispersion can be accomplished using prisms or diffraction gratings.
 The monochromators in most spectrofluorometers use diffraction gratings
rather than prisms
https://www.shimadzu.com/an/uv/support/fundamentals/singl
e_double.html
6/12/2019 22
J. R. Lakowicz, Introduction to Fluorescence, Principles of Fluorescence
Spectroscopy, 3rd Ed. Springer US (2006) pp 27-61
Grating may be PLANAR or CONCAVE. Planar
gratings are produced MECHANICALLY and may
contain IMPERFECTIONS.
Concave gratings are produced by
HOLOGRAPHIC or PHOTORESIST methods and
have less imperfections.
 Few Reflecting Surfaces
 Lower stray lightThe distance between adjacent grooves and the
angle the groove influence both the dispersion
and efficiency of a grating.
6/12/2019 23
Efficiencies of two MCs blazed at
different angles
J. R. Lakowicz, Introduction to Fluorescence, Principles of Fluorescence
Spectroscopy, 3rd Ed. Springer US (2006) pp 27-61
The transmission efficiency of a grating and monochromator is dependent on
wavelength and on the design of the grating.
For a mechanically produced plane grating the efficiency at any given wavelength can
be maximized by choice of blaze angle, which is determined by the shape and angle of
the tool used to produce the grating.
By choice of this angle one may obtain maximum diffraction efficiency for a given
wavelength region
6/12/2019 24
Second order diffraction of 300 nm light
occurs at 600 nm. Hence a peak will
appear at 600.
500 600550 700
Wavelength
The 600 nm peak can be avoided by
placing a cut off filter (eg. <400 cut off)
in the emission channel.
500 600550 700
Wavelength
Corrected spectrum
Assume that you are recording the emission spectrum of a sample. Excitation
WL is 300 nm. Sample emits in the 500-700 nm region
6/12/2019 25
PHOTOMULTIPIER TUBES
J. R. Lakowicz, Instrumenation for Fluorescence Spectroscopy, Principles of
Fluorescence Spectroscopy, 3rd Ed. Springer US (2006) pp 27-61
Almost all fluorescence spectrometers use PMTs as detectors and it is
essential to understand their capabilities and limitations.
PMT is a device that converts light intensity into electrical current,
the current generated being proportional to the photon intensity.
6/12/2019 26
PMT
Xenon Lamp
Excitation
Monochromator
Emission
Monochromator
Sample
ExGrating
Em Grating
Procedure
1) White light source on
2) Shift excitation grating to desired
wavelength (excitation wavelength)
3) Light enters sample chamber
4) Light Hits the Sample
5) Emission from the sample enters
emission monochromator
6) Set emission grating
7) Detect emitted light at PMT
8) Raster emission grating
Measuring Emission Spectra
6/12/2019 27
EFFECT OF CONCENTRATION
J. R. Lakowicz, Introduction to Fluorescence, Principles of Fluorescence
Spectroscopy, 3rd Ed. Springer US (2006) pp 27-61
At extremely high sample concentrations, the
Fluorescence Intensity can actually decrease
because most of the light is absorbed in the
front layers.
Reabsorption of the shorter wavelength.
6/12/2019 28
COMMON ERRORS IN SAMPLE PREPERATION
J. R. Lakowicz, Instrumenation for Fluorescence
Spectroscopy, Principles of Fluorescence Spectroscopy, 3rd Ed. Springer
US (2006) pp 27-61
With the Instrument
• Stray light
• Slit Widths
• Signal/Noise
6/12/2019 29
Fluorescence & Structure:
 usually aromatic compounds
 low energy transition
 quantum yield increases with number of rings and degree of
condensation.
 fluorescence especially favored for rigid structures
 fluorescence increase for chelating agent bound to metal.
N H
N
H2
C
N
O
Zn
2
quinoline indole fluorene 8-hydroxyquinoline
The fluorescence spectrum and intensity of
a molecule often depend strongly on the
molecule’s environment.
FACTORS AFFECTING
FLUORESCENCE AND
PHOSPHORESCENCE
Temperature
pH
Dissolved oxygen
Solvent
30
Temperature:
 As temperature increases fluorescence decreases.
 Due to change in temperature viscosity of the medium changes.(less
Viscosity)
 Change in viscosity increases the number of collisions of the molecules of
the fluorophore with solvent molecules.
 No. of collisions increases the probability for deactivation by internal
conversion and vibrational relaxation.
 To overcome this , it is recommended to use thermo stated cell holders.
31
pH
 Relatively small changes in pH can cause considerable changes in
the fluorescence intensity and spectral characteristics of fluorescence.
 The molecules containing acidic or basic functional groups undergoes
ionization due to the changes in pH of the medium.
 It may affect the extent of conjugation or the aromaticity of the
molecule which affects its fluorescence.
 For example, aniline shows fluorescence while in acid solution it does
not show fluorescence due to the formation of anilinium ion.
 Therefore, pH control is essential while working with such molecules
and suitable buffers should be employed
32
Dissolved Oxygen
 Oxygen and many transition metals with unpaired electrons are
paramagnetic which decrease fluorescence and cause interference in
fluorimetric determinations.
 The paramagnetic nature of molecular oxygen promotes intersystem
crossing from singlet to triplet states in other molecules.(phosphorescence)
 Presence of dissolved oxygen influences phosphorescence too and causes a
large decrease in the phosphorescence intensity. This is actually the oxygen
emission and not the phosphorescence.
 Therefore, it is advisable to make phosphorescence measurement in the
absence of dissolved oxygen.
33
6/12/2019 34
Solvent:
The changes in the “polarity” or hydrogen bonding ability of the solvent affect the
fluorescent behaviour of the analyte.
Solvent viscosity and solvents with heavy atoms also affect fluorescence and
phosphorescence.
A higher fluorescence is observed when the solvents do not contain heavy atoms while
phosphorescence increases due to the presence of heavy atoms in the solvent.
J. Chem. Educ. 2011, 88, 731–738
6/12/2019 35
APPLICATIONS
Naked eye and smartphone applicable detection of toxic mercury ions using
fluorescent carbon nanodots
doi:10.3906/kim-1701-46
1.Band Gap Determination
2. Impurity level and defect detection
3.Surface Structure and Excited States.
6/12/2019 36
https://www.nobelprize.org/prizes/chemistry/
2014/press-release/
6/12/2019 37

Photolumimiscence spectroscopy

  • 1.
    FLUORESCENCE SPECTROSCOPY JAYAKRISHNA J MPHIL STUDENT DEPARTMENTOF CHEMISTRY UNIVERSITY OF KERALA KARIAVATTOM CAMPUS 6/12/2019 1 J Cell Sci. 124 (2): 157–160
  • 2.
    PHENOMENON OF FLUORESCENCE INTRODUCTIONTO FLUORESCENCE 1. Luminescence is the emission of light from any substance and occurs from electronically excited states. 1. FLUORESCENCE 2. PHOSPHORESCENCE Spin in the ground and excited states Fluorescence –ground state to singlet state and back. Phosphorescence - ground state to triplet state and back. 6/12/2019 2
  • 3.
    6/12/2019 3 JABLONSKI DIAGRAM Scientificfoundation for fluorescence was given by Alexander Jablonski Professor Jablonski is regarded as the father of Fluorescence Spectroscopy J. R. Lakowicz, Introduction to Fluorescence, Principles of Fluorescence Spectroscopy, 3rd Ed. Springer US  Regarded as the starting point for discussing light absorption and emission .  Also defined the term ‘anisotropy’
  • 4.
    Fluorescenc eEmission of Photons S1 → S0 radiative transition  Timescale of 10-10 to 10-7 s  Rapid Vibrational Relaxation And Internal Conversion D. C. Harris, Quantitative Chemical Analysis, 7th Ed, W. H. Freeman and Company, New York (2006). Fluorescence occurs at higher wavelength (lower energy) compared to Absorption A Stokes shift is the difference between the absorption and emission peaks of a molecule. 6/12/2019 4 A radiative transition between two electronic states of the same spin multiplicity.
  • 5.
    Blue glass Filter ChurchWindow! <400nm Quinine Solution Yellow glass of wine Em filter, transmits > 400 nm Adapted from HORIBA JobinYvon Inc., Leading the 21 st Century in Time- Resolved Fluorescence Instrumentation Dr. Adam M. Gilmore Applications Scientist Fluorescence slide share FIRST OBSERVED FROM QUININE BY SIR J.W.HERSHEL IN 1845 3.The first observation of fluorescence was reported by Sir John Frederick William Herschel in 1845 4.He states that superficial colour presented by a homogenous liquid internally colourless
  • 6.
    6/12/2019 6 . Fig AdaptedArticle by: Hobart M. King, Ph.D., RPG The term fluorescence comes from the MINERAL FLUORSPAR (CALCIUM FLUORIDE) coined by SIR GEORGE G. STOKES. Fluorescent fluorite: Tumble-polished specimens of fluorite in normal light (top) and under short-wave ultraviolet light (bottom). J. R. Lakowicz, Introduction to Fluorescence, Principles of Fluorescence
  • 7.
    6/12/2019 7 CHARACTERISTICS OFFLUORESCENCE EMISSION 1. Stokes Shift 2. Kasha Rule Fluorescence Typically occurs at lower energies or longer wavelengths J. R. Lakowicz, Introduction to Fluorescence, Principles of Fluorescence Spectroscopy, 3rd Ed. Springer US (2006) pp Stokes Shift: Difference in energy/wavelength between absorption max and emission max. Kasha’s Rule: Emission predominantly occurs from the lowest excited state (S0 OR T1)
  • 8.
    6/12/2019 8 Fluorescence isnow a dominant methodology used in 1. Environmental Monitoring, 2. Medical Diagnostics, 3. DNA Sequencing, 4. Forensics, 5. Genetic Analysis, 6. Sensing Applications. 1. High sensitivity 2.Fluorescence intensity, Fluorescence maximum, spectral shape, fluorescence anisotropy, fluorescence lifetime, time-dependence of anisotropy, fluorescence correlation spectroscopy 3. Relatively simple experimentation 4. Lower cost of equipment compared to similar other techniques
  • 9.
    6/12/2019 9 FLUORESCENCE SPECTROSCOPY Steady-StateExperiments Time Resolved Experiments Excitation Spectra Emission Spectra (Fluorescence Spectra) D. C. Harris, Quantitative Chemical Analysis, 7th Ed, W. H. Freeman and Company, New York (2006).
  • 10.
    6/12/2019 10 Fluorometer The FilterFluorometer The Spectrofluorometer A-1 filter fluorometer Perkin-Elmer 204 A filter fluorometer will use filters while a spectrofluorometer will use grating monochromator. https://www.edinst.com/blog/fluorescence- measurements-introduction/
  • 11.
    A-1 filter fluorometer 6/12/201911 https://www.edinst.com/blog/fluorescence- measurements-introduction/
  • 12.
  • 13.
    Example of aCOMPACT SPECTROFLUOROMETER (FS5) and a more ADVANCED PHOTOLUMINESCENCE SPECTROMETER (FLS1000). 6/12/2019 13 https://www.edinst.com/blog/fluorescence- measurements-introduction/
  • 14.
    6/12/2019 14 J. R.Lakowicz, Instrumenation for Fluorescence Spectroscopy, Principles of Fluorescence Spectroscopy, 3rd Ed. Springer US (2006) pp 27-61
  • 15.
    6/12/2019 15  Theprimary use of a Spectrofluorometer is to record excitation and emission spectra.  Excitation and emission spectra are x-y plots of fluorescence intensity vs. wavelength.  To obtain accurate spectra, the components must have the following characteristics An ideal Spectrofluorometer J. R. Lakowicz, Instrumentation for Fluorescence Spectroscopy, Principles of Fluorescence Spectroscopy, 3rd Ed. Springer US (2006) pp 27-61 Properties of the ideal components of spectrofluorometer
  • 16.
    6/12/2019 16 J. R.Lakowicz, Instrumentation for Fluorescence Spectroscopy, Principles of Fluorescence Spectroscopy, 3rd Ed. Springer US (2006) pp 27-61  Light Sources, Monochromators, And Photomultiplier Tubes With Such Ideal Characteristics Are Not Available.  There is need to correct for the non ideal response of the instrument .  Fluorescence Intensity Measurements Are Absolute, Not Relative. • In absorption spectrum, the intensity of light transmitted by the sample is measured relative to that of a reference (or blank).
  • 17.
    https://www.edinst.com/blog/fluorescence- measurements-introduction/ Introduction to Instrumentation Thefigure above shows the layout of an FLS1000 Photoluminescence Spectrometer 6/12/2019 17
  • 18.
    6/12/2019 18 Light Sources 1.Arc and Incandescent Xenon Lamps 2. Pulsed Xenon Lamps 3. High Pressure Mercury Lamps 4. LED Light Sources 5. Laser Diodes J. R. Lakowicz, Instrumentation for Fluorescence Spectroscopy, Principles of Fluorescence Spectroscopy, 3rd Ed. Springer US (2006) pp 27-61  At present the most versatile light source for a steady-state spectrofluorometer is a high-pressure xenon (Xe) arc lamp.  light output from 250 to 700 nm  number of sharp line 450 nm and above 800 nm.
  • 19.
    6/12/2019 19 J. R.Lakowicz, Instrumentation for Fluorescence Spectroscopy, Principles of Fluorescence Spectroscopy, 3rd Ed. Springer US (2006) pp 27-61 Spectral output of a continuous Xenon arc lamp • The wavelength-dependent output of Xe lamps is a major reason for distortion of the excitation spectra of compounds that absorb in the visible and ultraviolet.
  • 20.
    6/12/2019 20 J. R.Lakowicz, Instrumentation for Fluorescence Spectroscopy, Principles of Fluorescence Spectroscopy, 3rd Ed. Springer US (2006) pp 27-61  Xenon lamps are usually contained within specially designed housings.  A xenon lamp that is on should never be observed directly.  The extreme brightness will damage the retina, and the ultraviolet light can damage the cornea.
  • 21.
    6/12/2019 21 MONOCHROMATORS J. R.Lakowicz, Introduction to Fluorescence, Principles of Fluorescence Spectroscopy, 3rd Ed. Springer US (2006) pp 27-61  Monochromators are used to disperse polychromatic or white light into the various colors or wavelengths.  This dispersion can be accomplished using prisms or diffraction gratings.  The monochromators in most spectrofluorometers use diffraction gratings rather than prisms https://www.shimadzu.com/an/uv/support/fundamentals/singl e_double.html
  • 22.
    6/12/2019 22 J. R.Lakowicz, Introduction to Fluorescence, Principles of Fluorescence Spectroscopy, 3rd Ed. Springer US (2006) pp 27-61 Grating may be PLANAR or CONCAVE. Planar gratings are produced MECHANICALLY and may contain IMPERFECTIONS. Concave gratings are produced by HOLOGRAPHIC or PHOTORESIST methods and have less imperfections.  Few Reflecting Surfaces  Lower stray lightThe distance between adjacent grooves and the angle the groove influence both the dispersion and efficiency of a grating.
  • 23.
    6/12/2019 23 Efficiencies oftwo MCs blazed at different angles J. R. Lakowicz, Introduction to Fluorescence, Principles of Fluorescence Spectroscopy, 3rd Ed. Springer US (2006) pp 27-61 The transmission efficiency of a grating and monochromator is dependent on wavelength and on the design of the grating. For a mechanically produced plane grating the efficiency at any given wavelength can be maximized by choice of blaze angle, which is determined by the shape and angle of the tool used to produce the grating. By choice of this angle one may obtain maximum diffraction efficiency for a given wavelength region
  • 24.
    6/12/2019 24 Second orderdiffraction of 300 nm light occurs at 600 nm. Hence a peak will appear at 600. 500 600550 700 Wavelength The 600 nm peak can be avoided by placing a cut off filter (eg. <400 cut off) in the emission channel. 500 600550 700 Wavelength Corrected spectrum Assume that you are recording the emission spectrum of a sample. Excitation WL is 300 nm. Sample emits in the 500-700 nm region
  • 25.
    6/12/2019 25 PHOTOMULTIPIER TUBES J.R. Lakowicz, Instrumenation for Fluorescence Spectroscopy, Principles of Fluorescence Spectroscopy, 3rd Ed. Springer US (2006) pp 27-61 Almost all fluorescence spectrometers use PMTs as detectors and it is essential to understand their capabilities and limitations. PMT is a device that converts light intensity into electrical current, the current generated being proportional to the photon intensity.
  • 26.
    6/12/2019 26 PMT Xenon Lamp Excitation Monochromator Emission Monochromator Sample ExGrating EmGrating Procedure 1) White light source on 2) Shift excitation grating to desired wavelength (excitation wavelength) 3) Light enters sample chamber 4) Light Hits the Sample 5) Emission from the sample enters emission monochromator 6) Set emission grating 7) Detect emitted light at PMT 8) Raster emission grating Measuring Emission Spectra
  • 27.
    6/12/2019 27 EFFECT OFCONCENTRATION J. R. Lakowicz, Introduction to Fluorescence, Principles of Fluorescence Spectroscopy, 3rd Ed. Springer US (2006) pp 27-61 At extremely high sample concentrations, the Fluorescence Intensity can actually decrease because most of the light is absorbed in the front layers. Reabsorption of the shorter wavelength.
  • 28.
    6/12/2019 28 COMMON ERRORSIN SAMPLE PREPERATION J. R. Lakowicz, Instrumenation for Fluorescence Spectroscopy, Principles of Fluorescence Spectroscopy, 3rd Ed. Springer US (2006) pp 27-61 With the Instrument • Stray light • Slit Widths • Signal/Noise
  • 29.
    6/12/2019 29 Fluorescence &Structure:  usually aromatic compounds  low energy transition  quantum yield increases with number of rings and degree of condensation.  fluorescence especially favored for rigid structures  fluorescence increase for chelating agent bound to metal. N H N H2 C N O Zn 2 quinoline indole fluorene 8-hydroxyquinoline
  • 30.
    The fluorescence spectrumand intensity of a molecule often depend strongly on the molecule’s environment. FACTORS AFFECTING FLUORESCENCE AND PHOSPHORESCENCE Temperature pH Dissolved oxygen Solvent 30
  • 31.
    Temperature:  As temperatureincreases fluorescence decreases.  Due to change in temperature viscosity of the medium changes.(less Viscosity)  Change in viscosity increases the number of collisions of the molecules of the fluorophore with solvent molecules.  No. of collisions increases the probability for deactivation by internal conversion and vibrational relaxation.  To overcome this , it is recommended to use thermo stated cell holders. 31
  • 32.
    pH  Relatively smallchanges in pH can cause considerable changes in the fluorescence intensity and spectral characteristics of fluorescence.  The molecules containing acidic or basic functional groups undergoes ionization due to the changes in pH of the medium.  It may affect the extent of conjugation or the aromaticity of the molecule which affects its fluorescence.  For example, aniline shows fluorescence while in acid solution it does not show fluorescence due to the formation of anilinium ion.  Therefore, pH control is essential while working with such molecules and suitable buffers should be employed 32
  • 33.
    Dissolved Oxygen  Oxygenand many transition metals with unpaired electrons are paramagnetic which decrease fluorescence and cause interference in fluorimetric determinations.  The paramagnetic nature of molecular oxygen promotes intersystem crossing from singlet to triplet states in other molecules.(phosphorescence)  Presence of dissolved oxygen influences phosphorescence too and causes a large decrease in the phosphorescence intensity. This is actually the oxygen emission and not the phosphorescence.  Therefore, it is advisable to make phosphorescence measurement in the absence of dissolved oxygen. 33
  • 34.
    6/12/2019 34 Solvent: The changesin the “polarity” or hydrogen bonding ability of the solvent affect the fluorescent behaviour of the analyte. Solvent viscosity and solvents with heavy atoms also affect fluorescence and phosphorescence. A higher fluorescence is observed when the solvents do not contain heavy atoms while phosphorescence increases due to the presence of heavy atoms in the solvent. J. Chem. Educ. 2011, 88, 731–738
  • 35.
    6/12/2019 35 APPLICATIONS Naked eyeand smartphone applicable detection of toxic mercury ions using fluorescent carbon nanodots doi:10.3906/kim-1701-46 1.Band Gap Determination 2. Impurity level and defect detection 3.Surface Structure and Excited States.
  • 36.
  • 37.

Editor's Notes

  • #2 DURING THE PAST 20 YEARS THERE HAS BEEN A SIGNIFICANT INCREASE IN THE USE OF FLUROSCENCE
  • #3 WE ALL KNOW THAT ELECTRON PRESENT IN THE ATOM HAS A SPECIFIC SPIN ASSPISIATED WITH THEM
  • #4 WHEN EXTERNAL RADIATION FALL ON THE MOLECULE II ABSORBS ENERGY DUE TO THE THIS ABSORPTION AN ELECTRONIC TRANSITION TAKE PLACE
  • #5 FLUROSCENCE IS THE IMMEDIATE EMISIION OF RADIATION WHILE PHSPHORENCE IS THE DELAYED EMISSION OF RADIATION
  • #6 THE FIRST OBSERVATION OF FL WAS REPORTED BY HERSHEL HE OBSERVED A LIGHT EMISSION FROM QUININE SULPHATE SOLUTION WHEN EXPOSED TO SUNLIGHT AND DESCRIBED THE PHENOMENON QUININE IN TONIC WATER IS EXCITED BY UV FROM THE SUN UPON RETURN TO THE GROUND STATE EMITS A WAVELENGHT OF ABOUT 450 NM TILL THE DATE THE FLUROSCENEC IN QININE REMAIONS AS ONE MOST BEAUTIFUL AND WIDELY ACCEPTED EG
  • #7 HE DISCOVERED THE ABILITY OF SPECIMENS TO PRODUCE A BLUE GLOW WHEN ILLUMINATED WITH SUNLIGHT HE TERMED IT AS BEYOND THE VIOLET END OF THE SPECTRUM
  • #8 Fluorescence Typically occurs at lower energies or longer wavelengths PHENONEMENON WAS FIRST OBSERVED BY GC STOKES THE SOURCE OF UV EXCITATION WAS PROVIDED BY A BLUE FITER THE FILTRE TRANSMITS A LIGHT BELOW 400 NM THE INCIDENT LIGHT IS FURTHER PREVENTED FROM REACHING THE DETECTOR
  • #10 THE MOST COMMON SPECTRAL MEASUREMENT UNDERTAKEN IN A SPECTROFLUROMETER ARE EXCITATION AND EMISSION SPECTRA TIME RESOLVED USED FOR MEASURING INTENSITY DECYAS OR ANISOTROPY DECAYS SAMPLE IS PULSE EXCITATION SPECTRA THE EMIISION MONOCHROMATOR IS SET AT A WAVELENGTH A STRONG FLUROSCENCE EMISSION THE CHANGE IN FLUROSCENCE INTENSITY IS MEASURED MOINTOIRED REVEAS THE ABSORBTION
  • #11 THERA ARE TWO TYPES OF FLUROMETERThe difference between them is the way they select the wavelengths of incident light. . The optical filters are relatively inexpensive and are easy to change, so filter fluorometers are commonly used in experimental applications which repeatedly measure different compounds
  • #15 this instrument has a xenon lamp as a source of exciting light. Such lamps are generally useful because of their high intensity at all wavelengths ranging upward from 250 nm. The instrument shown is equipped with monochromators to select both the excitation and emission wavelengths. Shutters are provided to eliminate the exciting light or to close off the emission channel. A beam splitter is provided in the excitation light path. This splitter reflects part of the excitation light to a reference cell, which generally contains a stable reference fluorophore. The beam splitter consists of a thin piece of clear quartz, which reflects about 4% of the incident light
  • #20 At present the most versatile light source for a steady-state spectrofluorometer is a high-pressure xenon (Xe) arc lamp. These lamps provide a relatively continuous light output from 250 to 700 nm (Figure 2.5), with a number of sharp lines occurring near 450 nm and above 800 nm. Xenon arc lamps emit a continuum of light as a result of recombination of electrons with ionized Xe atoms. These ions are generated by collisions of Xe atoms with the electrons that flow across the arc. Complete separation of the electrons from the atoms yields the continuous emission. Xe atoms that are in excited states but not ionized yield lines rather than broad emission bands. The peaks near 450 nm are due to these excited states
  • #21 Xenon lamps are usually contained within specially designed housings. The arc lamp housing serves several important functions (Figure 2.7). The gas in xenon lamps is under high pressure (about 10 atmospheres), and explosion is always a danger. The housing protects the user from the lamp and also from its intense optical output. The housing also directs air over the lamp and removes excess heat and ozone. A xenon lamp that is on should never be observed directly. The extreme brightness will damage the retina, and the ultraviolet light can damage the cornea. Another important role of the housing is for collecting and collimating lamp output, which is then focused into the entrance slit of the monochromator
  • #22 . Monochromators are also chosen for high efficiency to maximize the ability to detect low light level
  • #23 Monochromators can have planar or concave gratings (Figure 2.11). Planar gratings are usually produced mechanically. Concave gratings are usually produced by holographic and photoresist methods. Imperfections of the gratings are a source of stray light transmission by the monochromators, and of ghost images from the grating. Ghost images concave gratings can have fewer reflecting surfaces, lower stray light, and can be more efficient. A concave grating can serve as both the diffraction and focusing element, resulting on one instead of three reflecting surfaces By choice of this angle one may obtain maximum diffraction efficiency for a given wavelength region, but the efficiency is less at other wavelengths. For the examples shown in Figure 2.12 the efficiency was optimized for 250 or 750 n
  • #26  A PMT is best regarded as a current source. The current is proportional to the light intensity. A PMT responds to individual photons, and the pulses can be detected as an average signal or counted as individual photons. A PMT vacuum tube consists of a photocathode and a series of dynodes which are the amplification stages. The photocathode is a thin film of metal on the inside of the window. Incident photons cause electrons to be ejected from this surface. The generation efficiency of photoelectrons is dependent upon the incident wavelength. The photocathode is held at a high negative potential, typically –1000 to –2000 volts. The dynodes are also held at negative potentials, but these potentials decrease toward zero along the dynode chain. The potential difference between the photocathode and the first dynode potential is generally fixed at a constant voltage by a Zener diode, at values ranging from –50 to –200 volts. This potential difference causes an ejected photoelectron to be accelerated toward the first dynode. Upon collision with the first dynode the photoelectron causes 5 to 20 additional electrons to be ejected, depending on the voltage difference to this dynode. This process continues down the dynode chain until a current pulse arrives at the anode. The size of this pulse depends upon the overall voltage applied to the PMT. Higher voltages result in an increased number of electrons ejected from each dynode, and hence higher amplification.