Downloaded 214 times

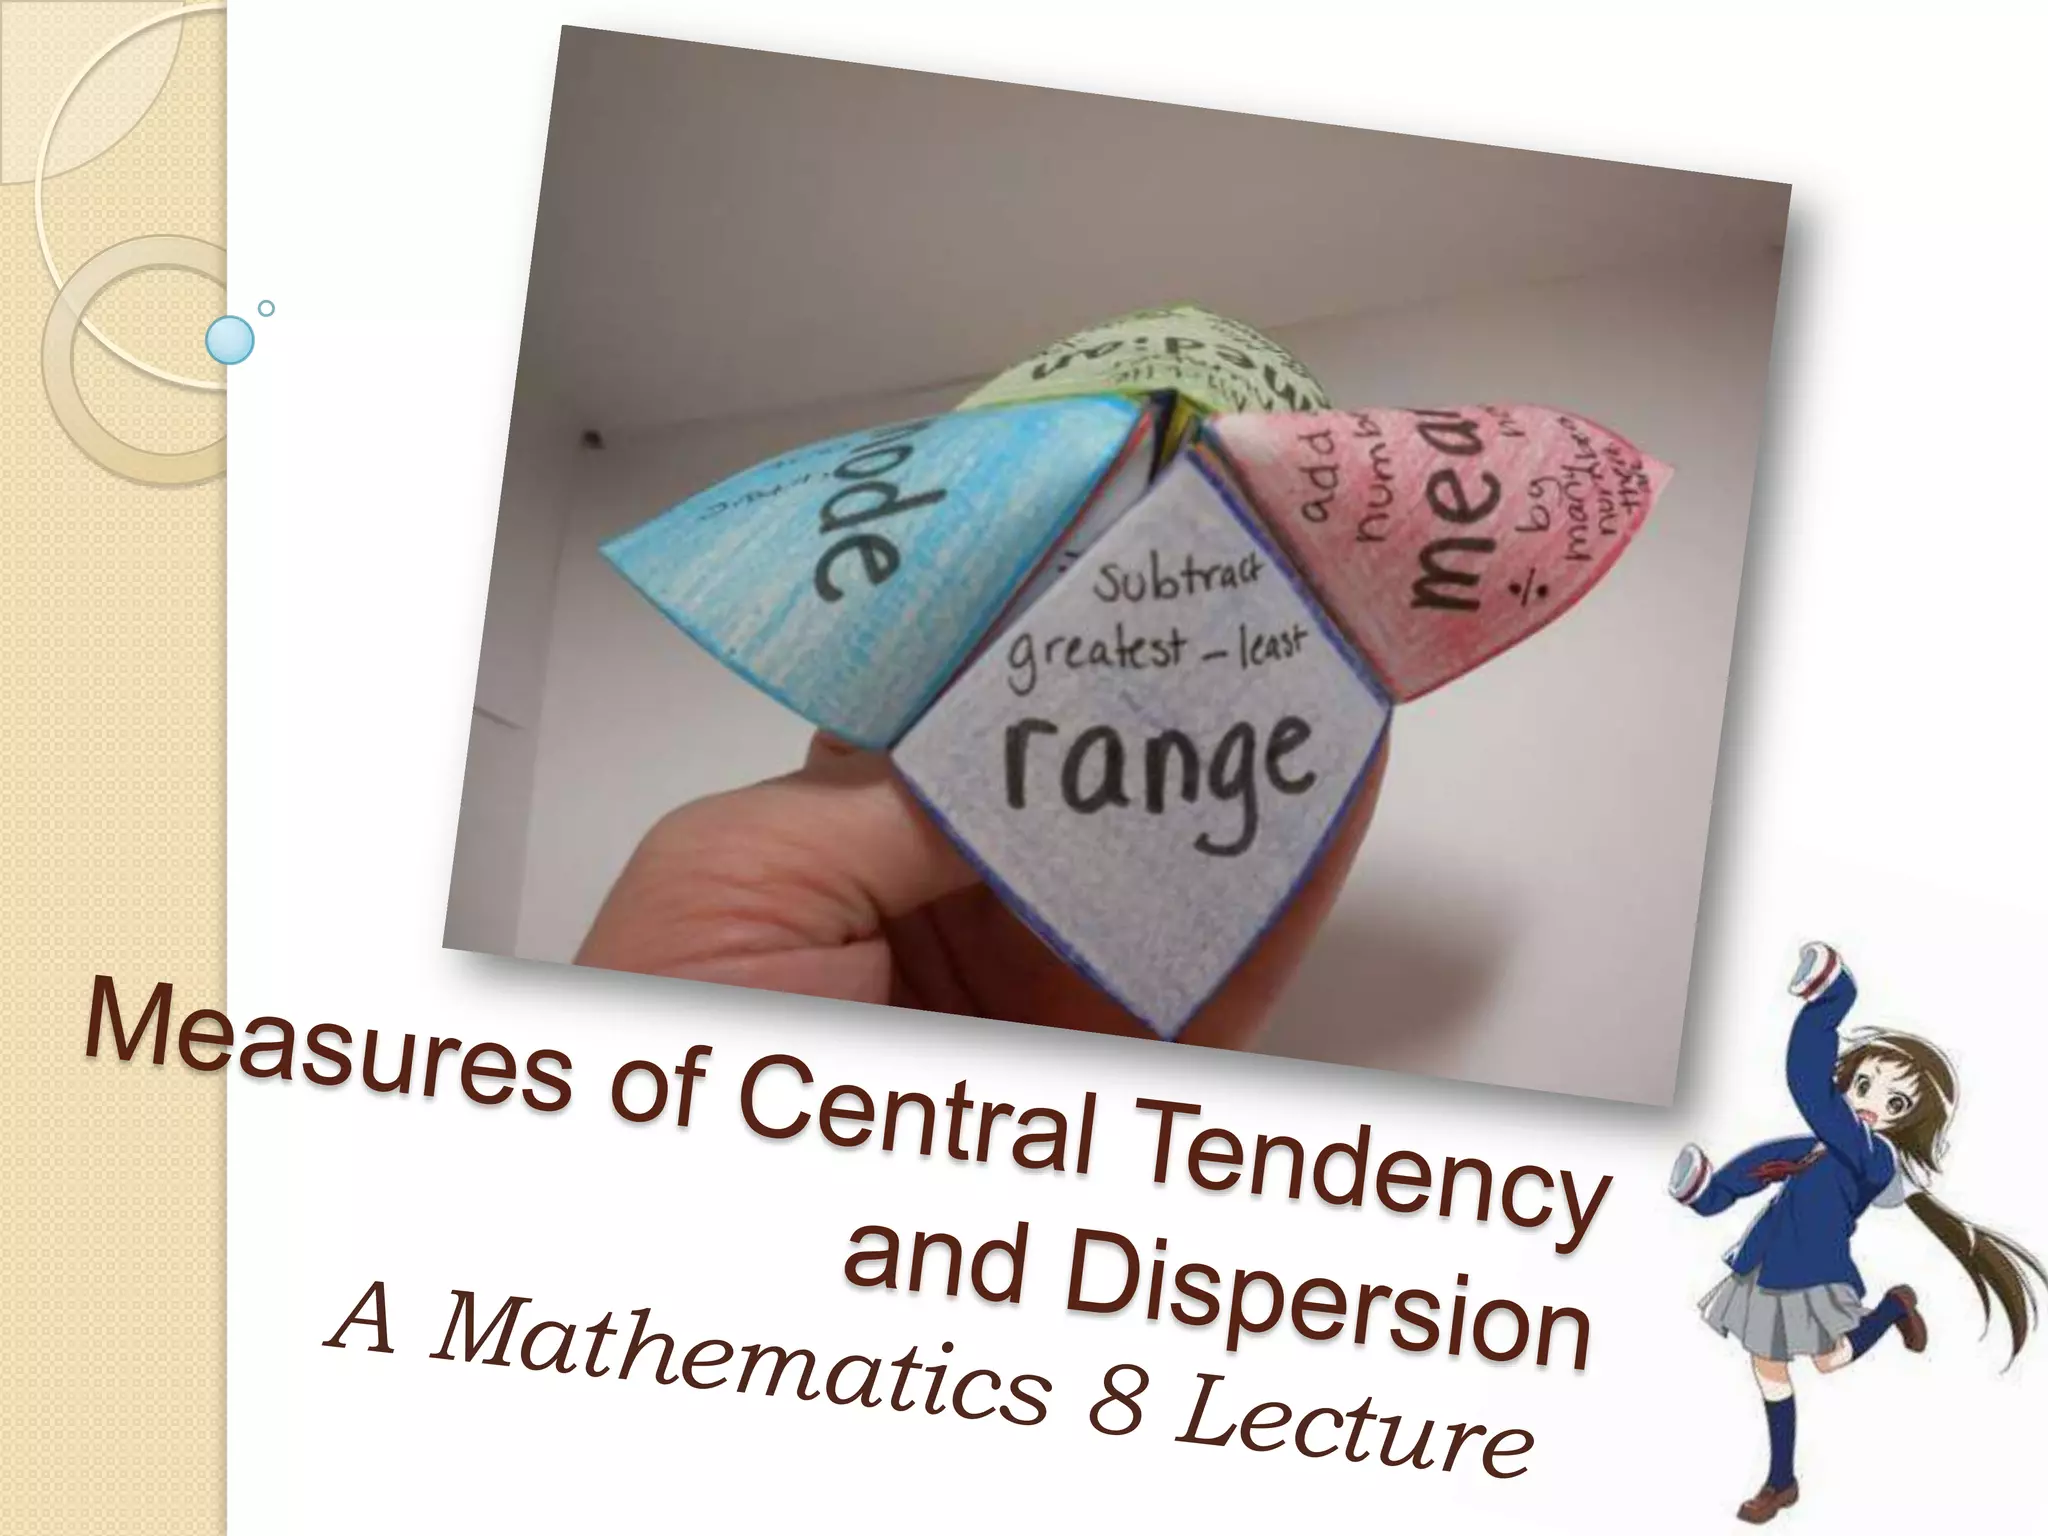

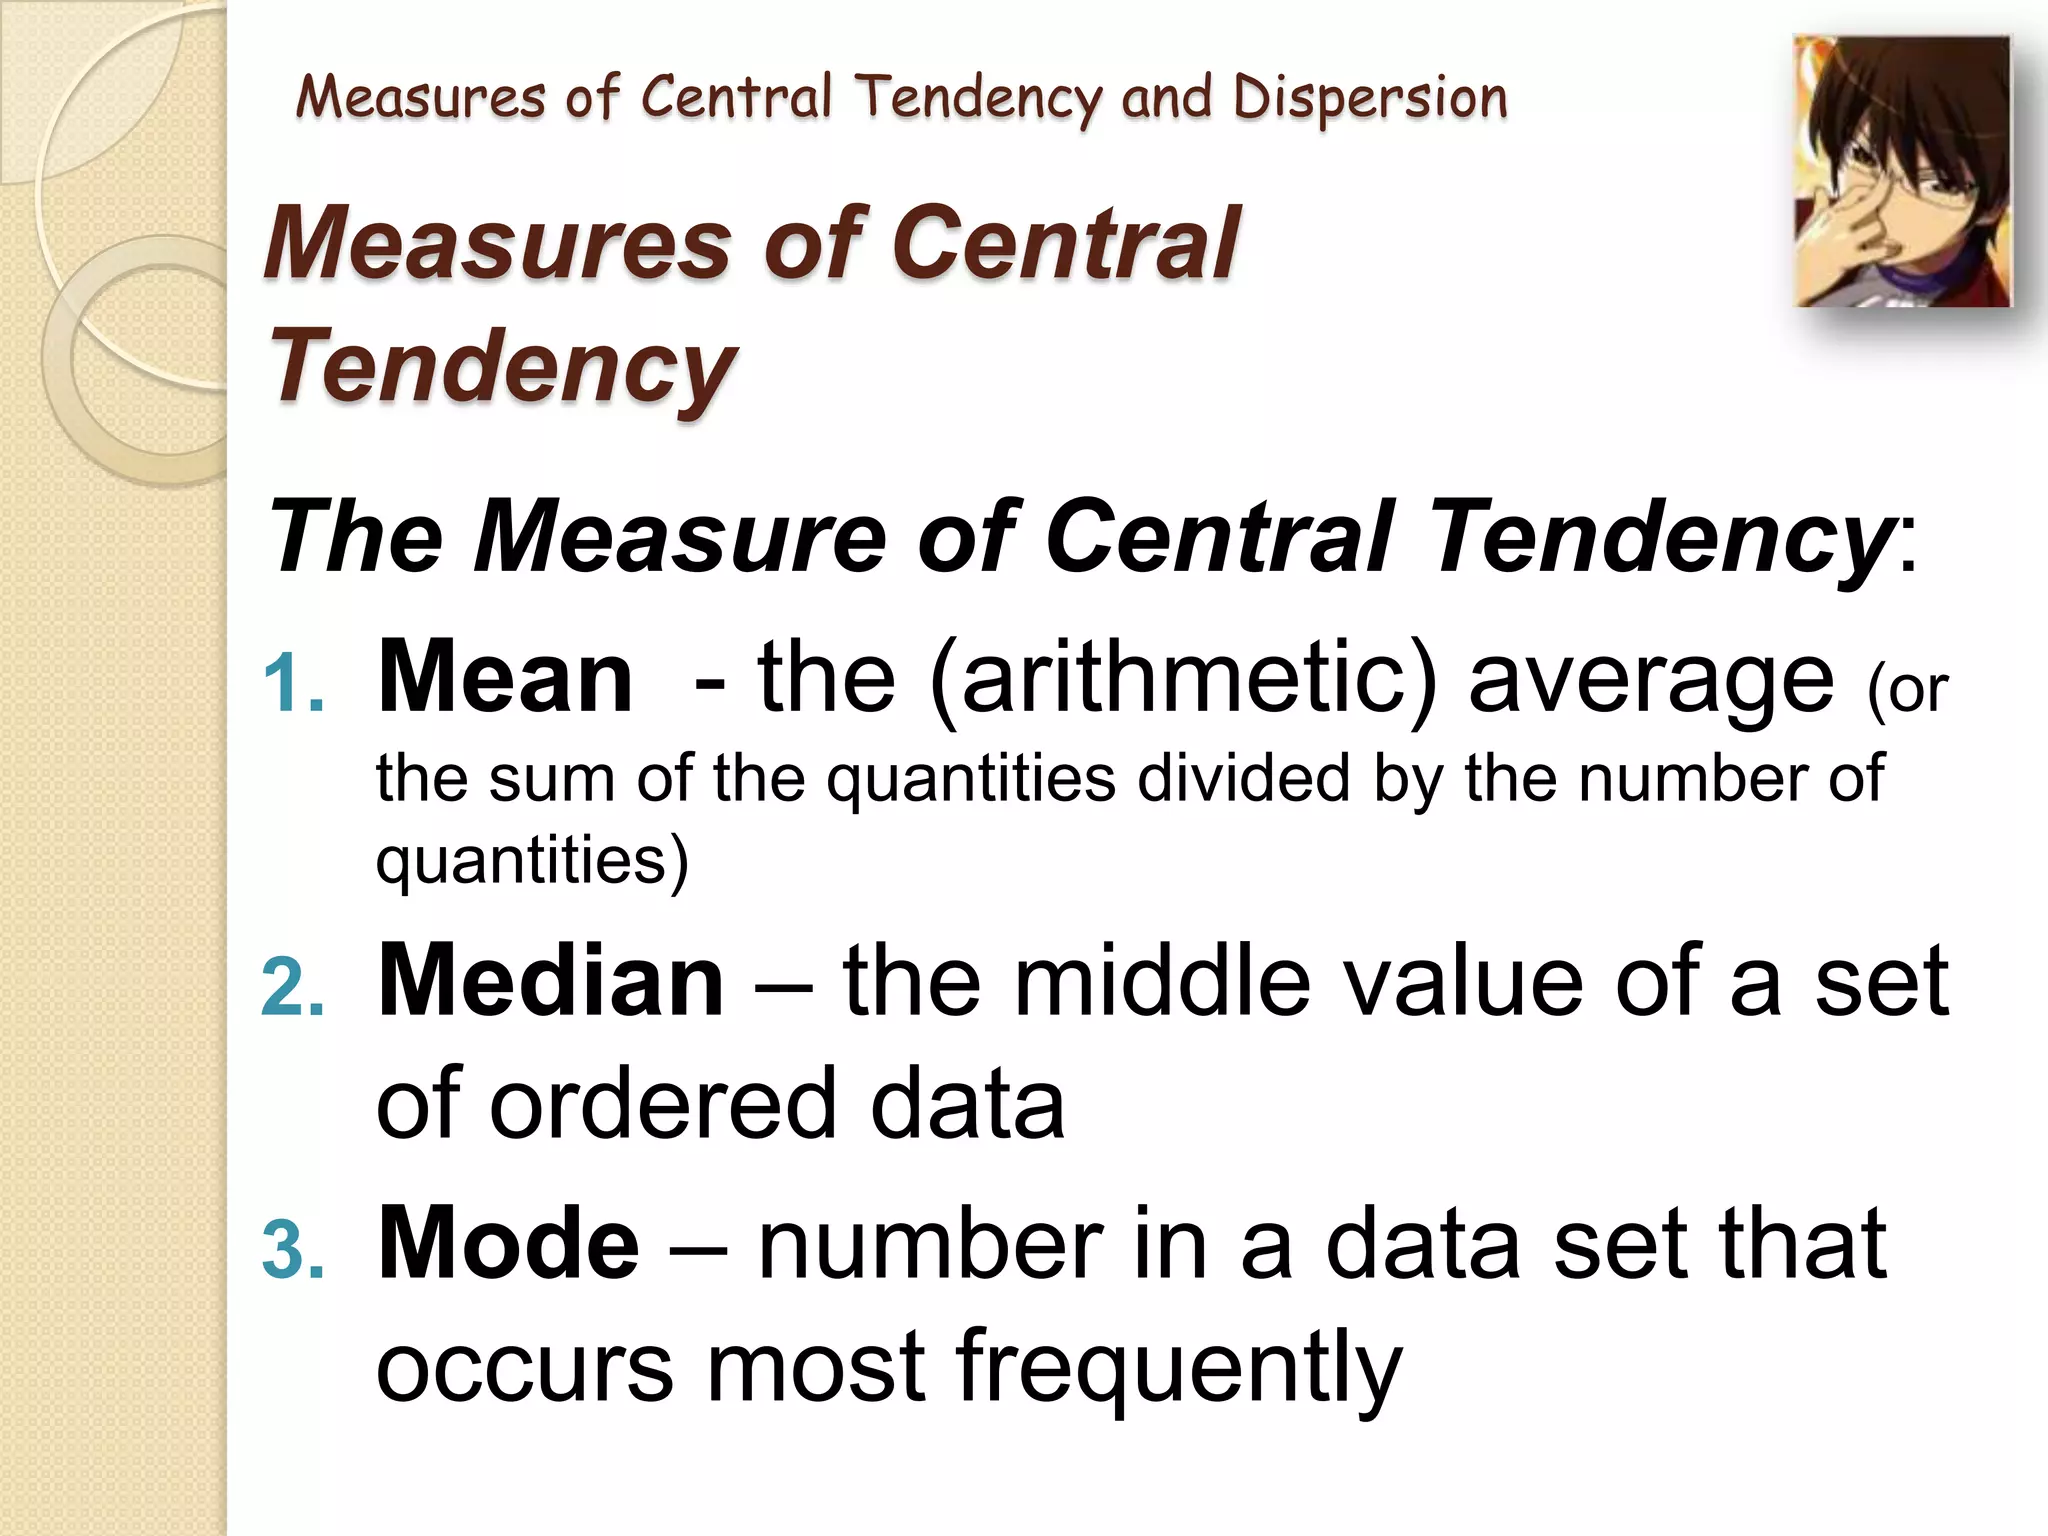
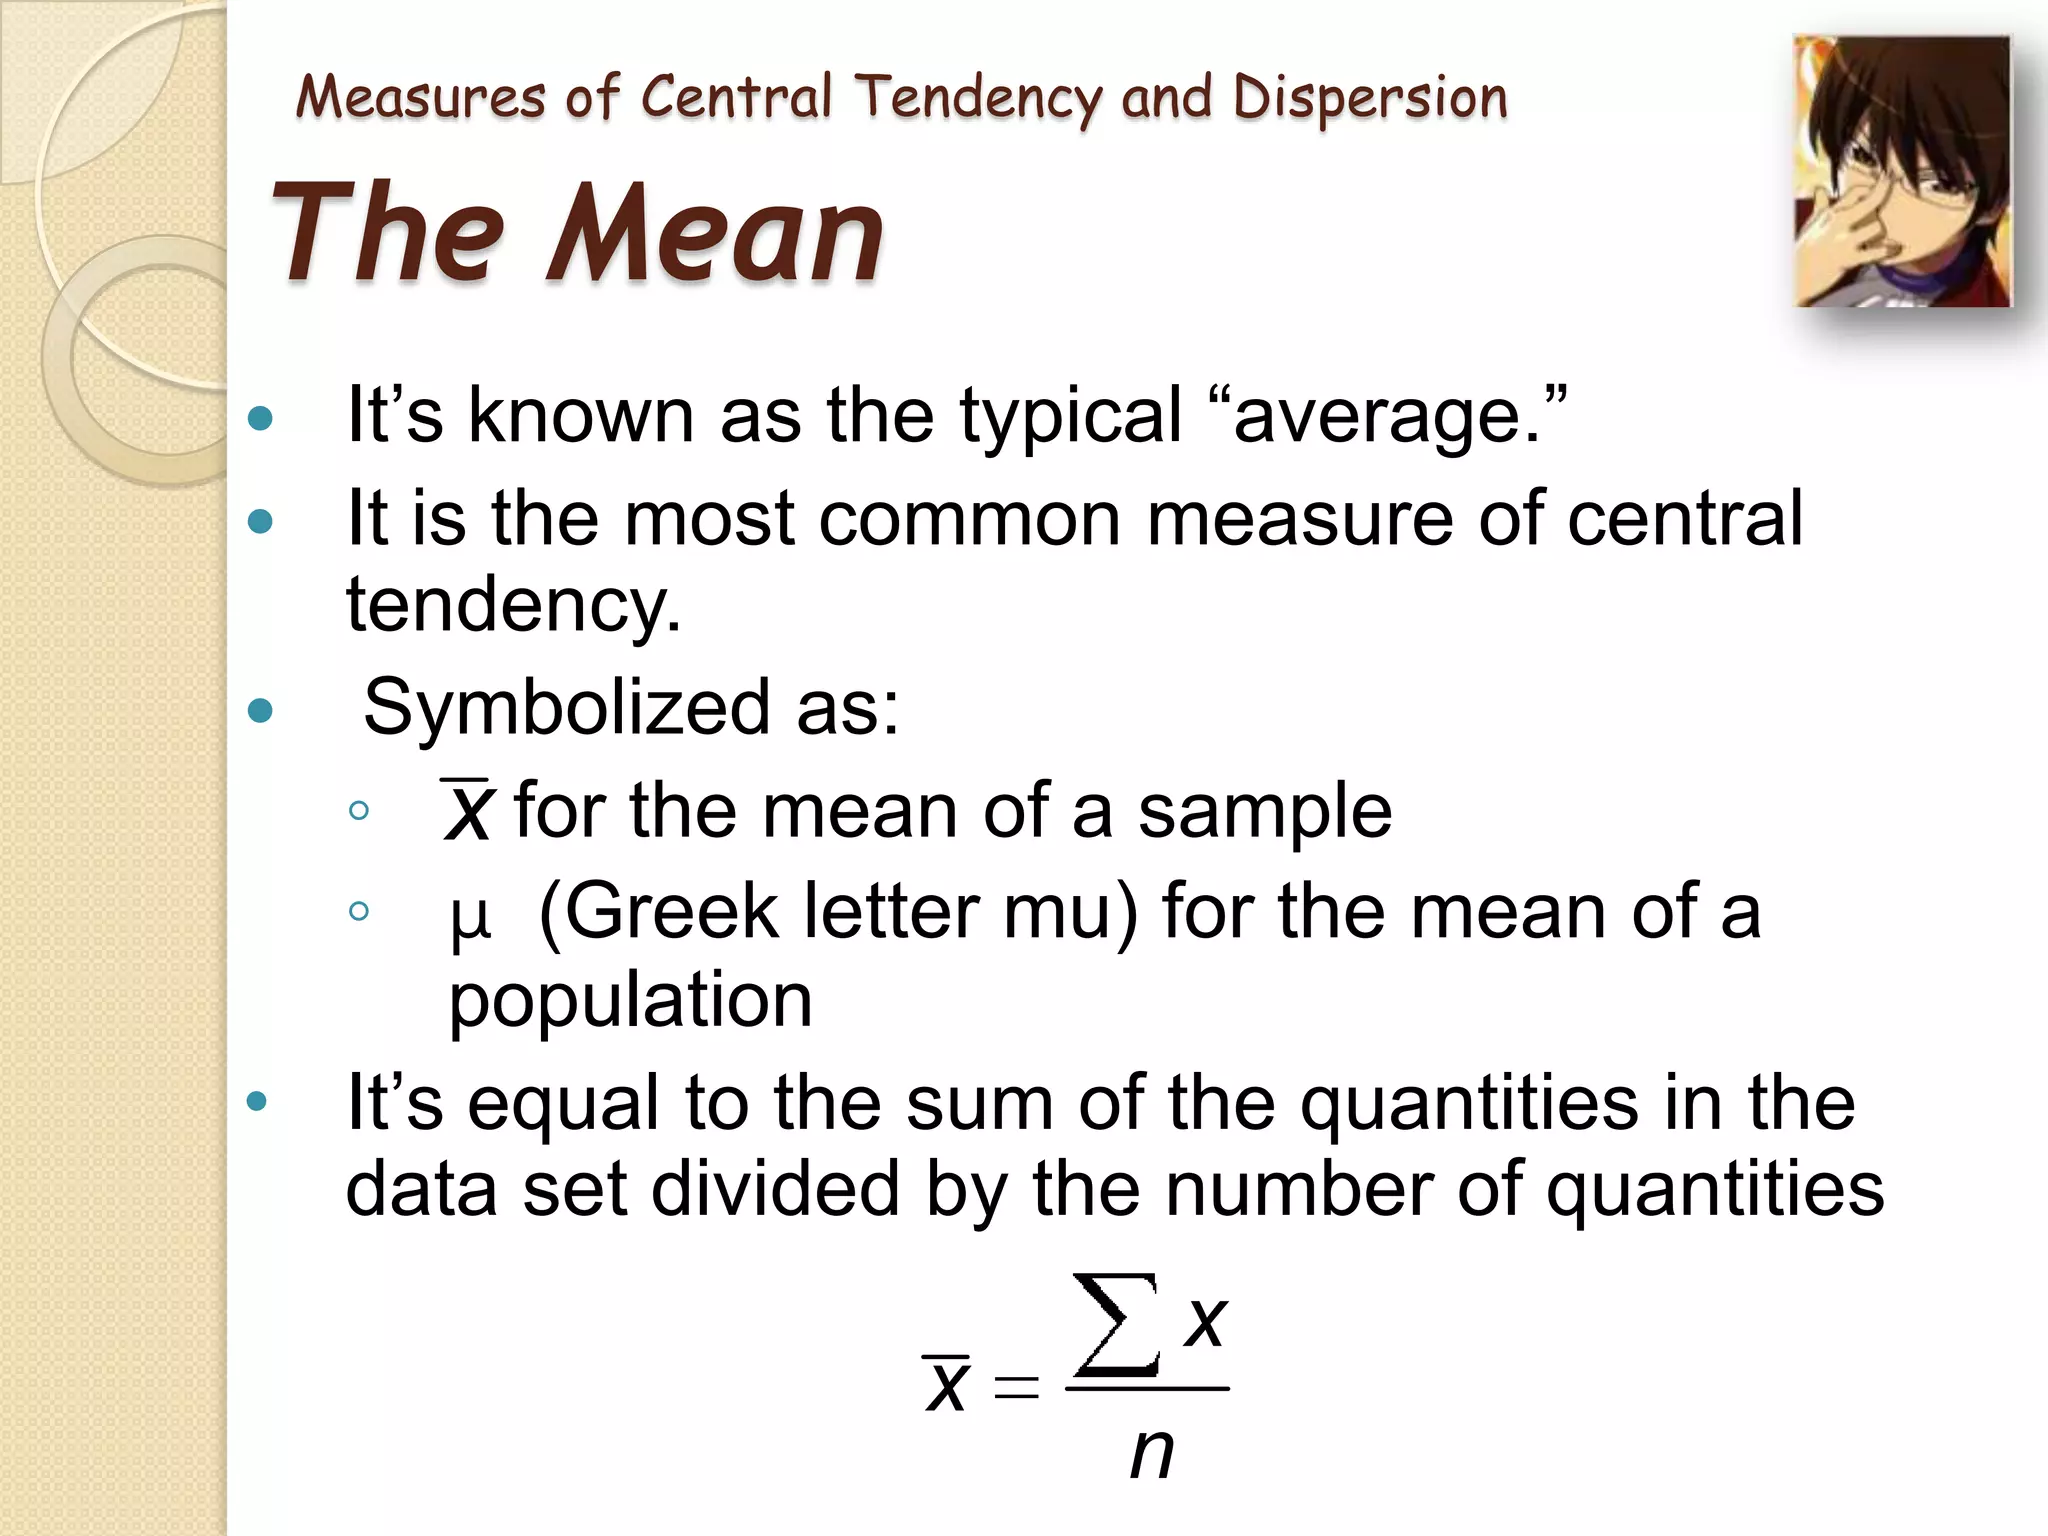
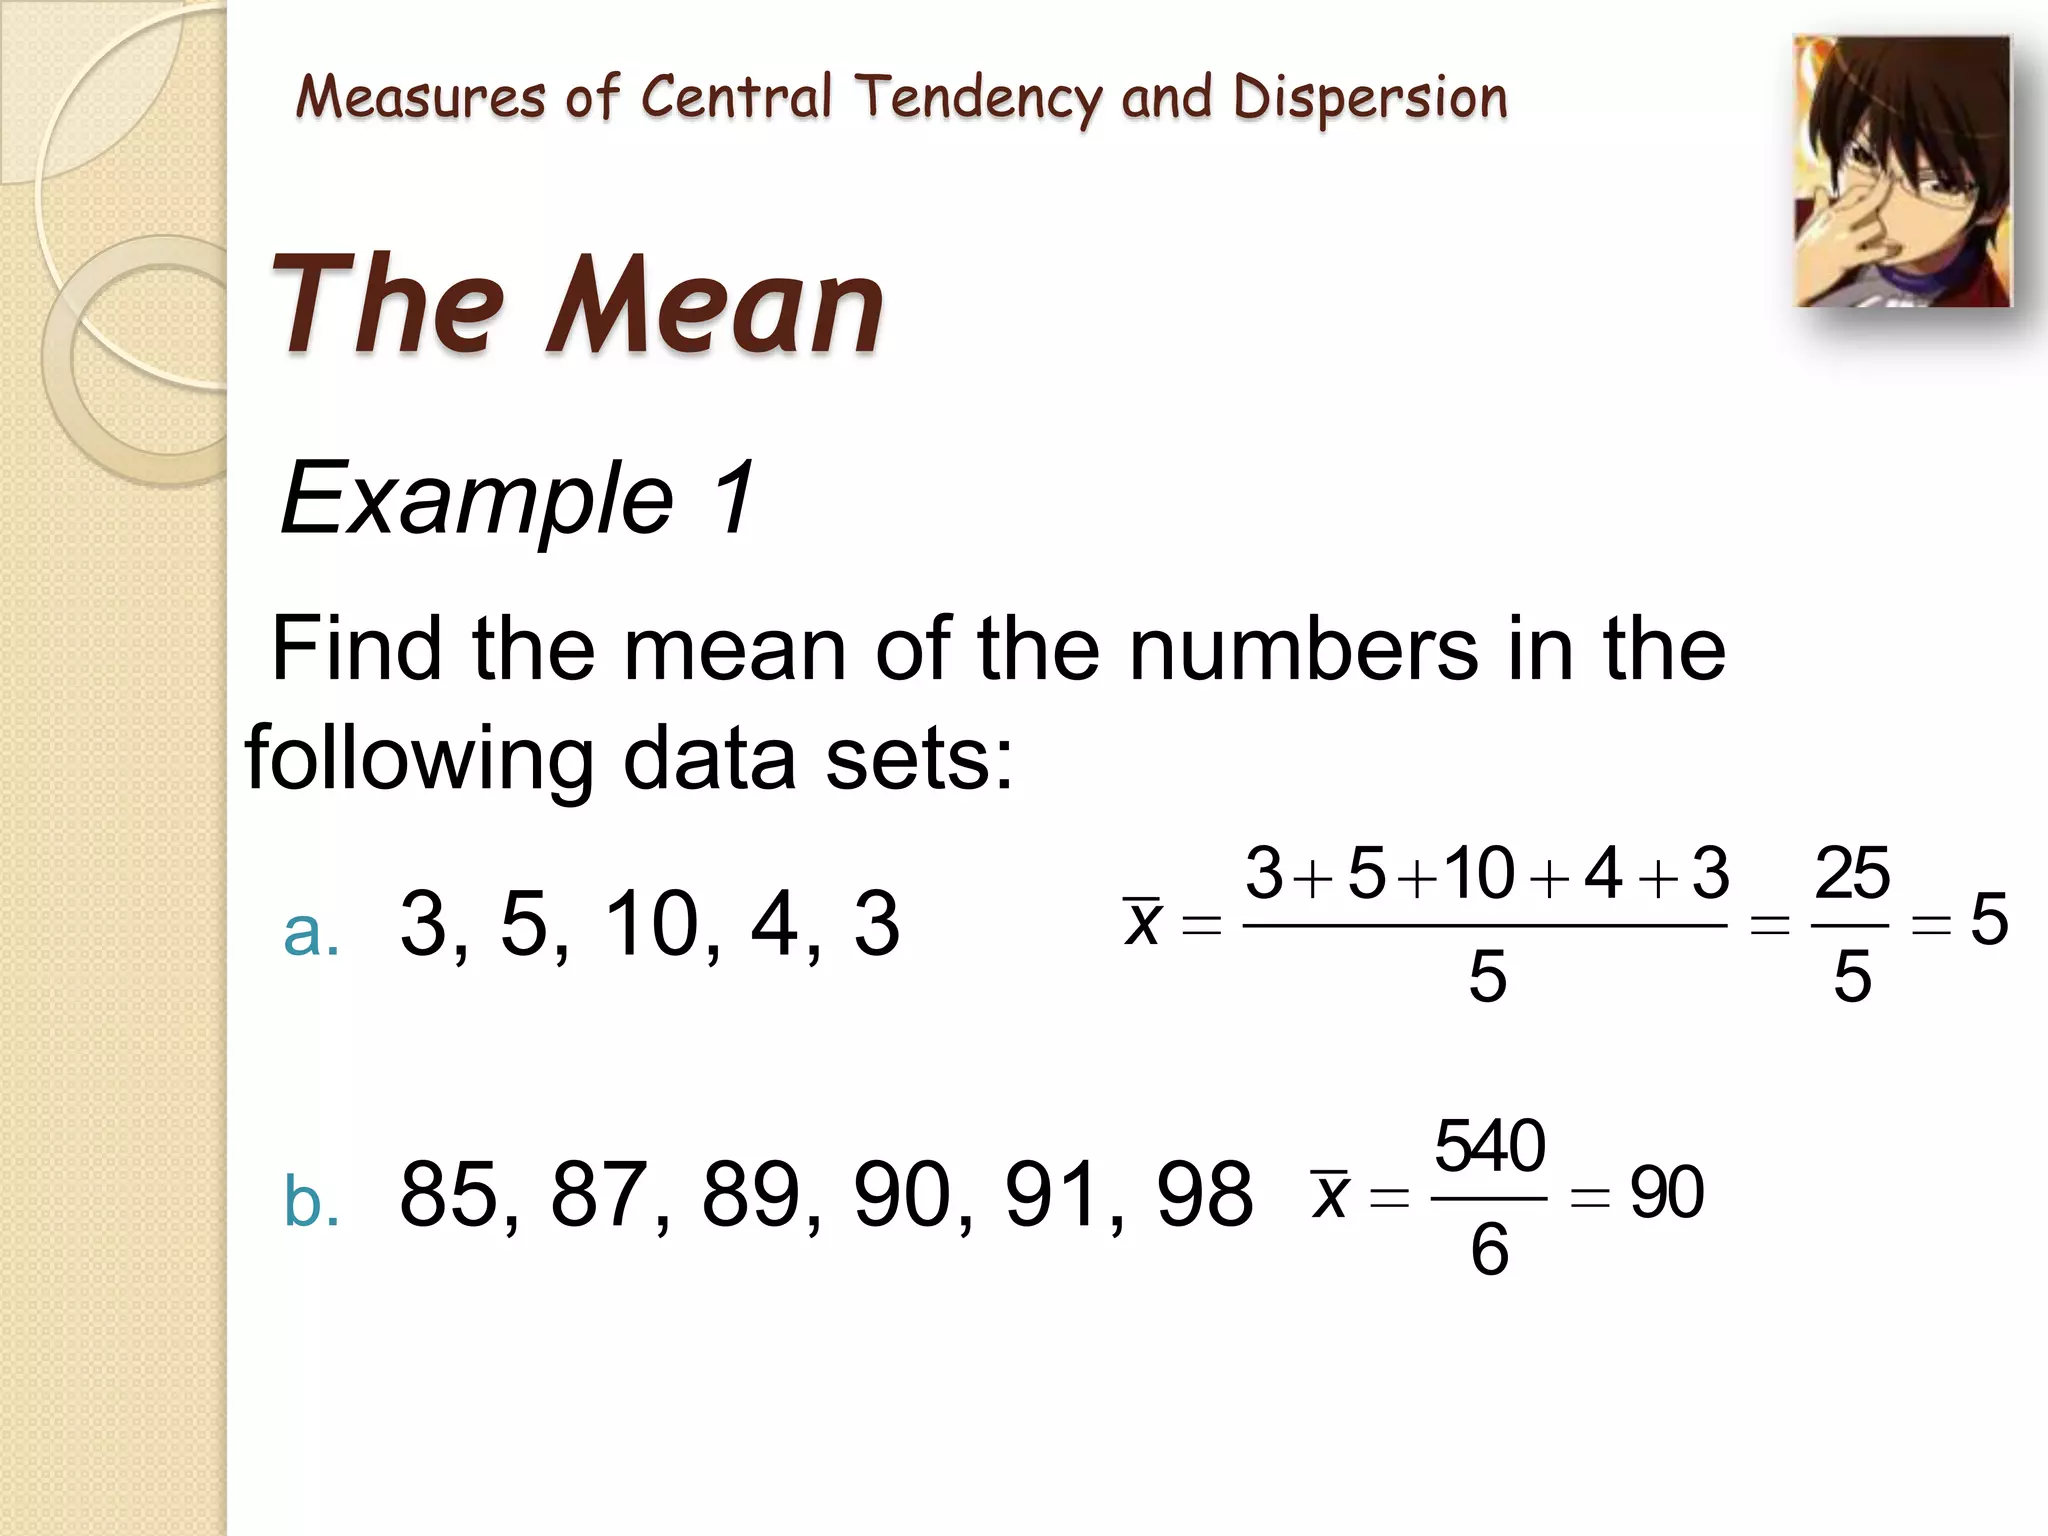
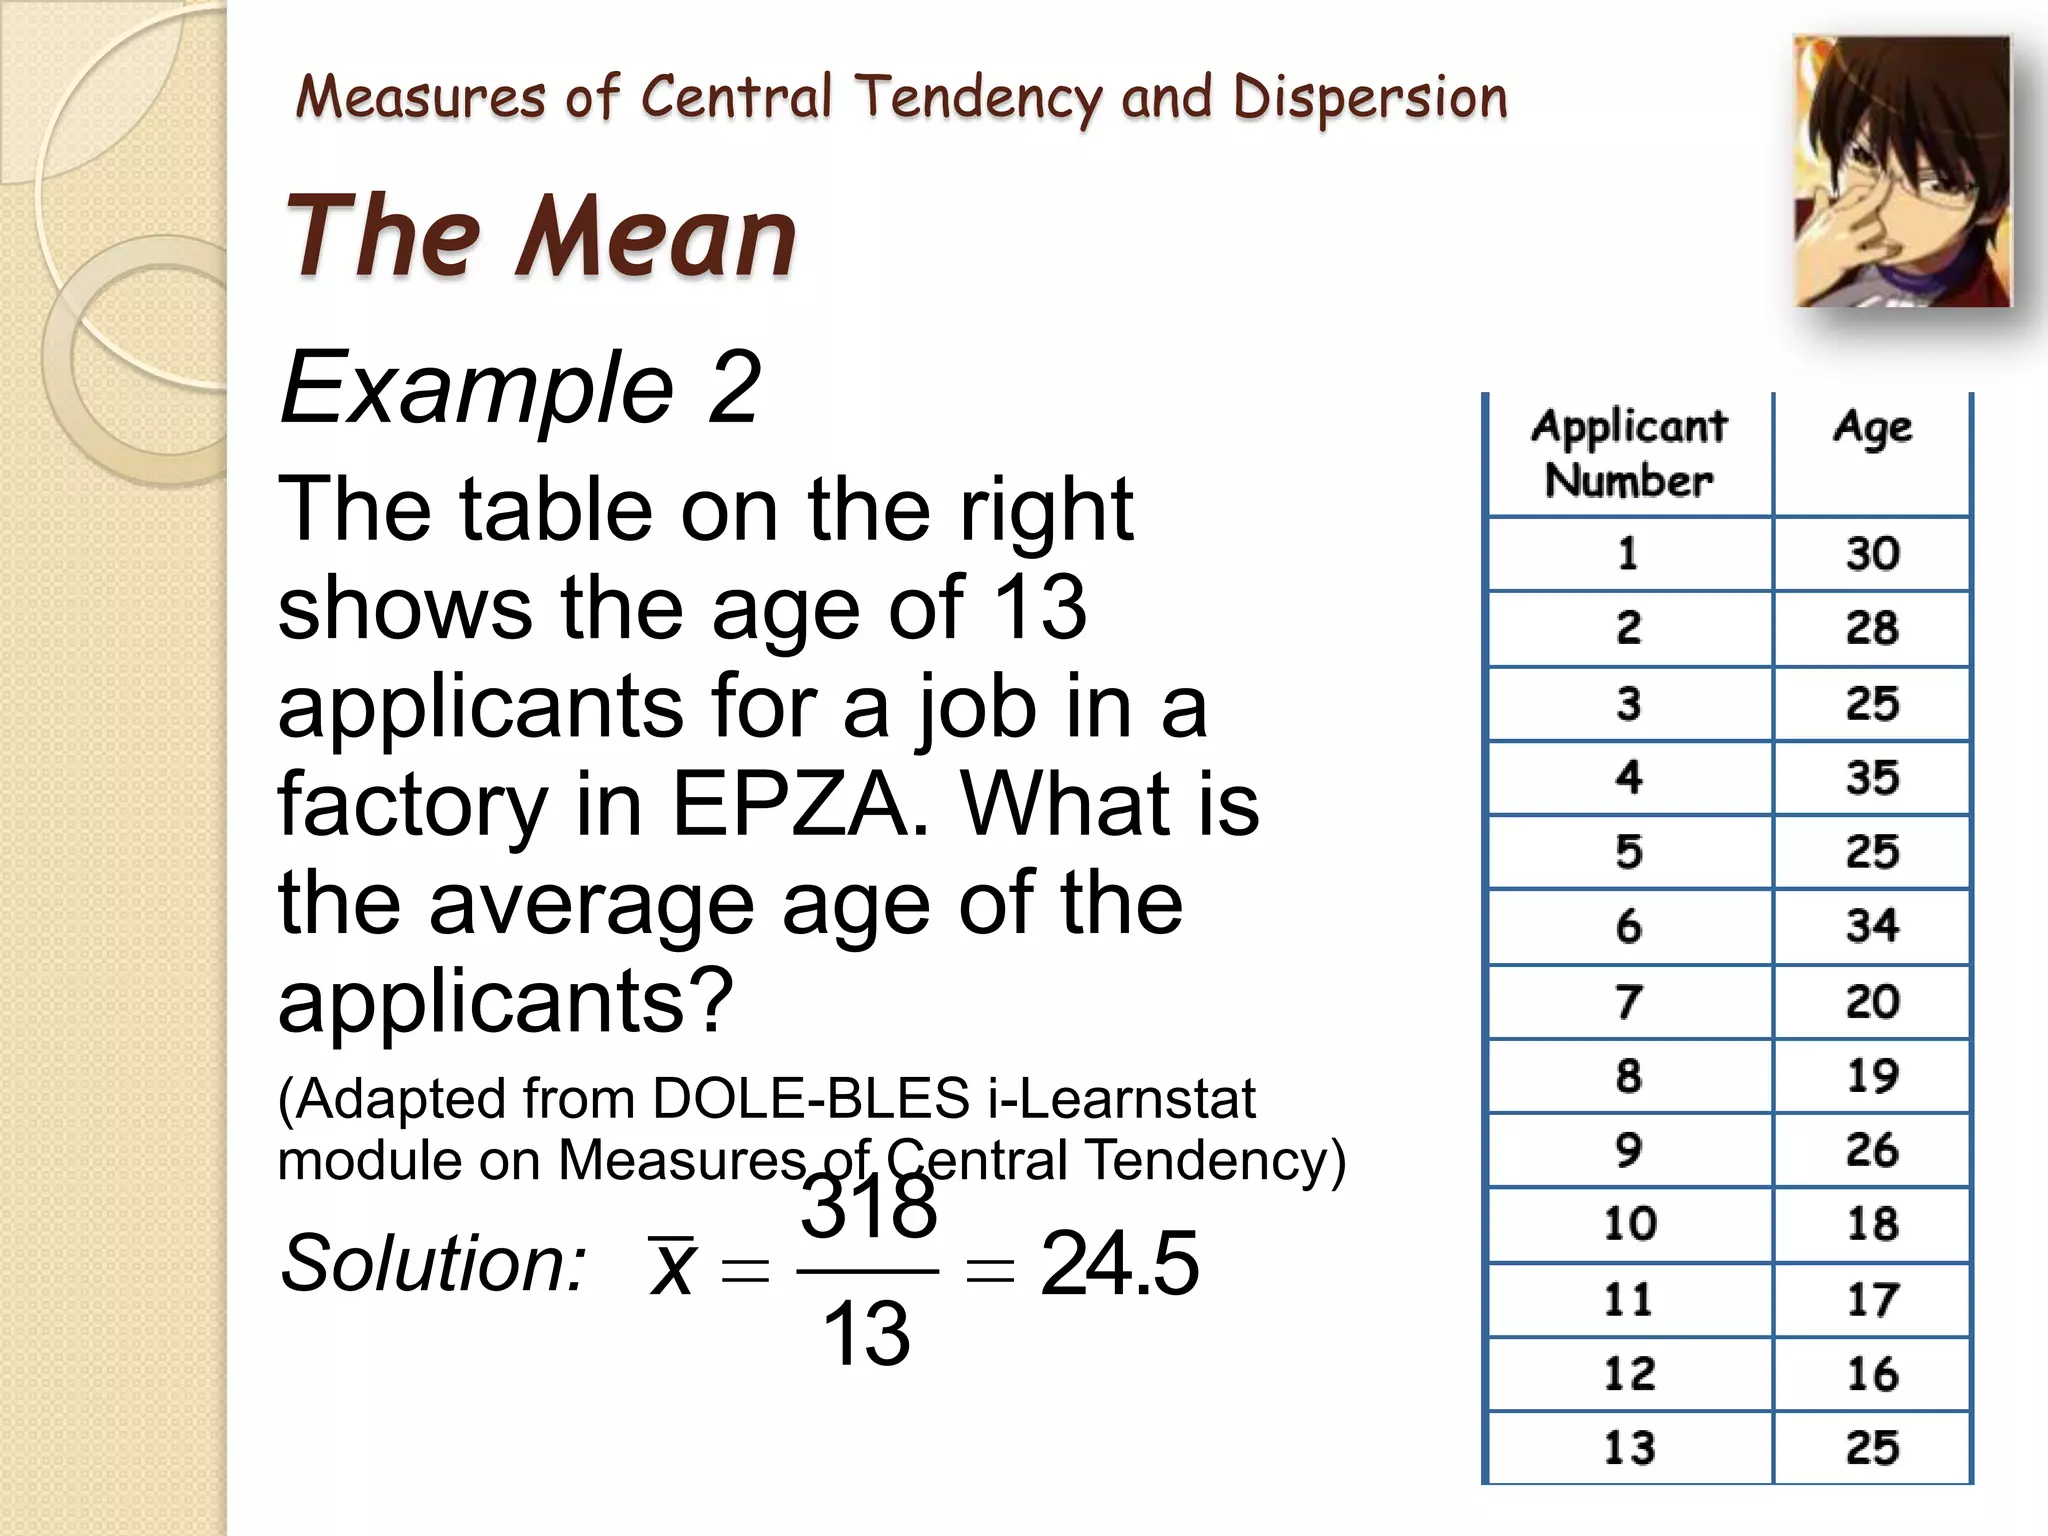
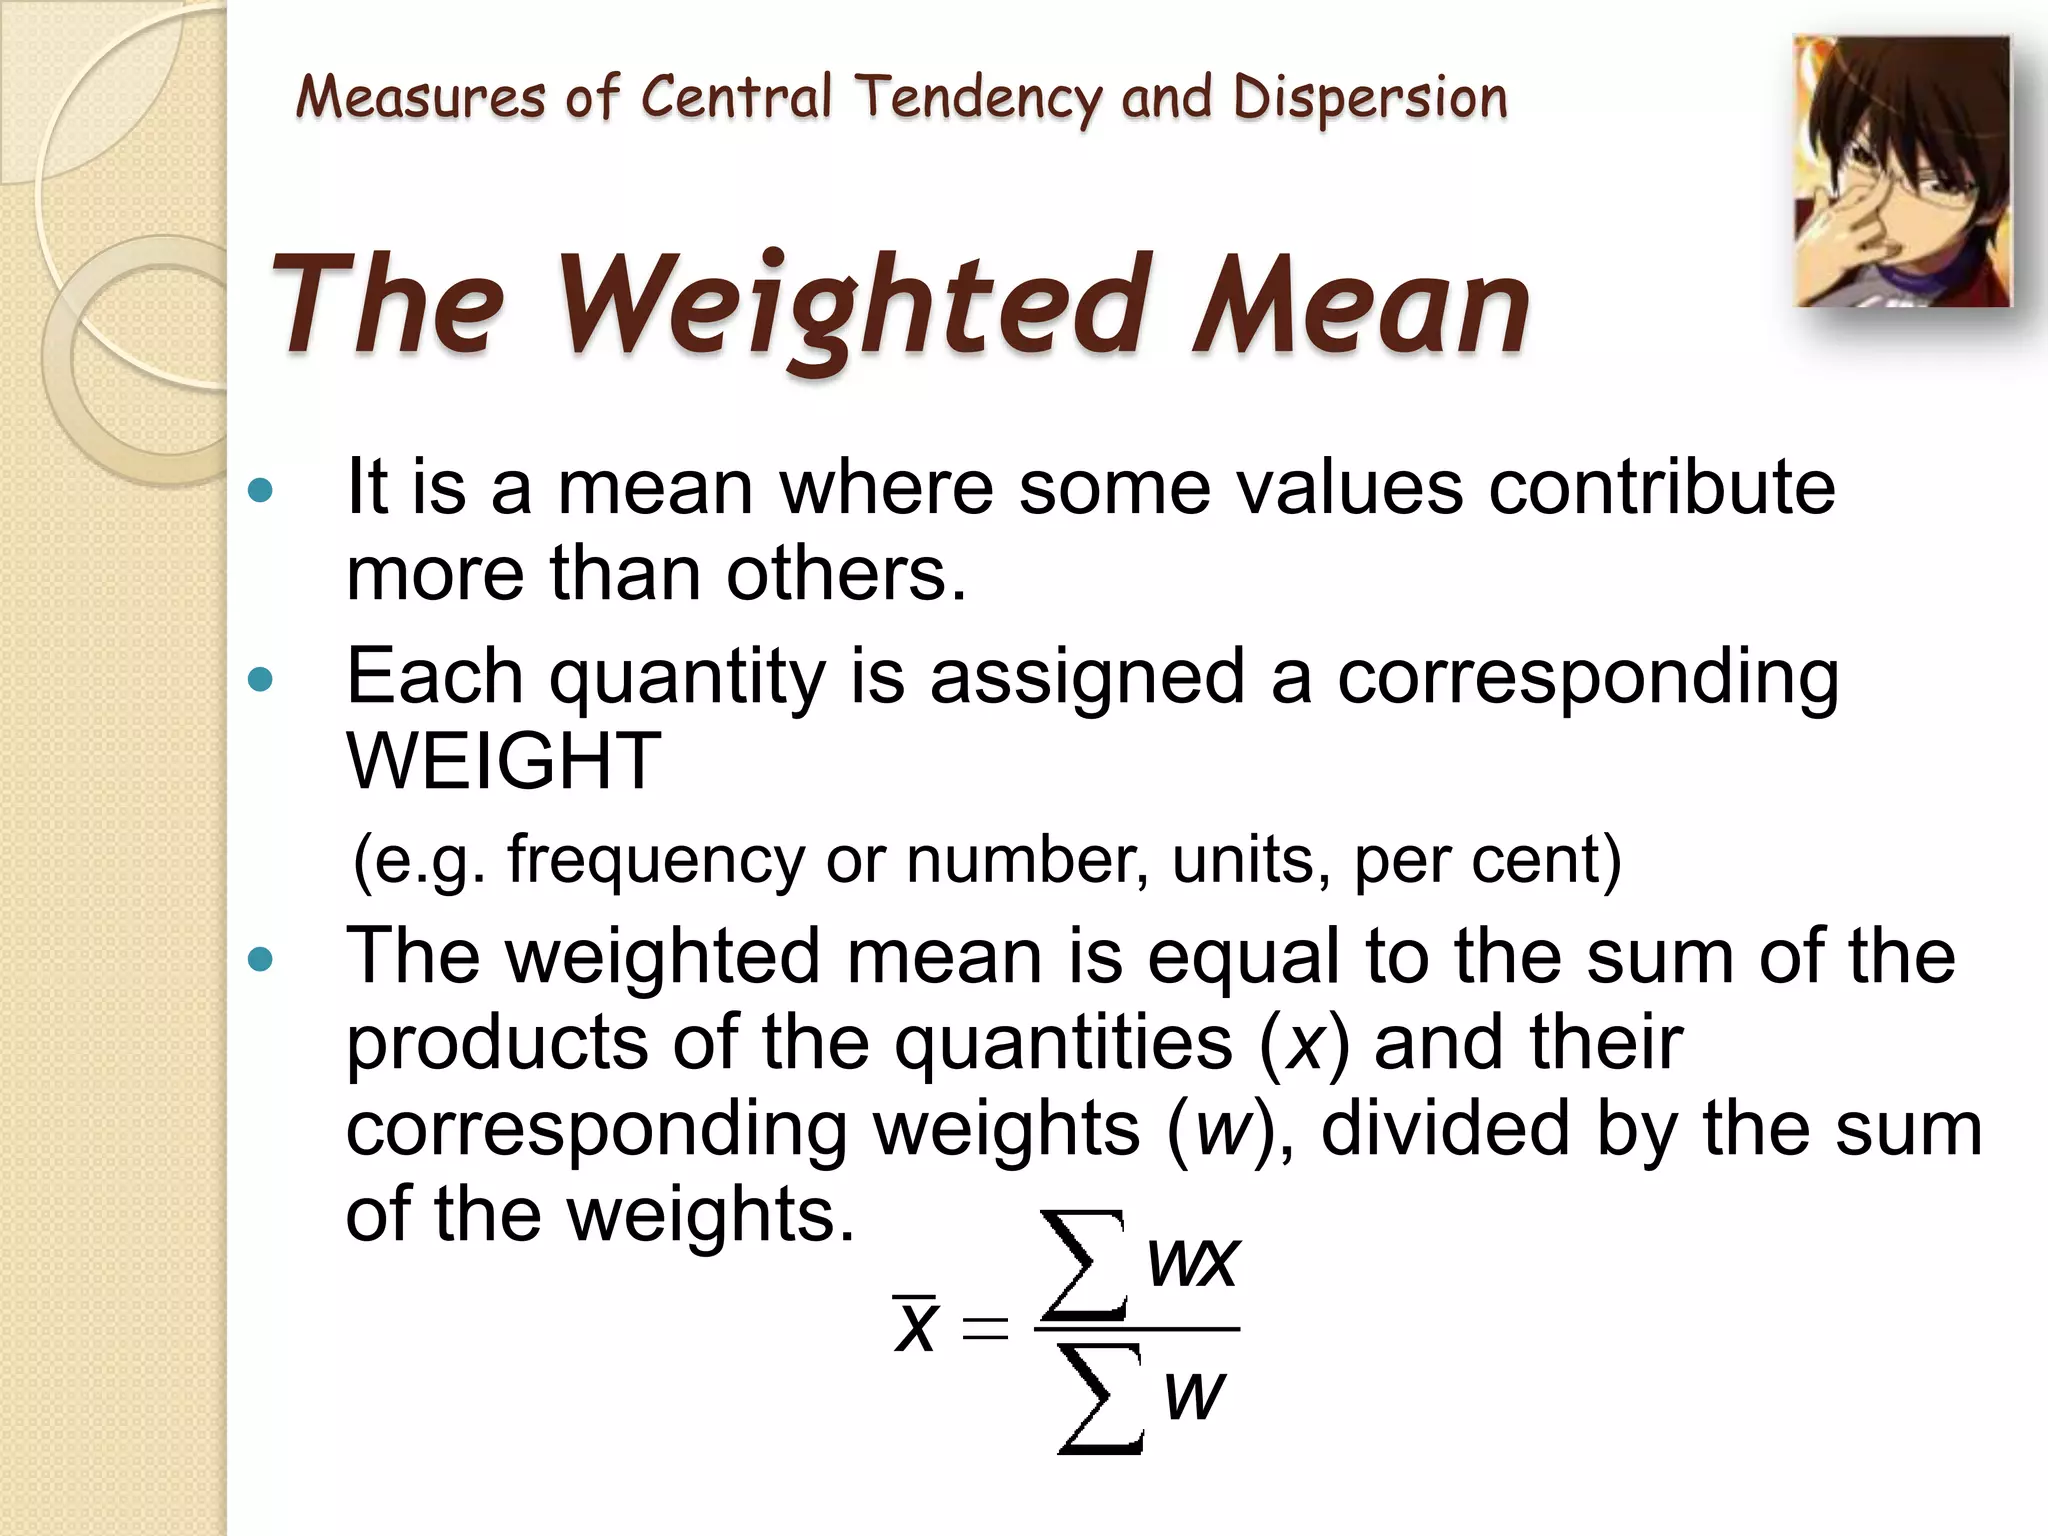
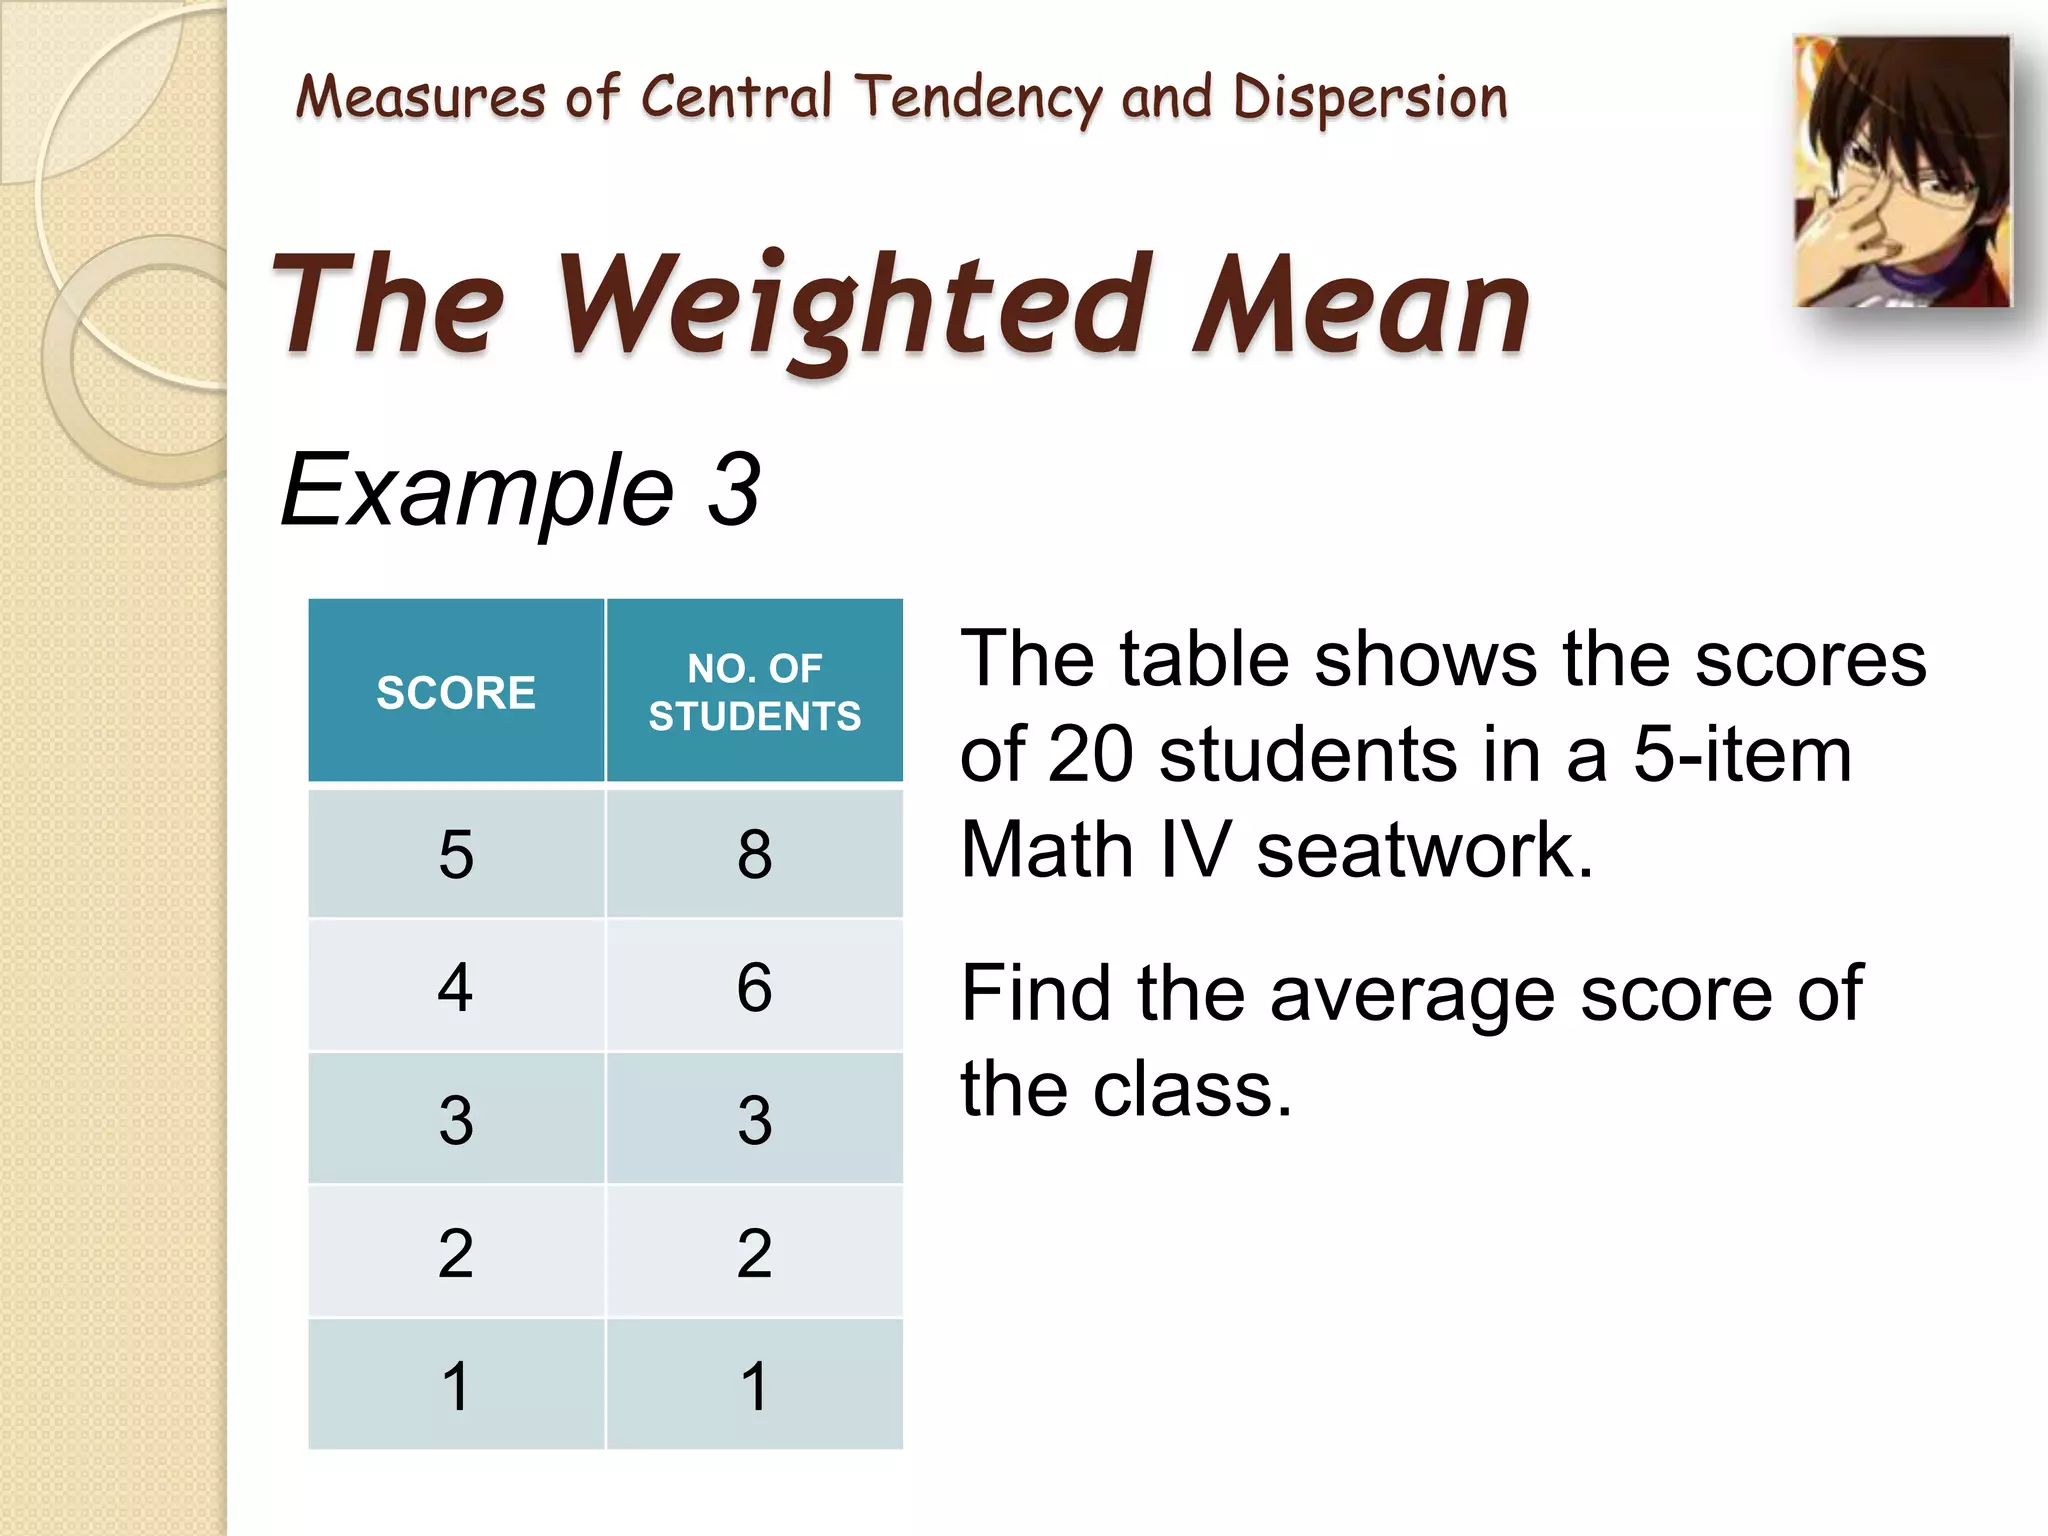
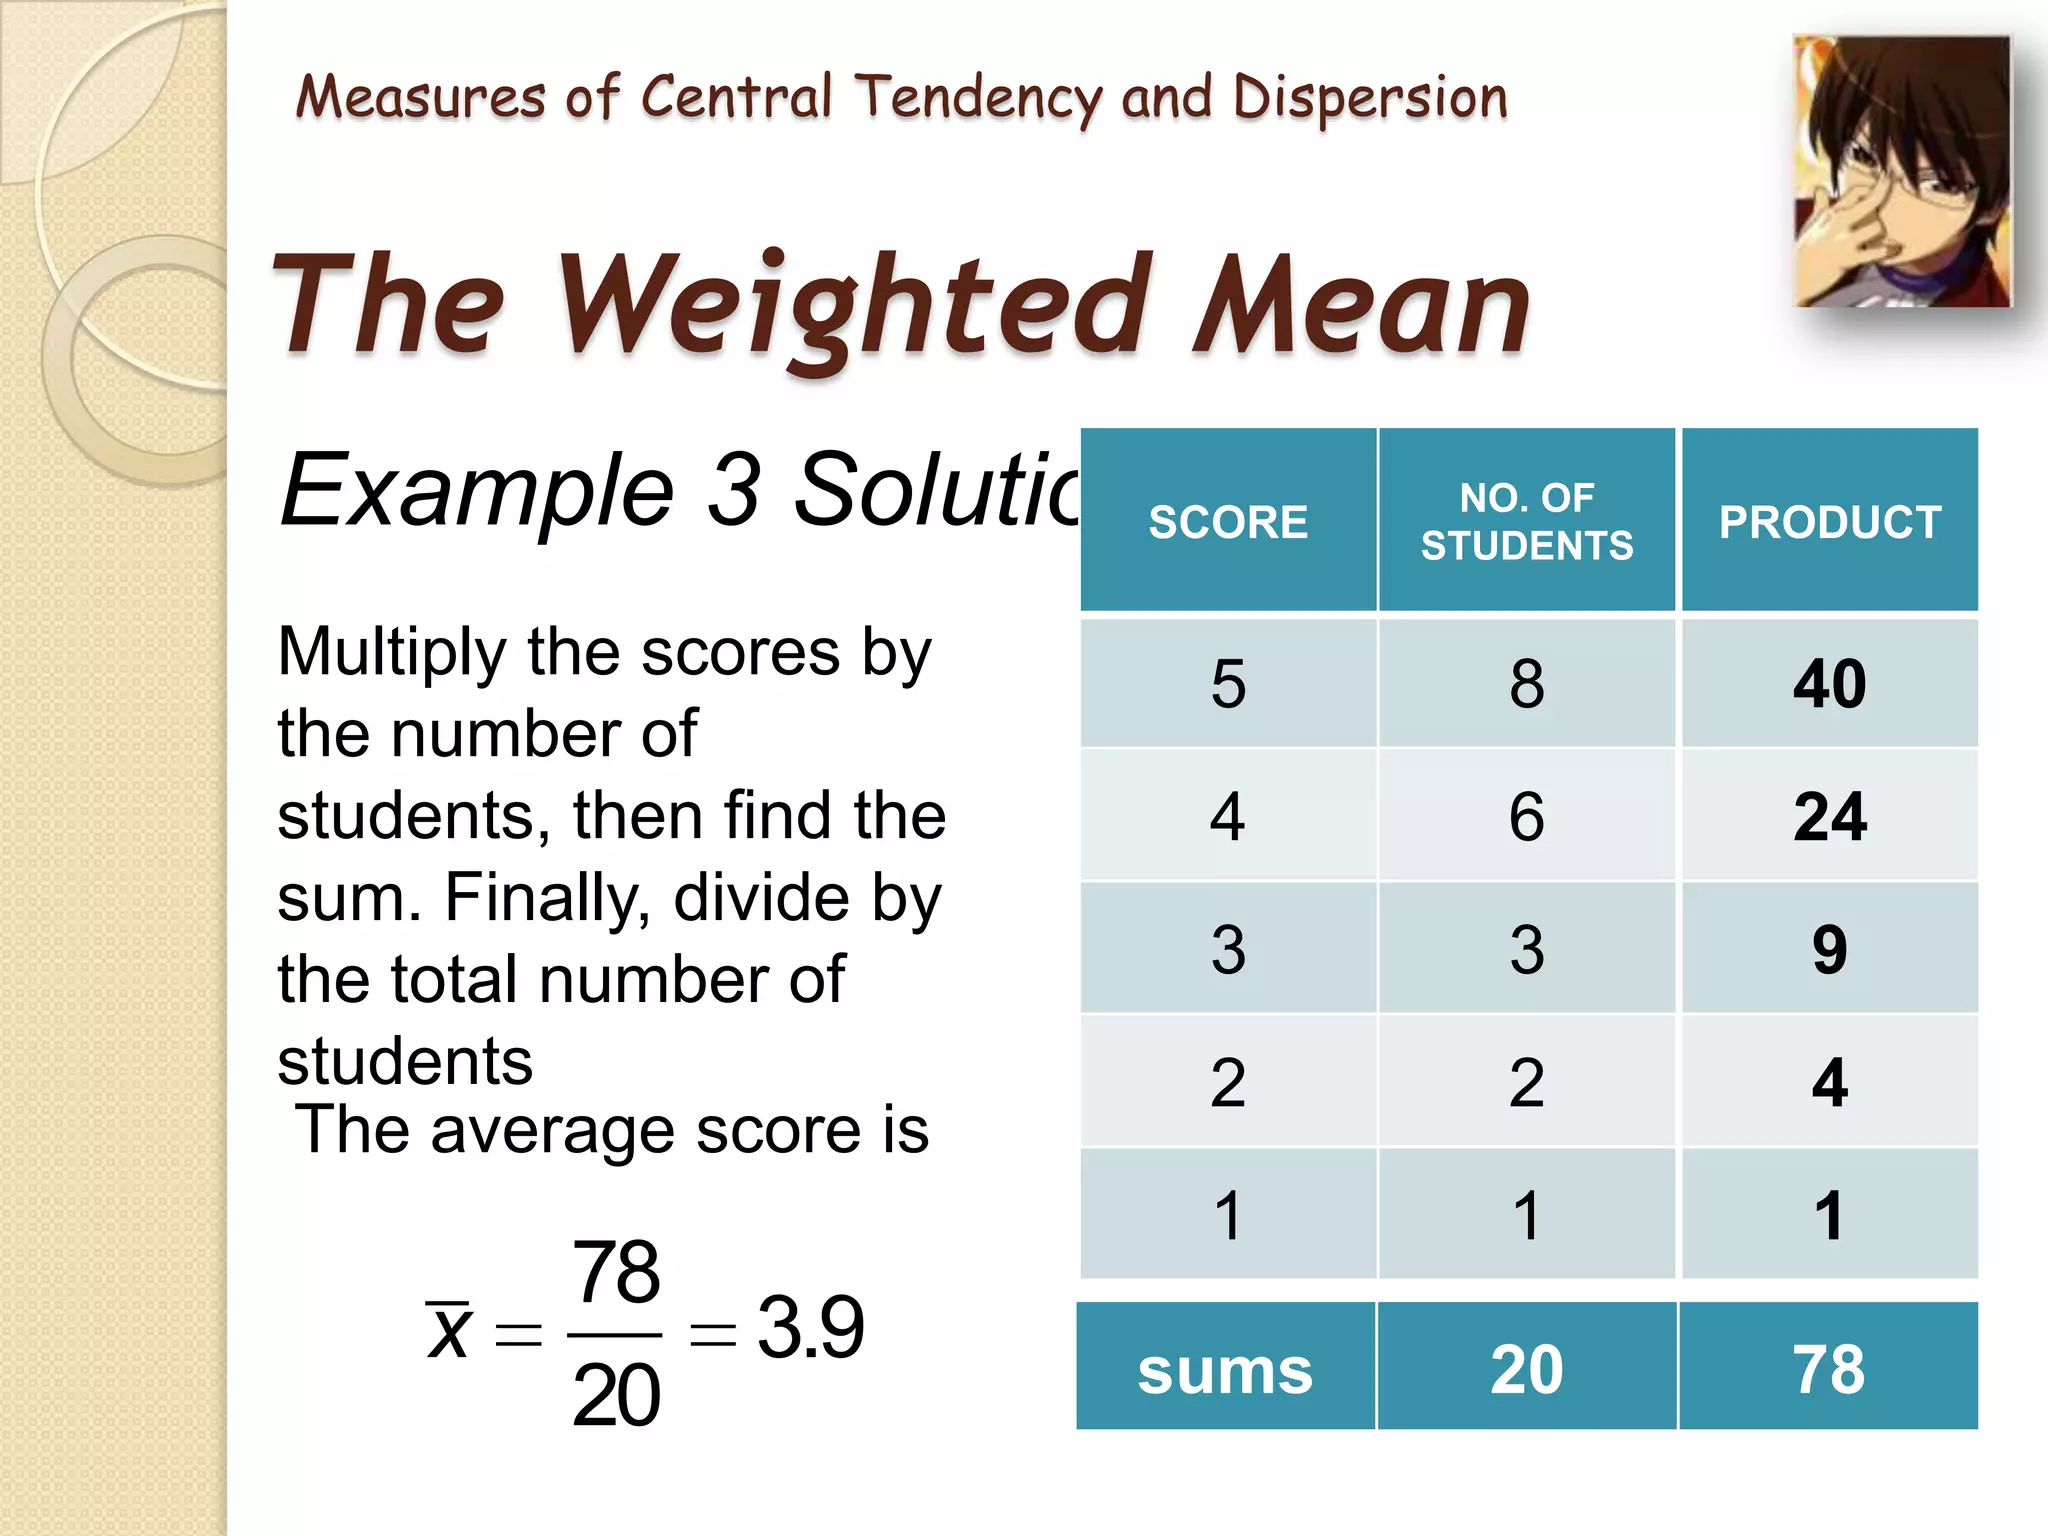
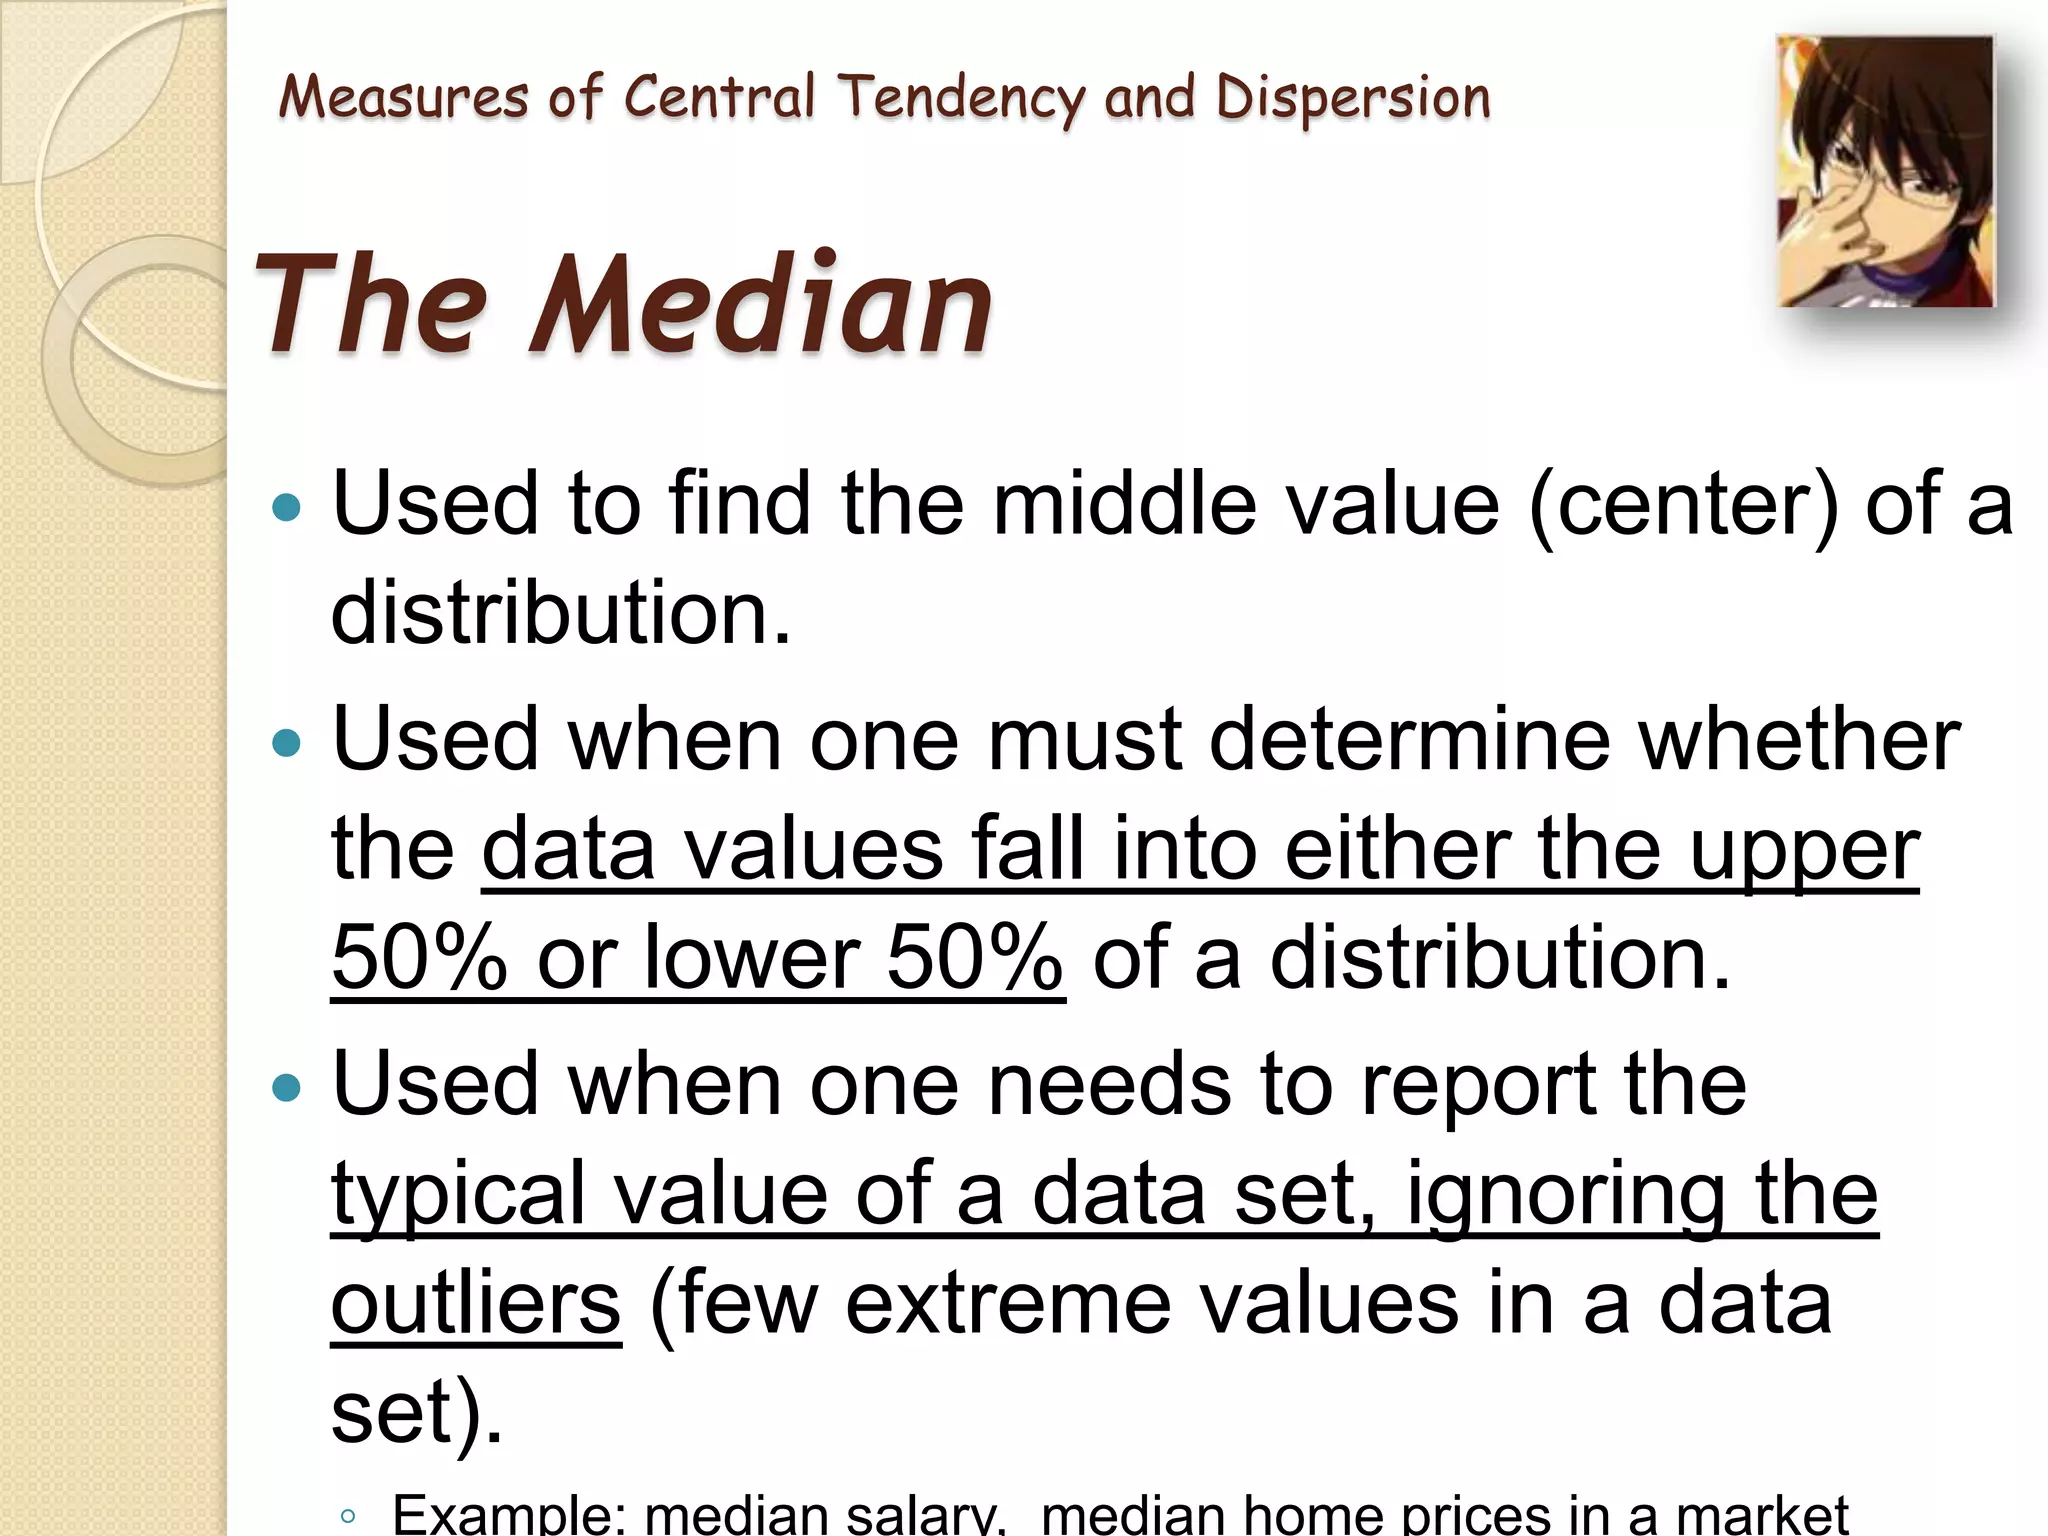
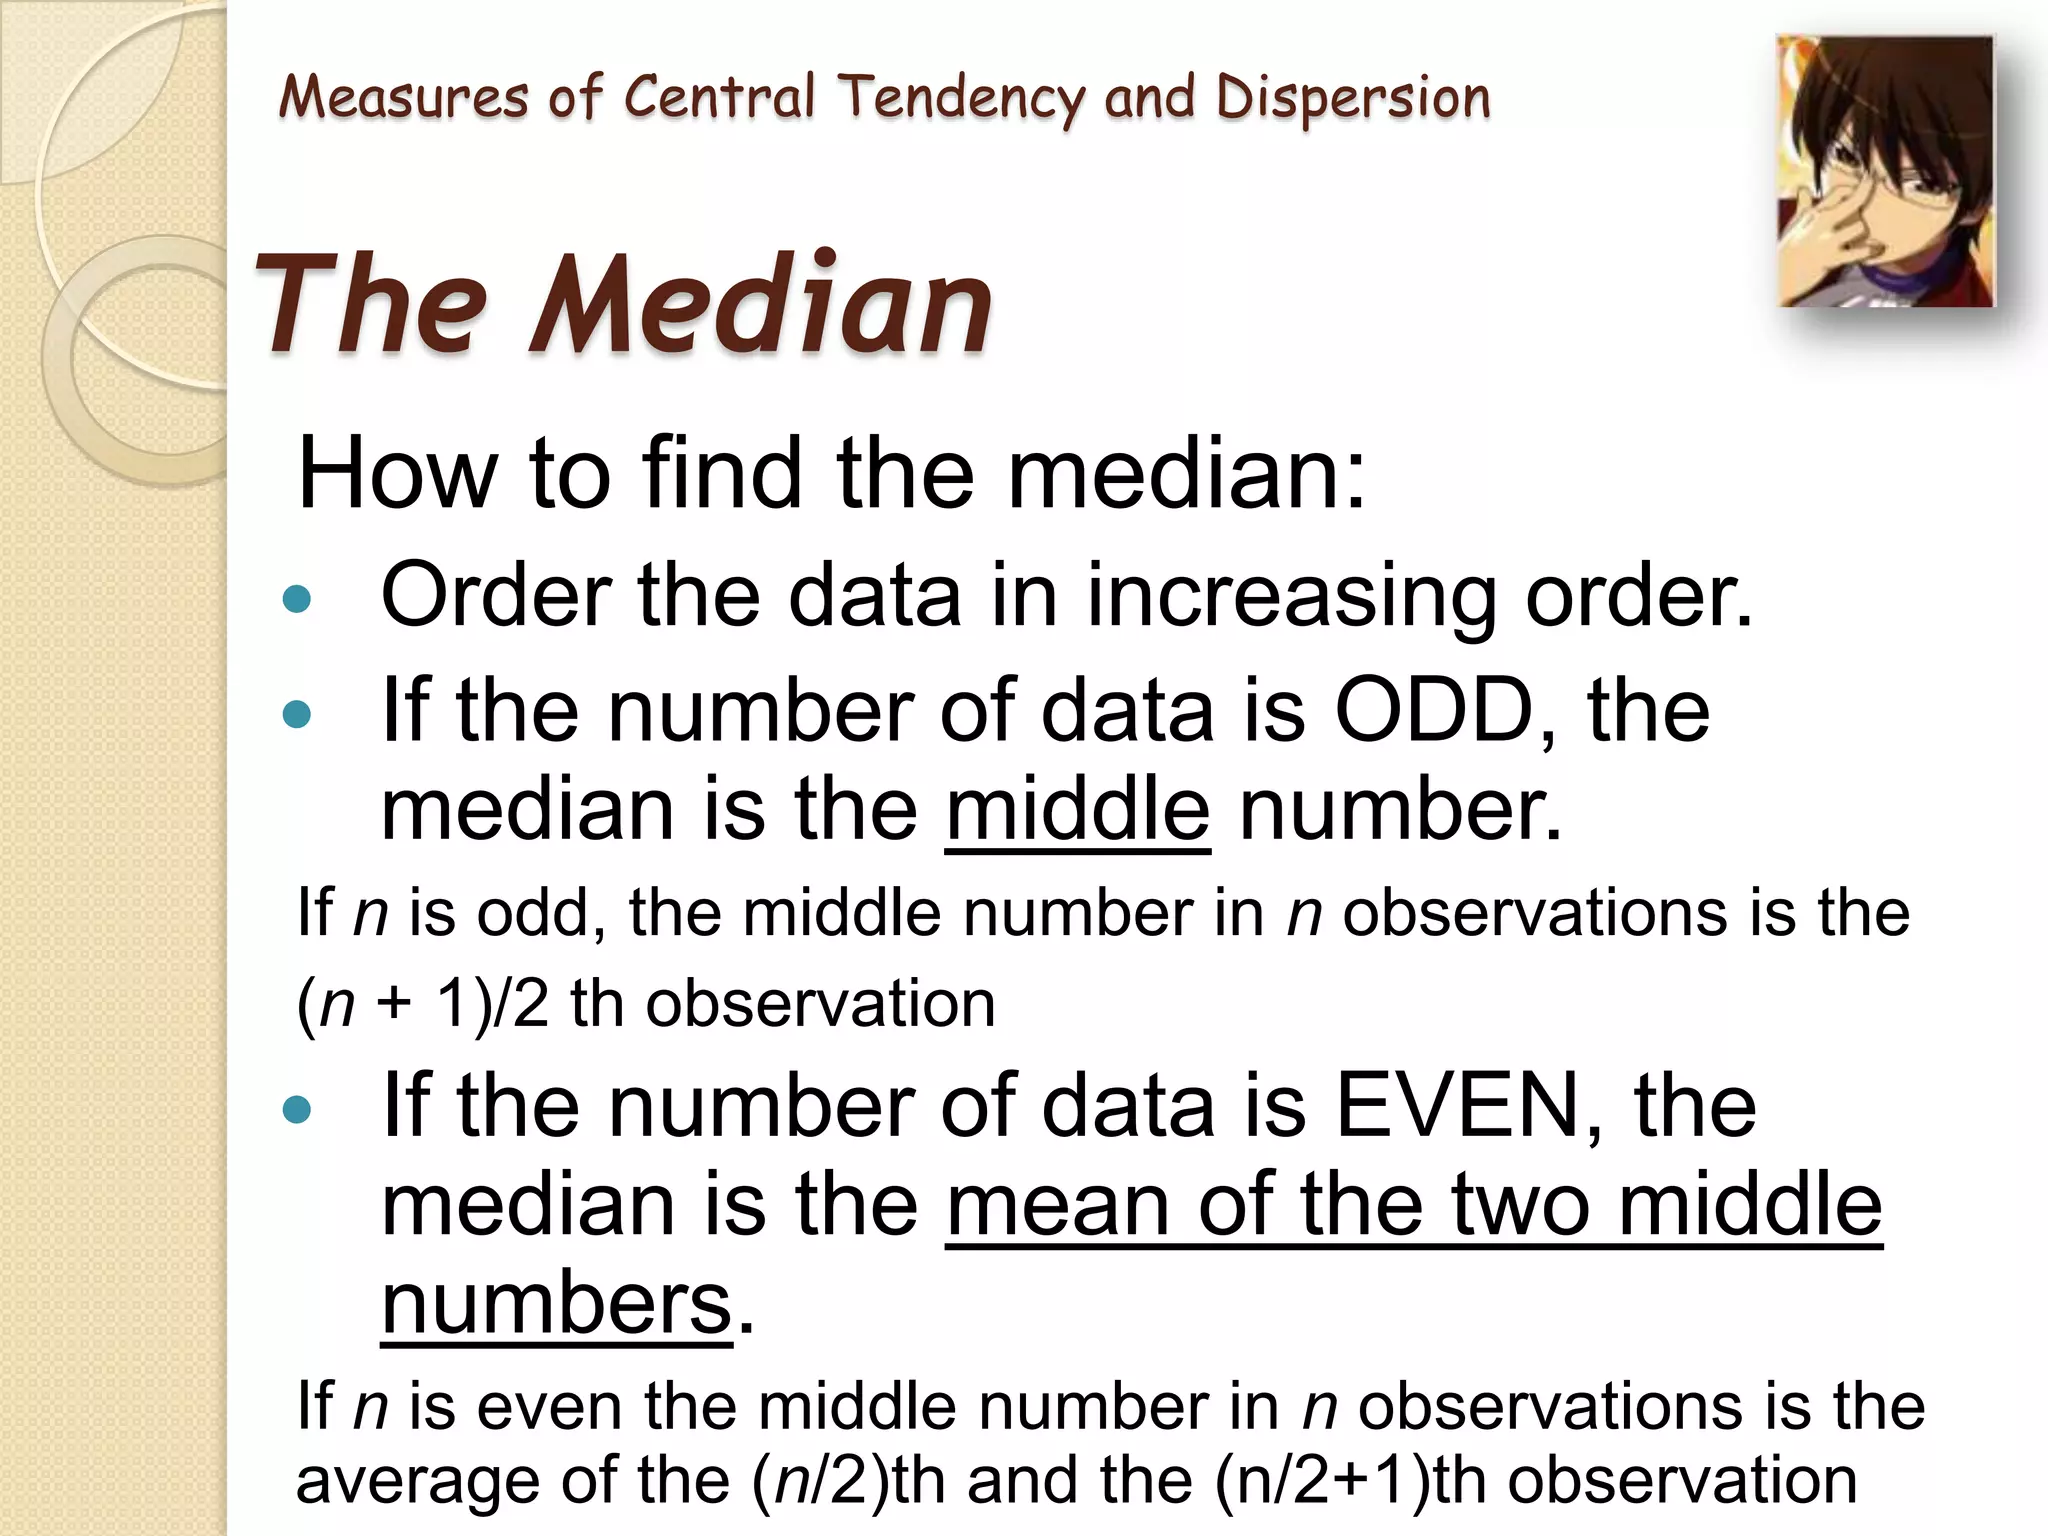
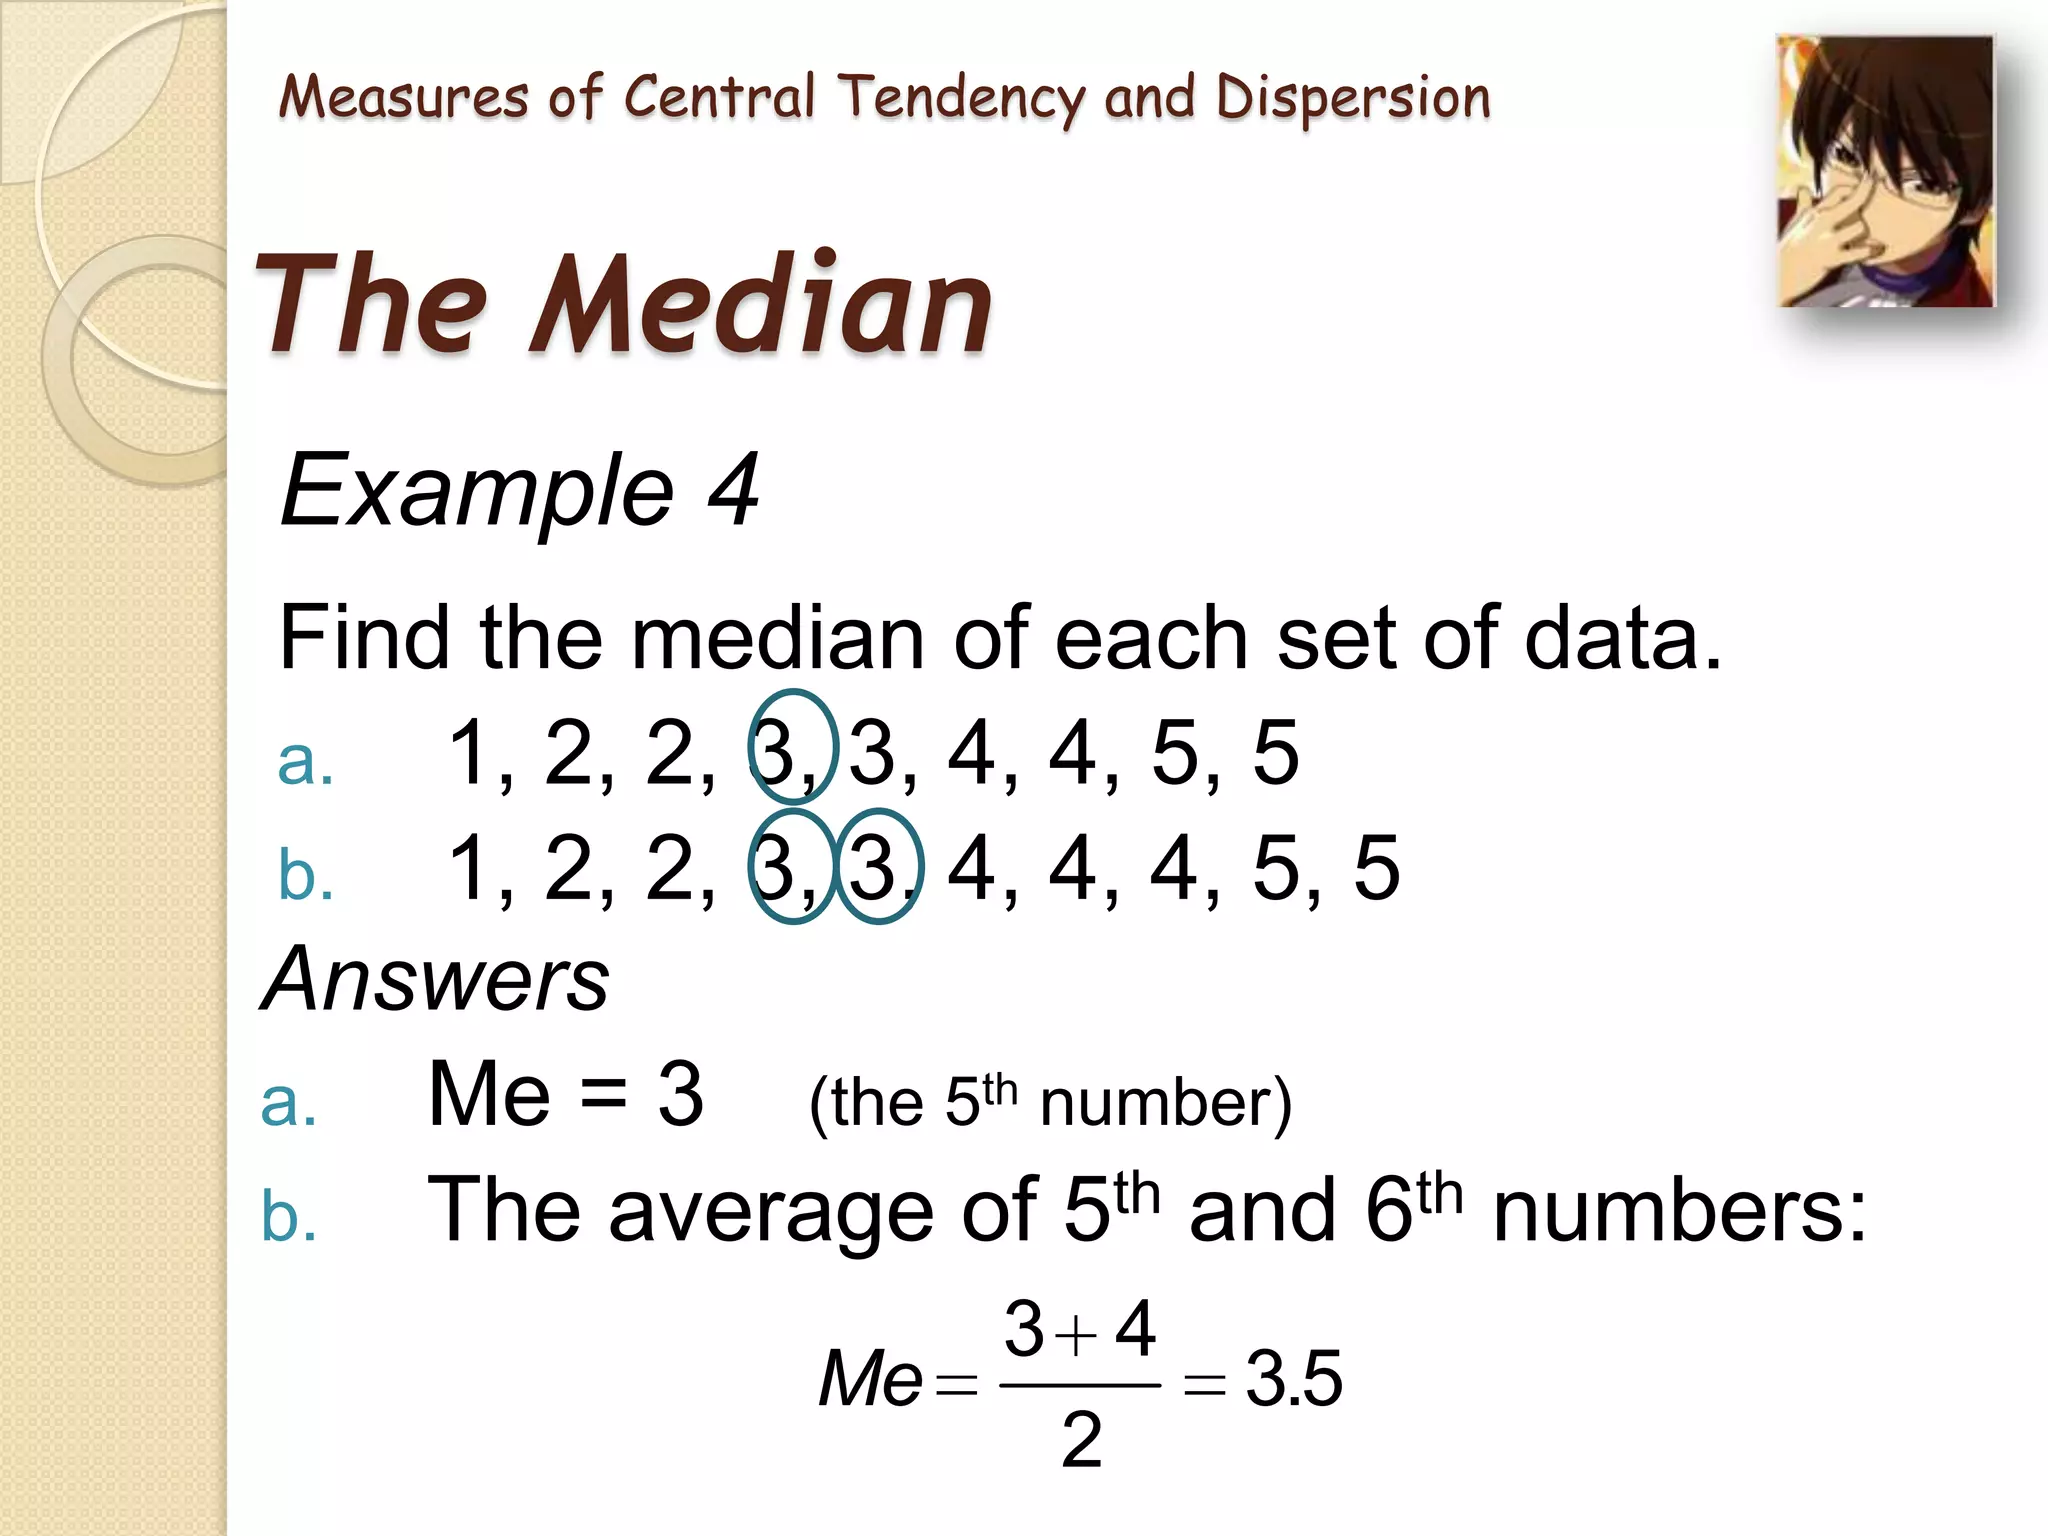
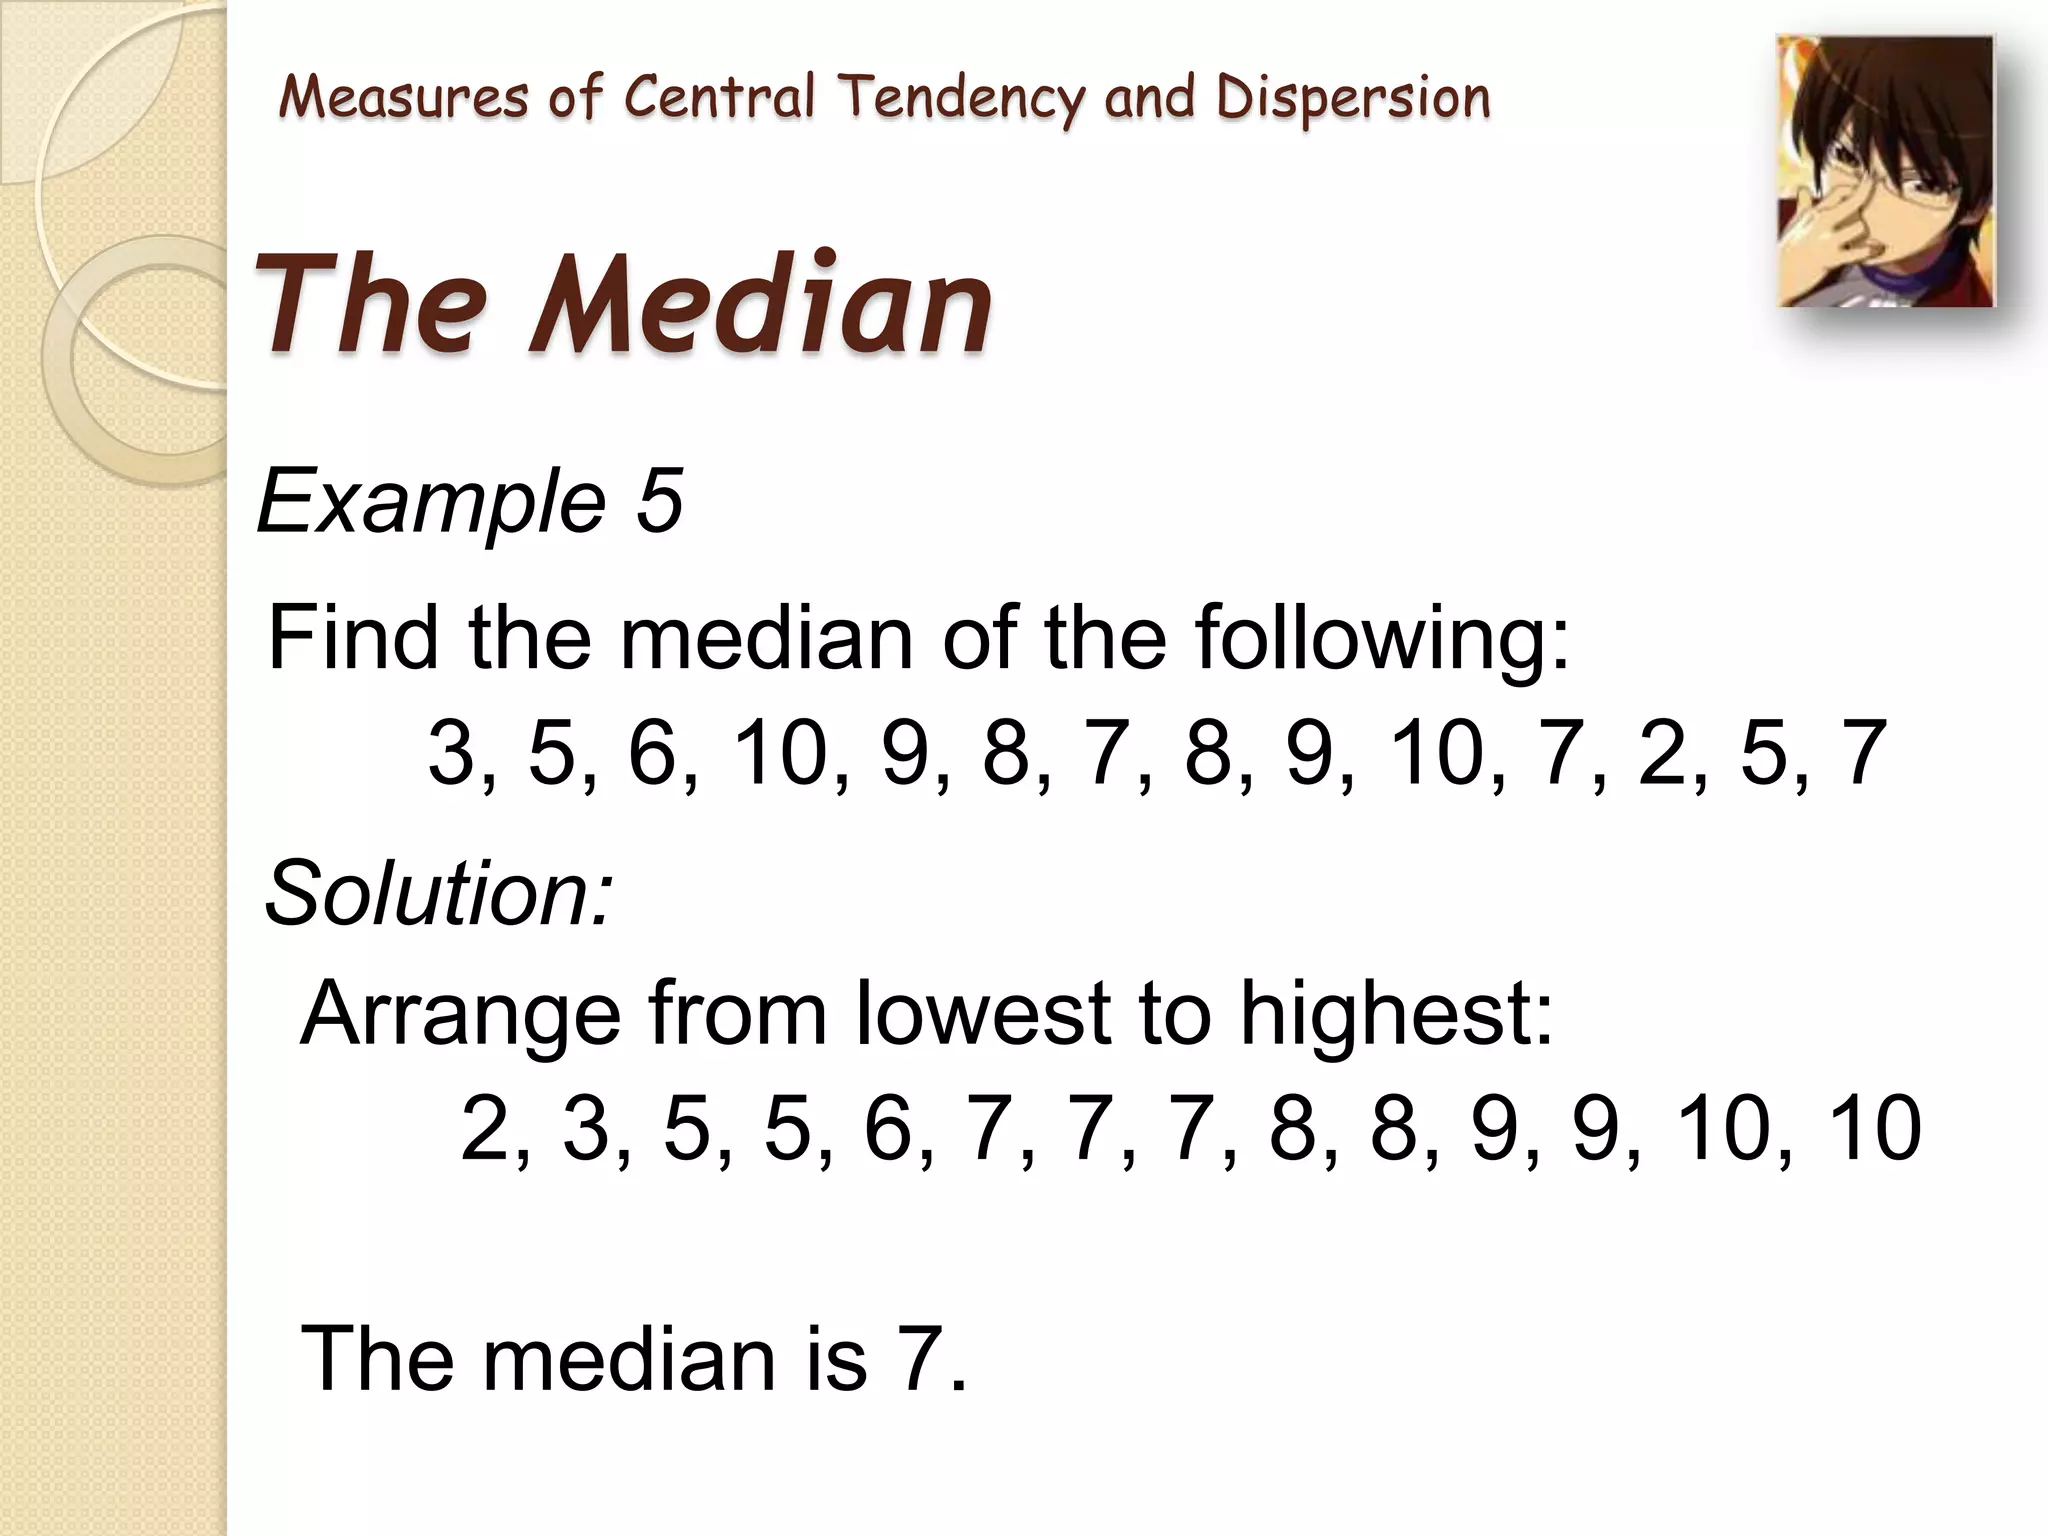
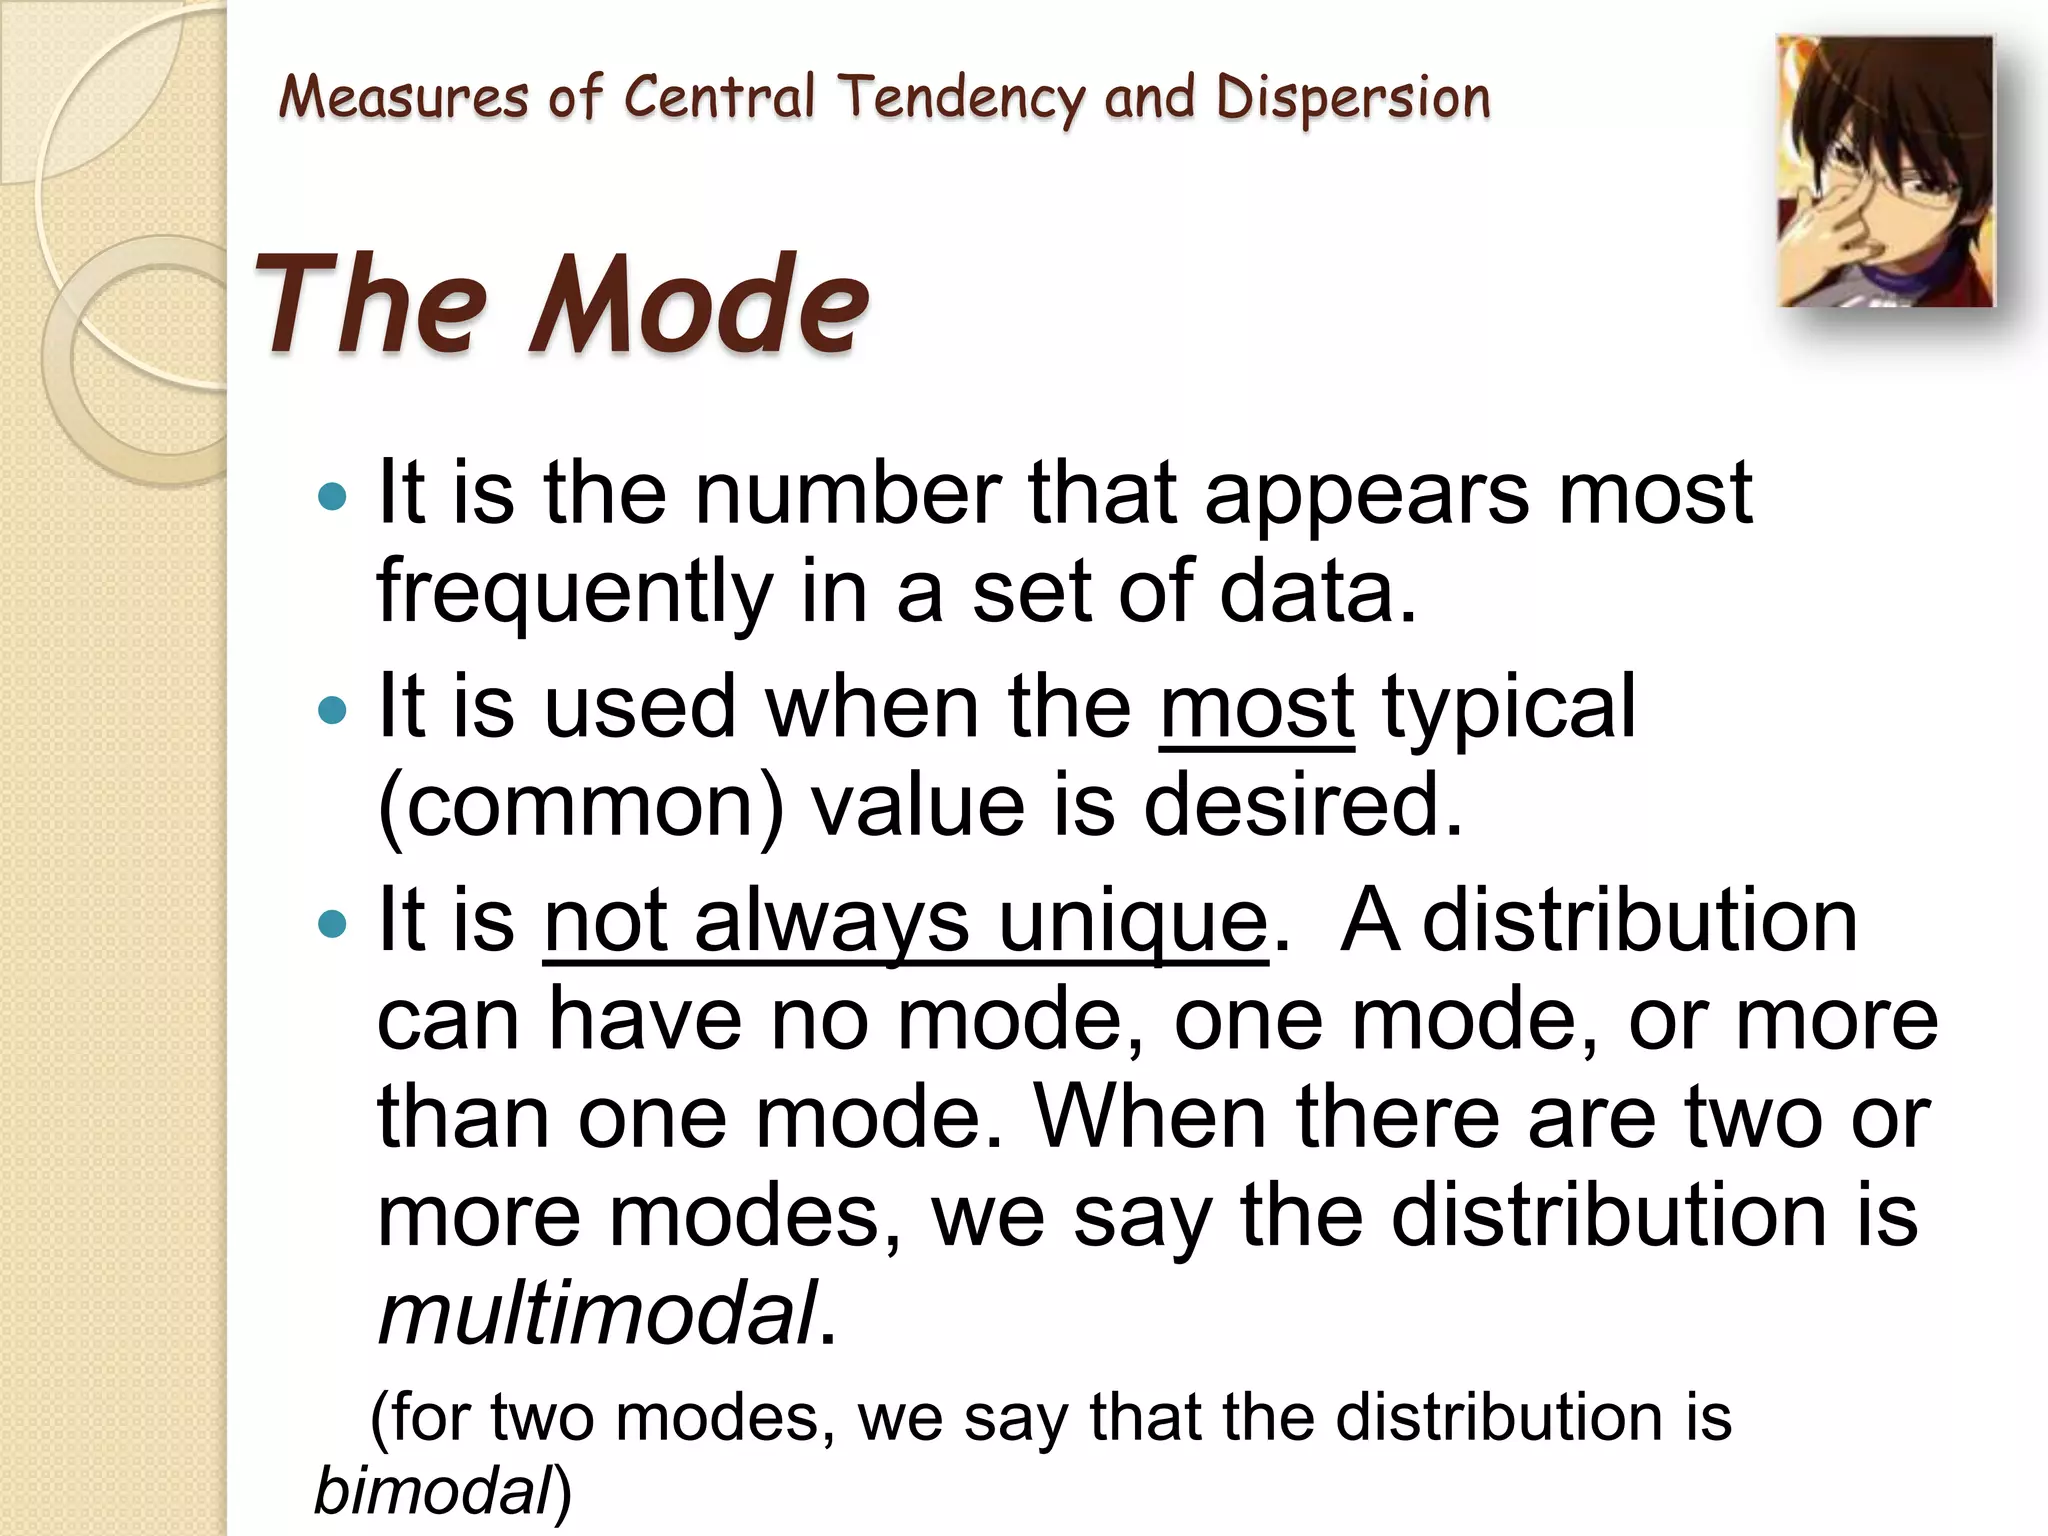
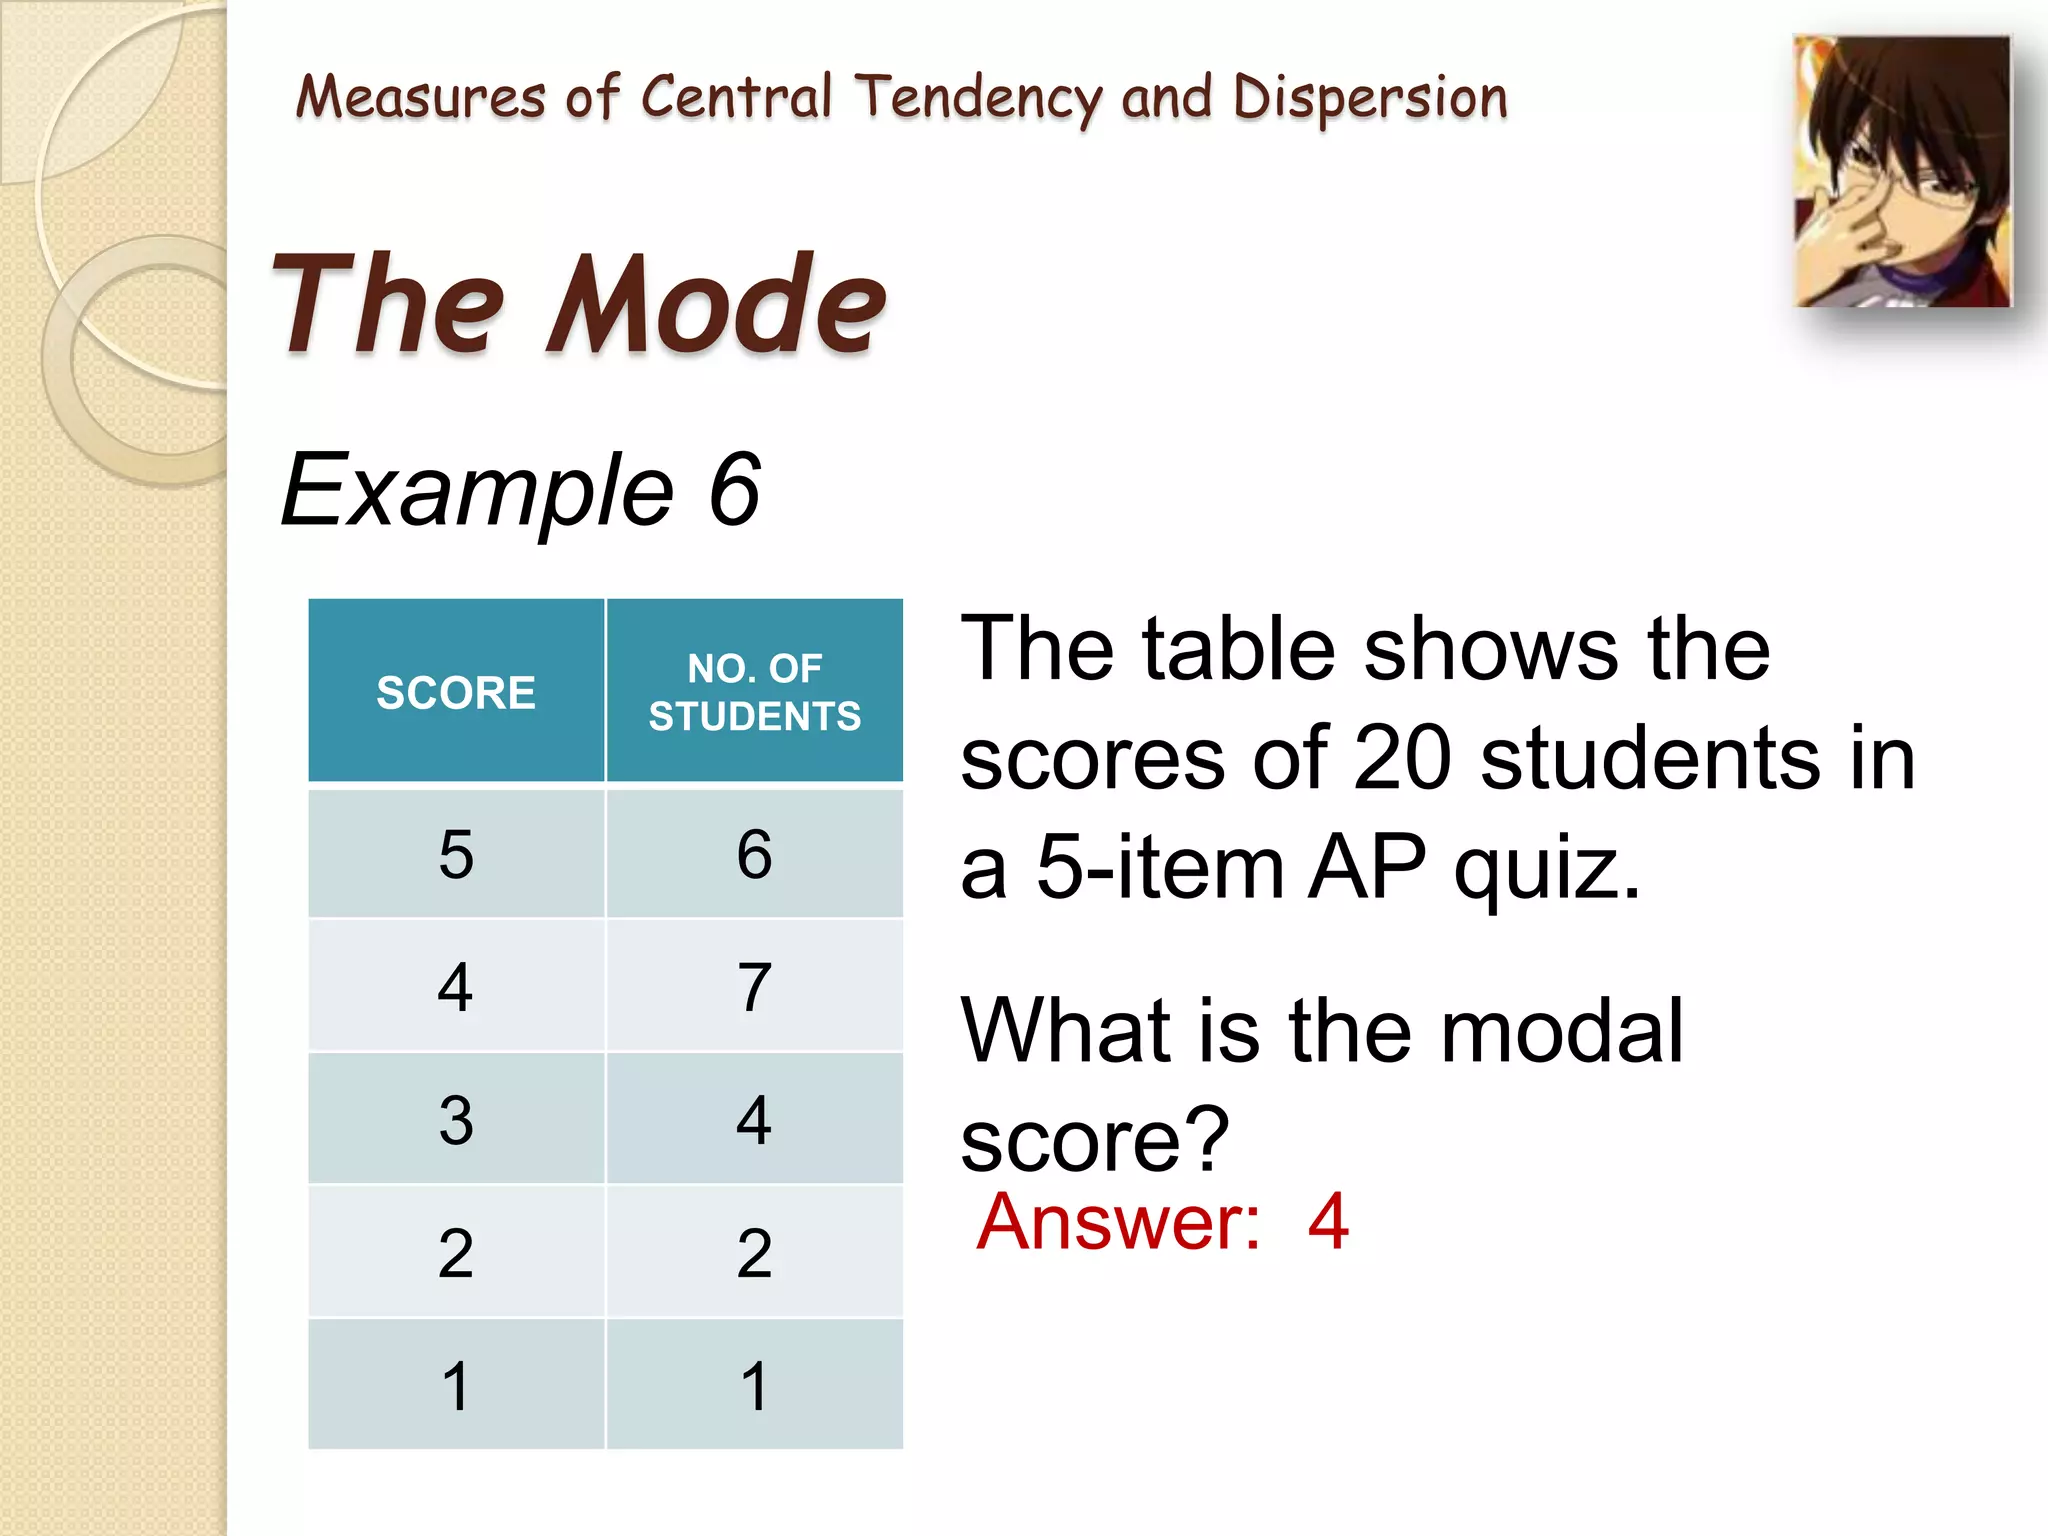
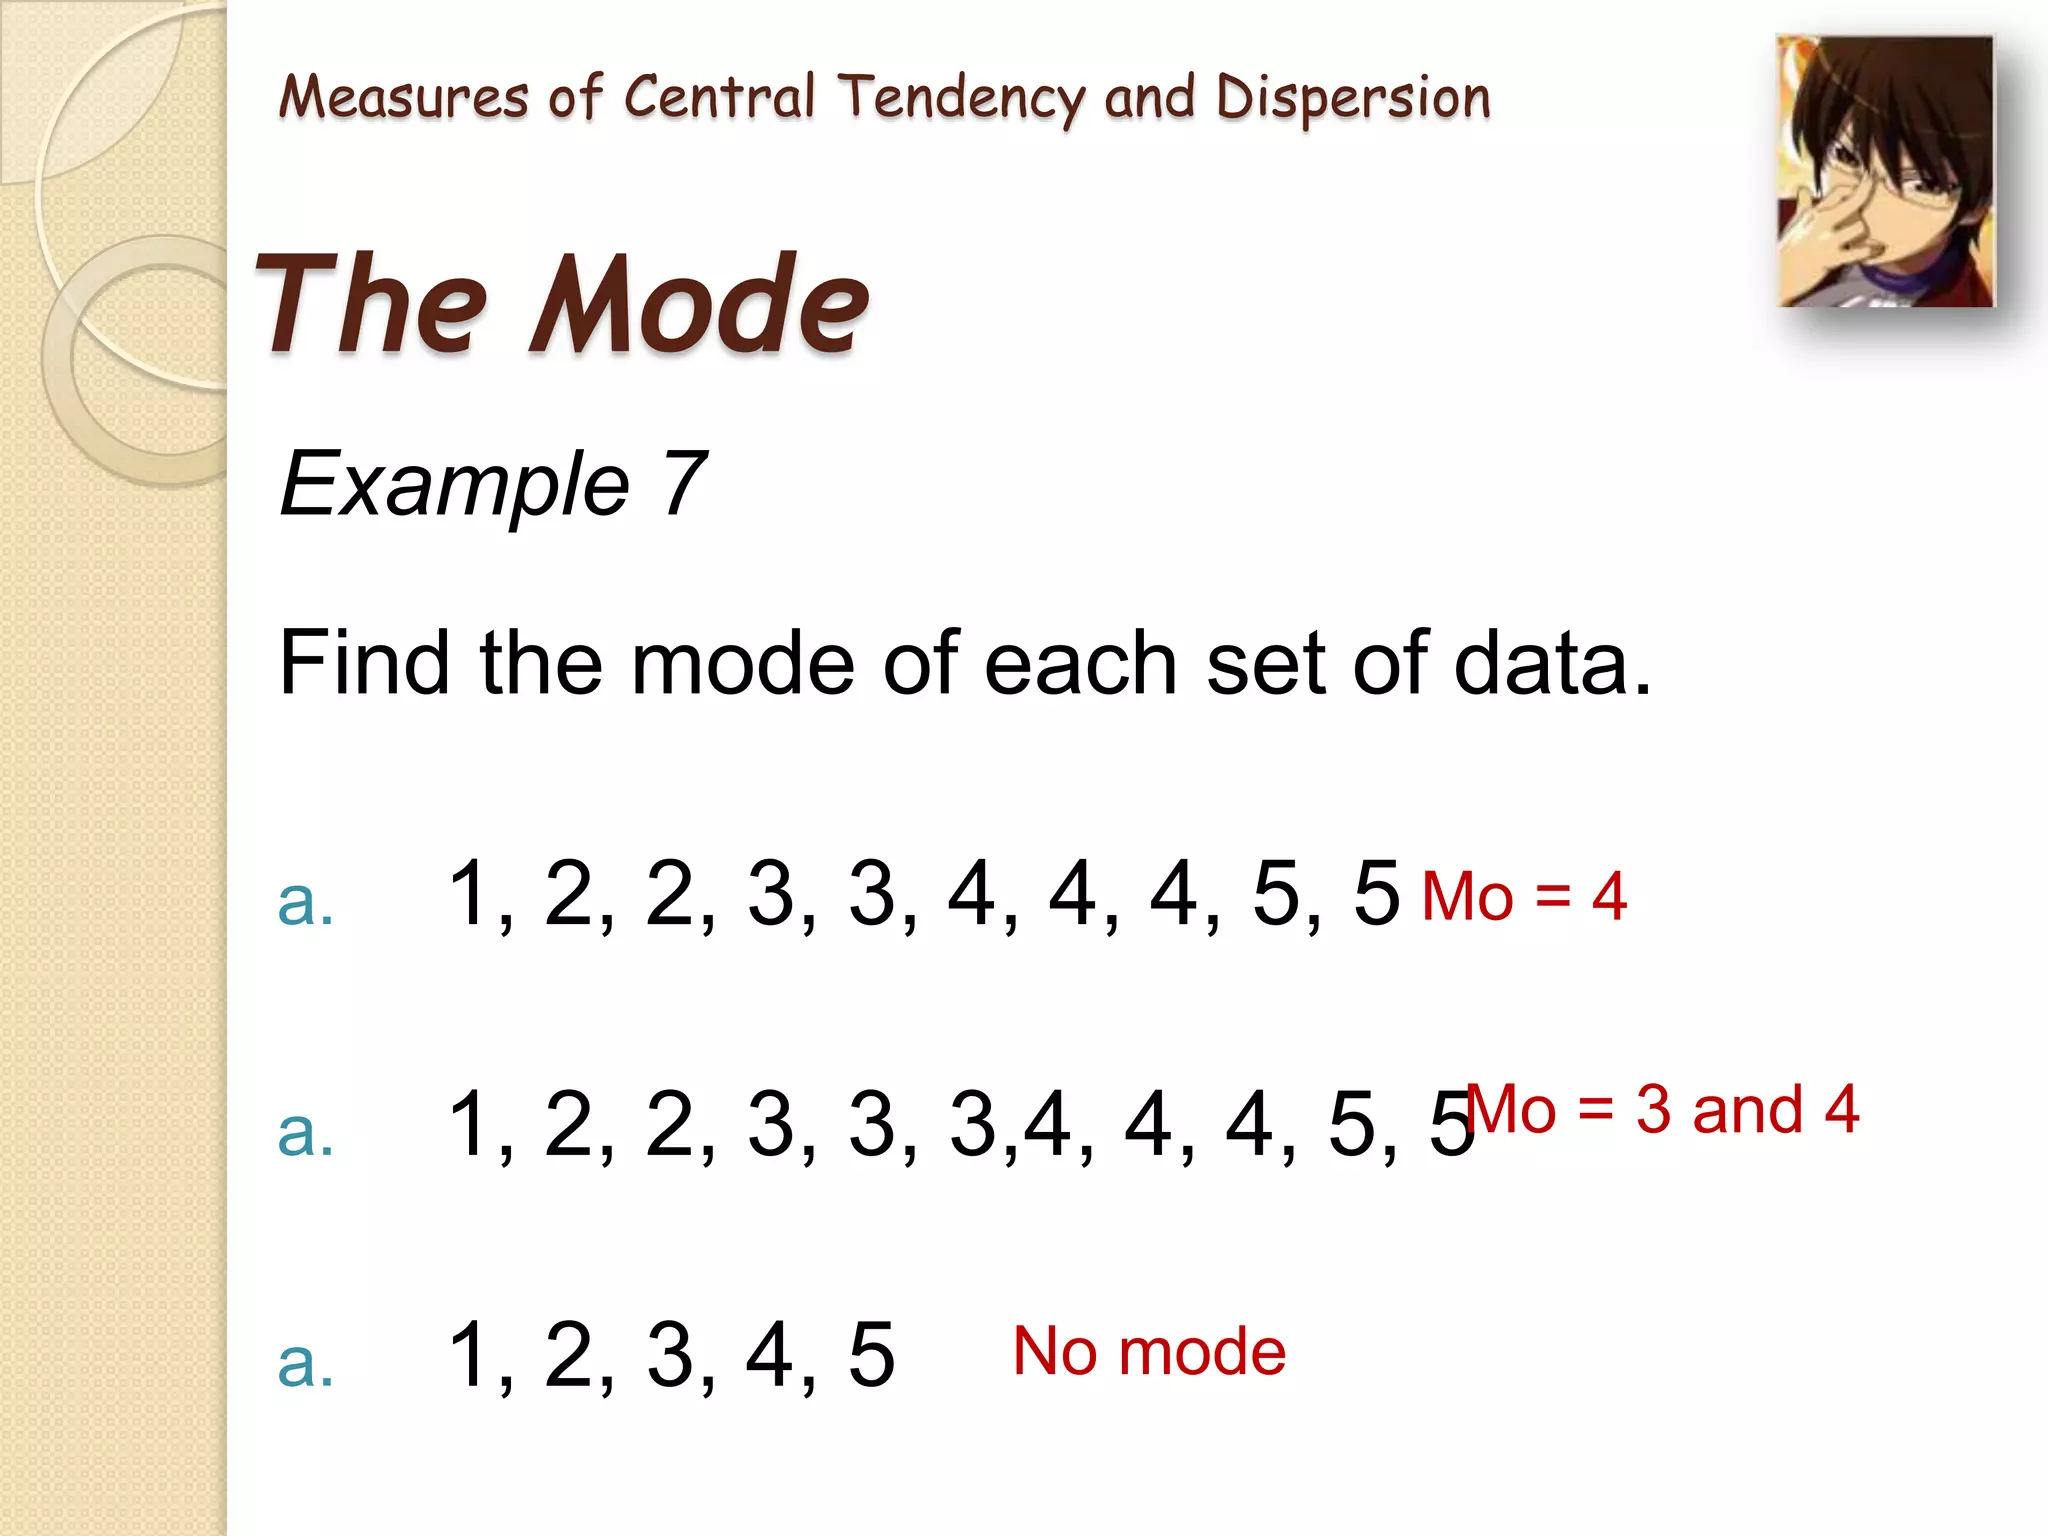

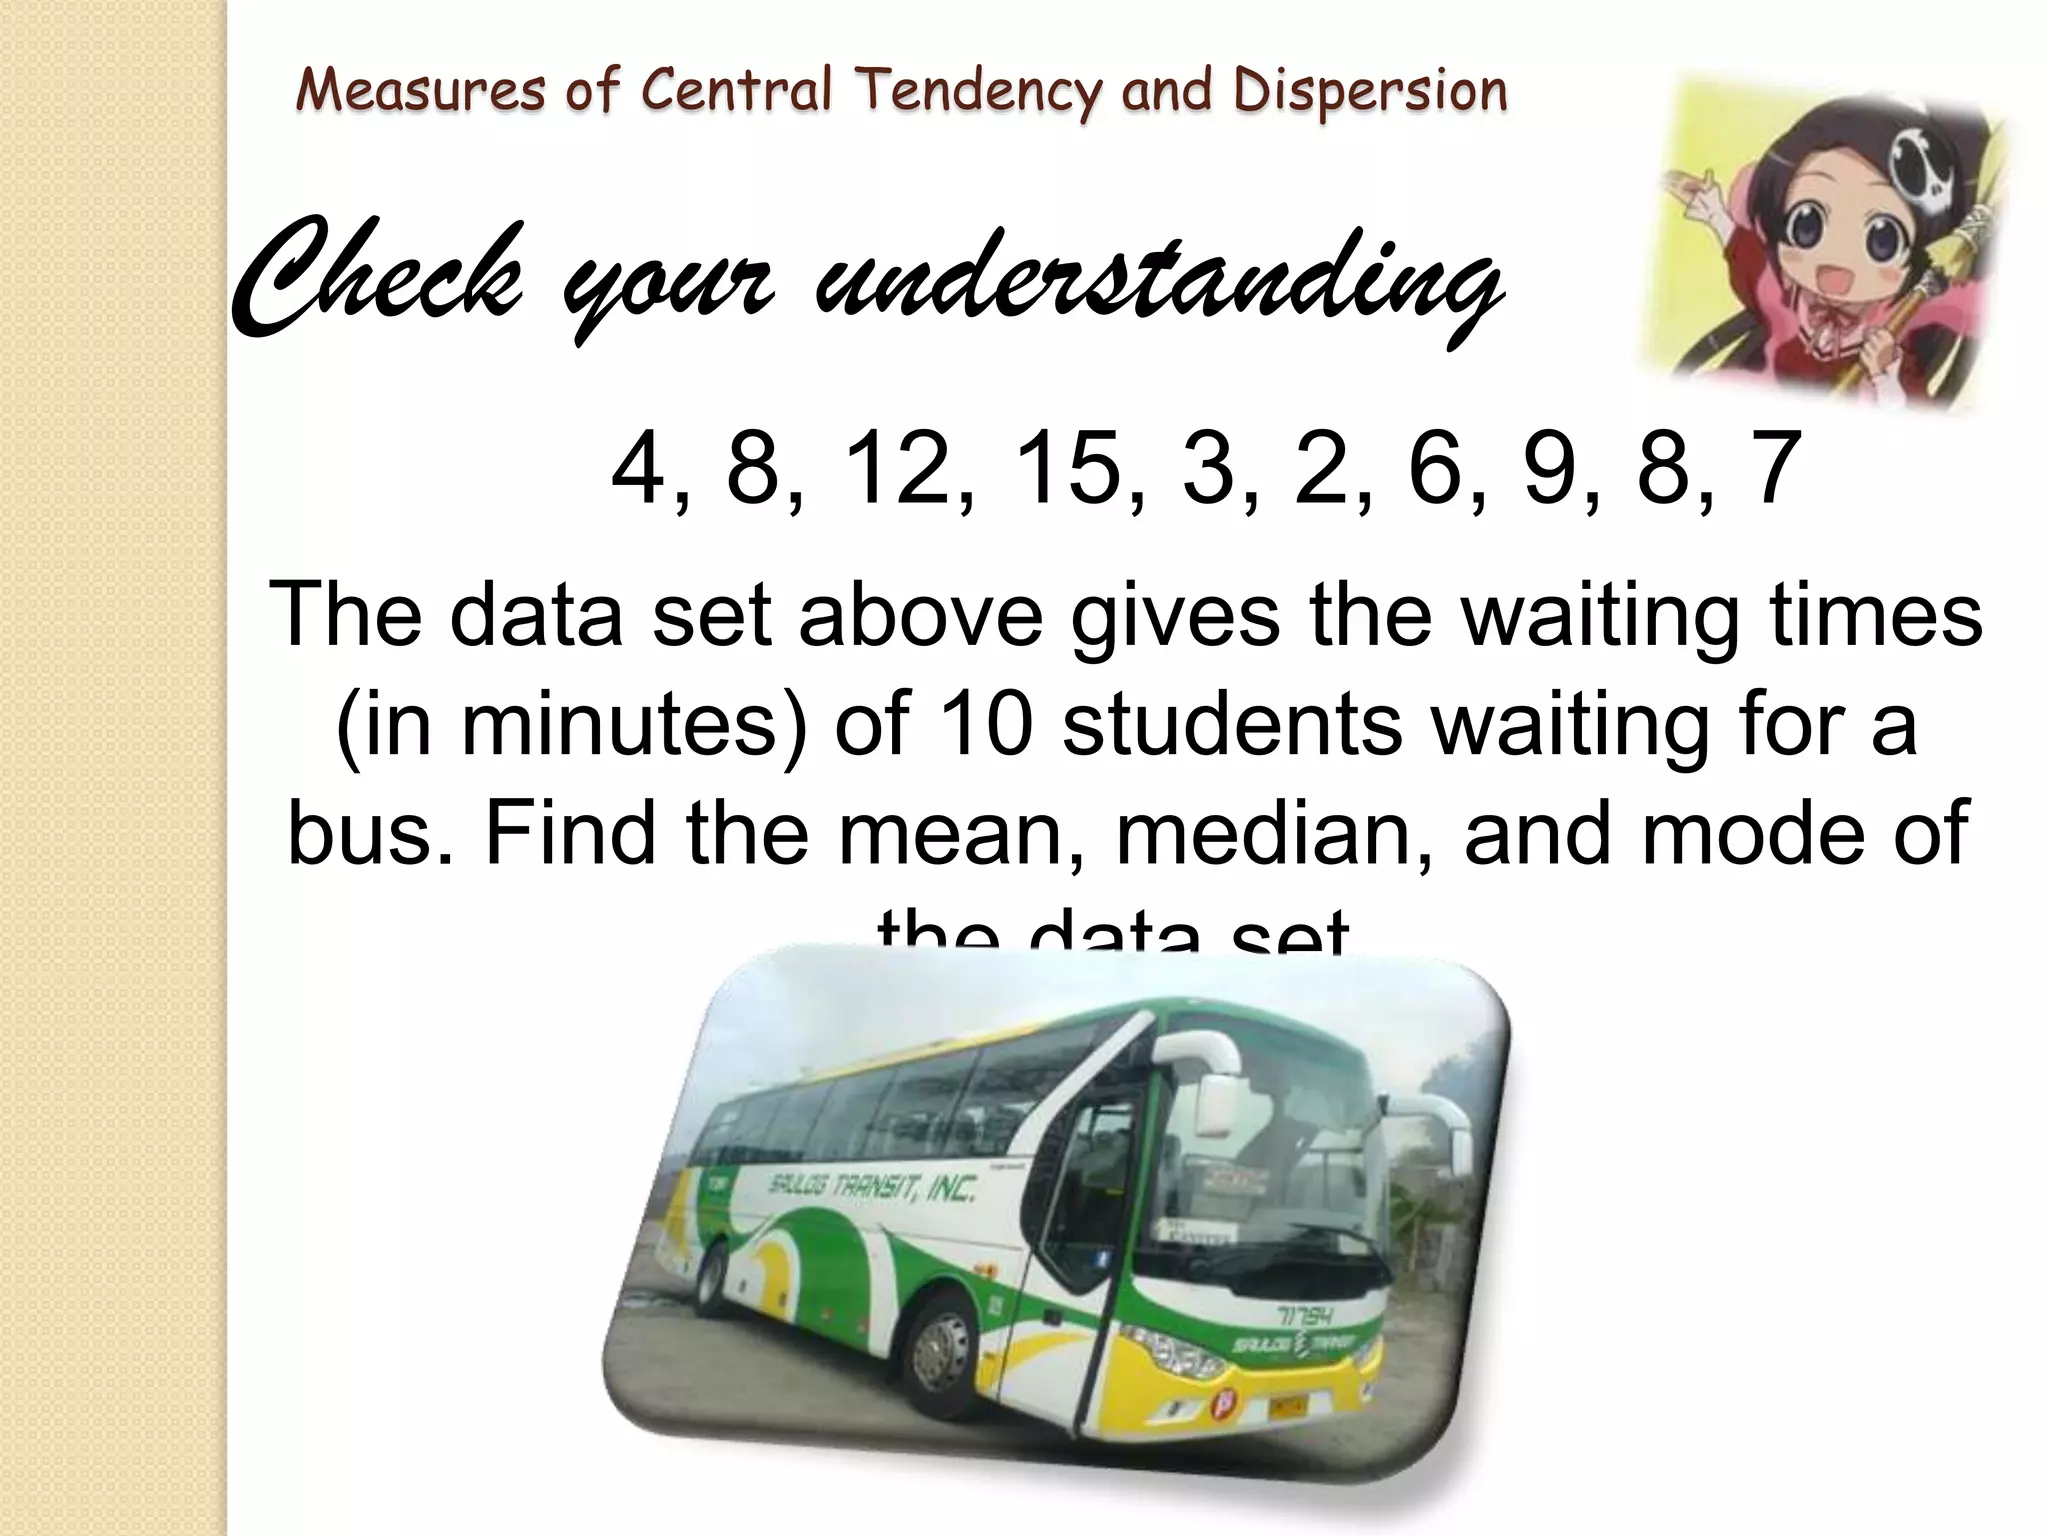
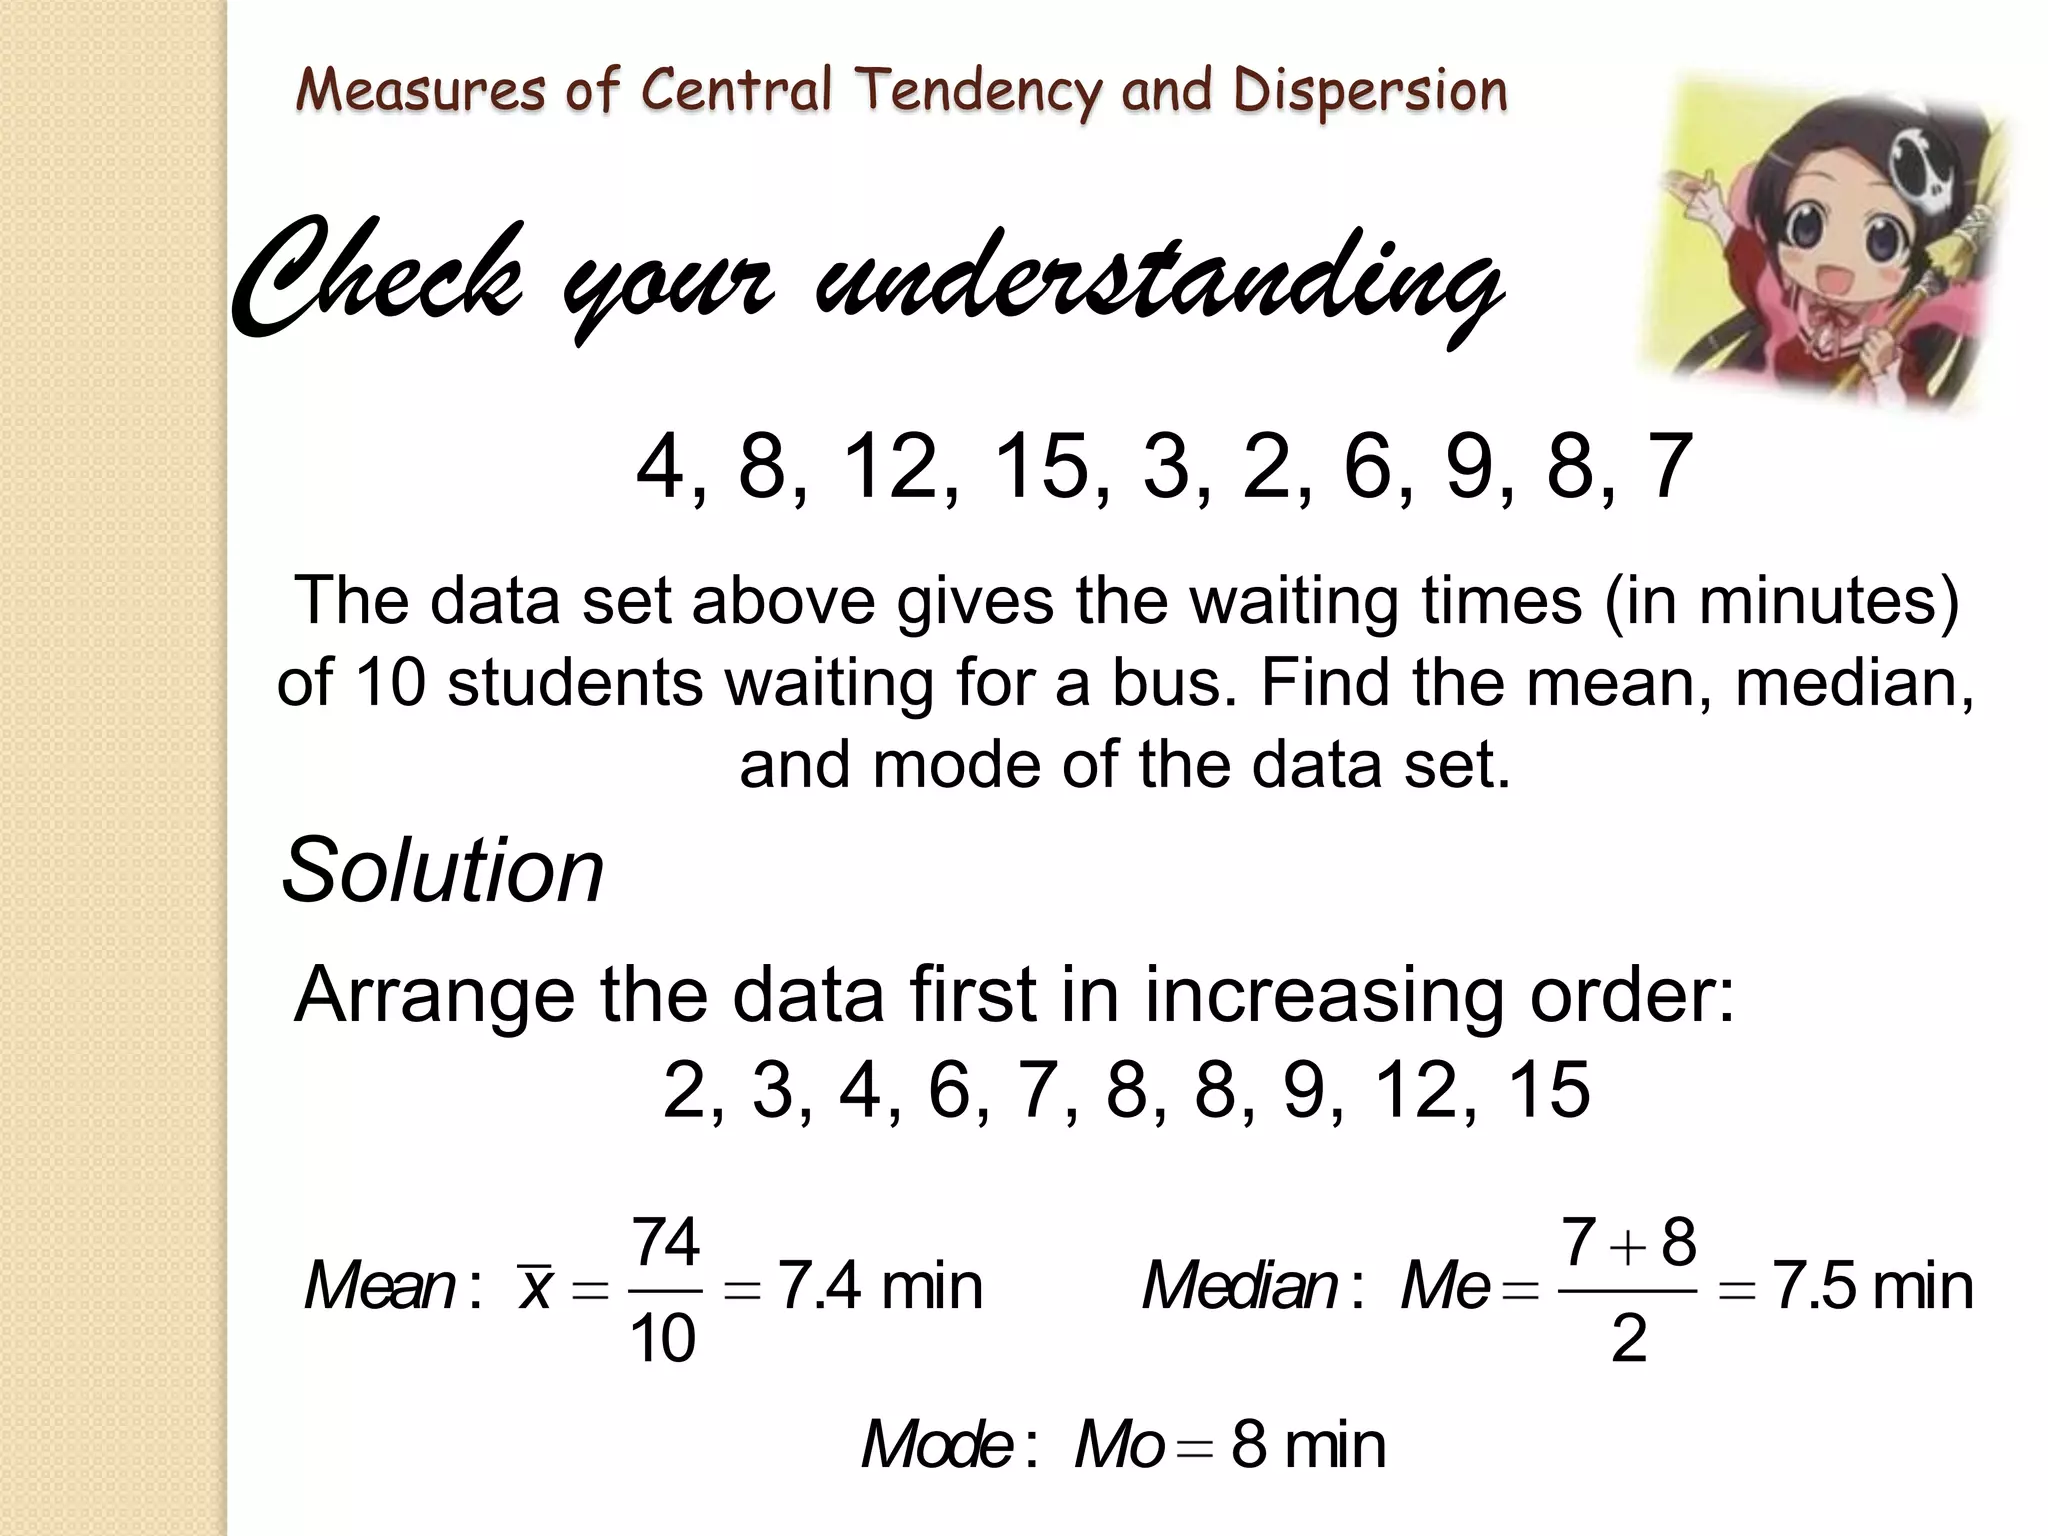
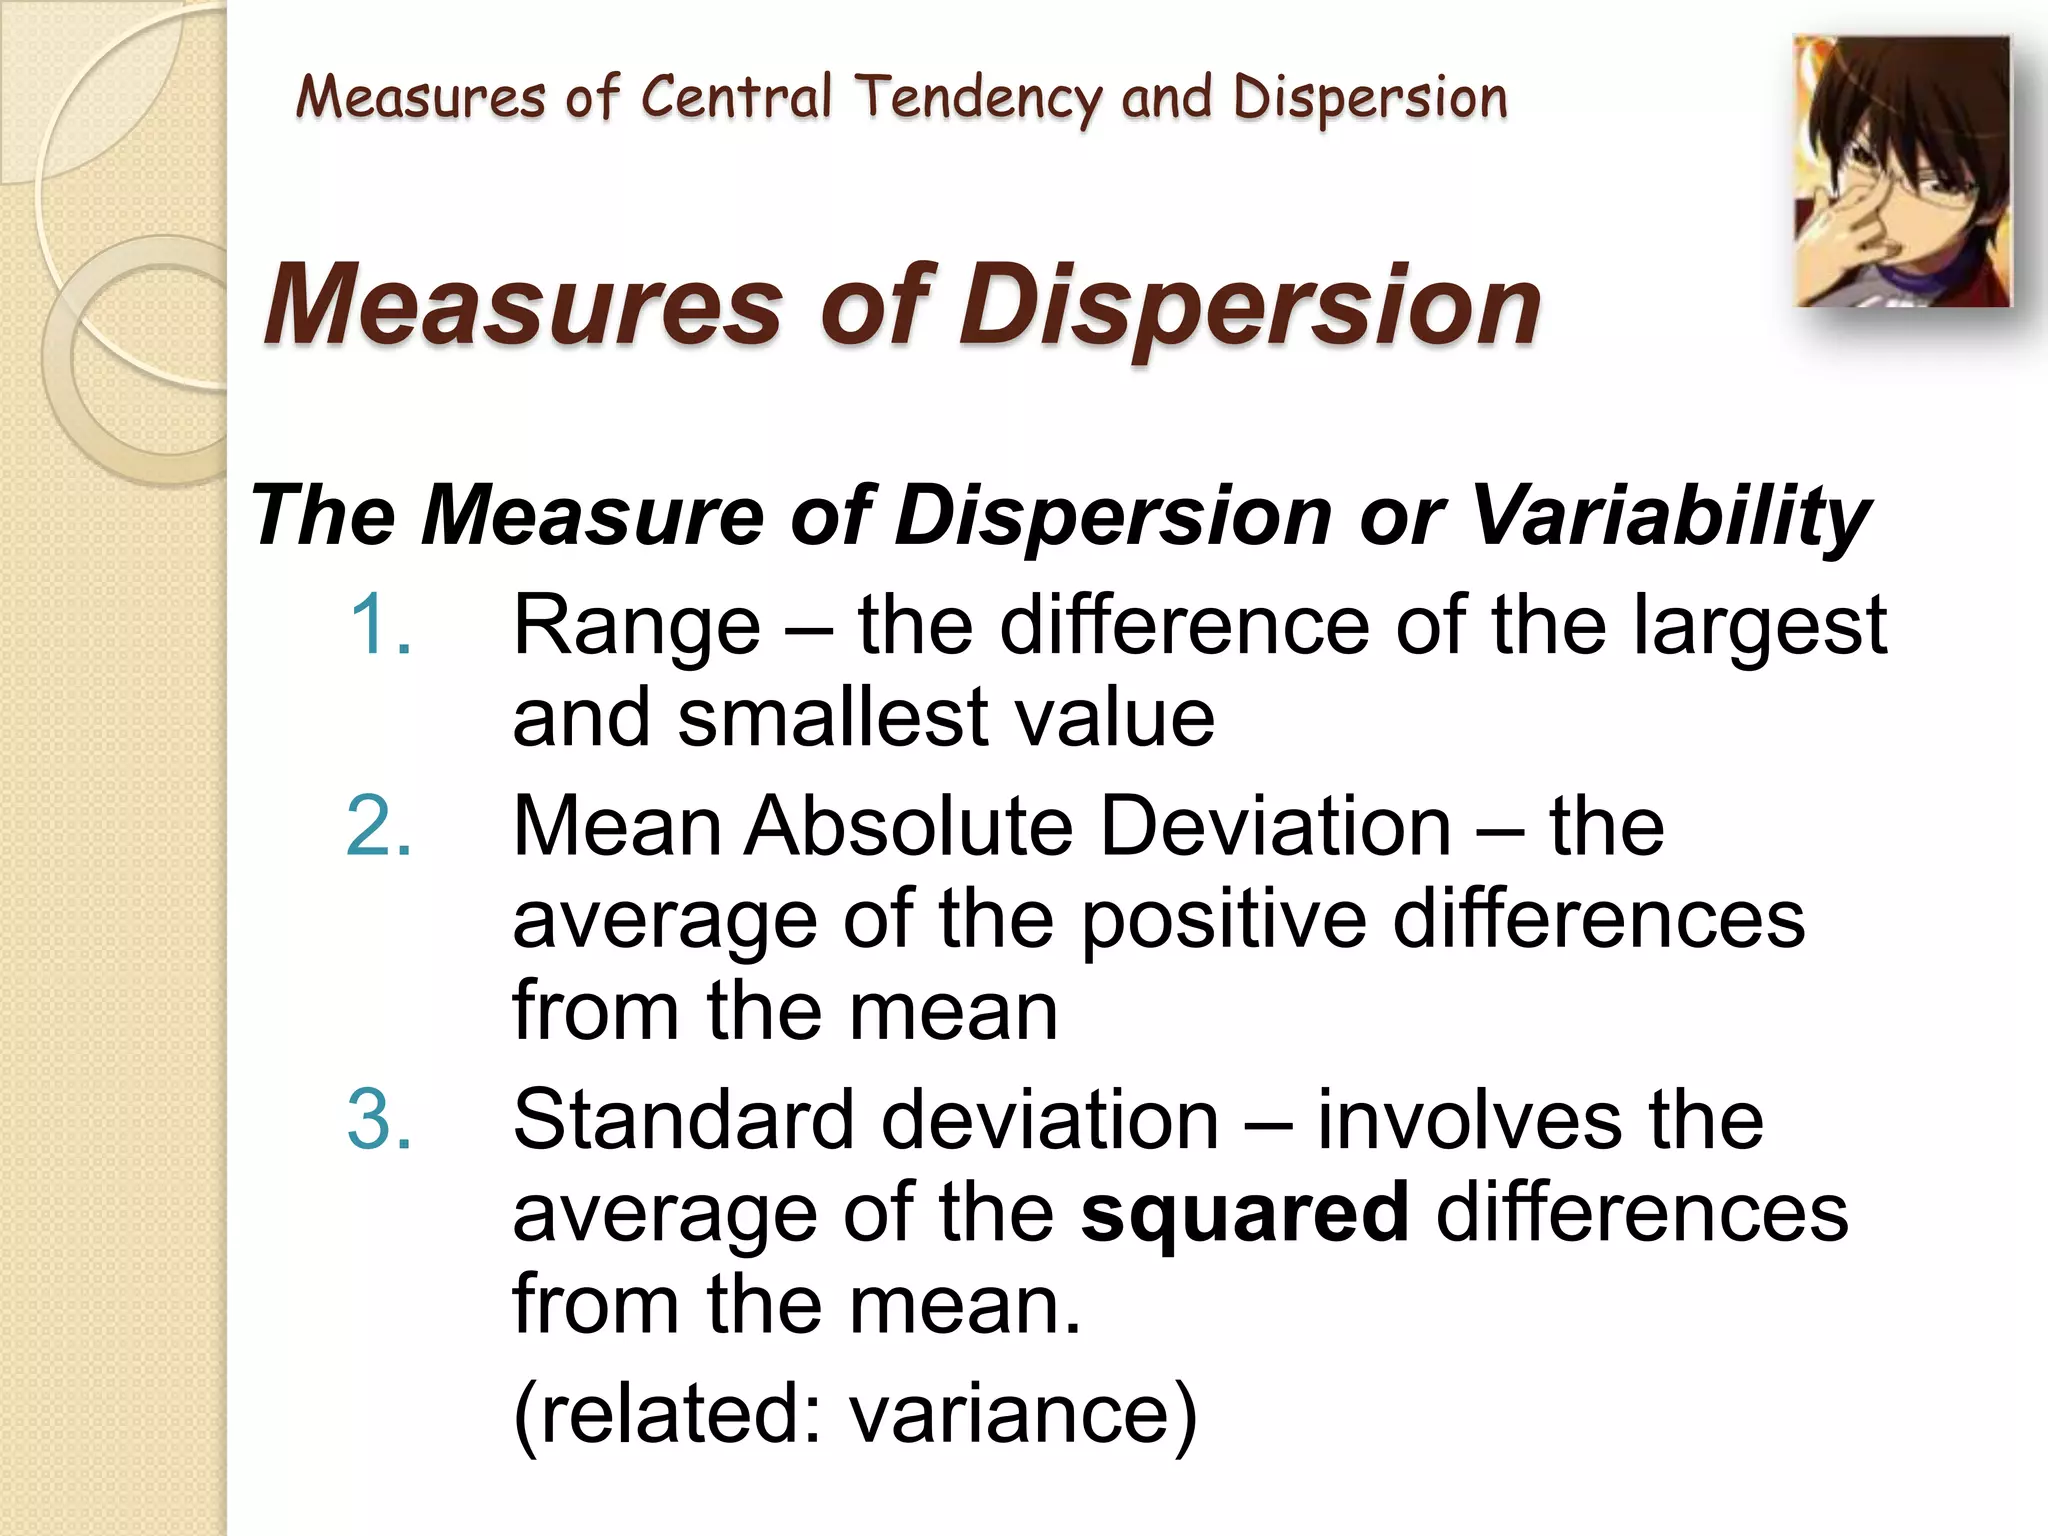
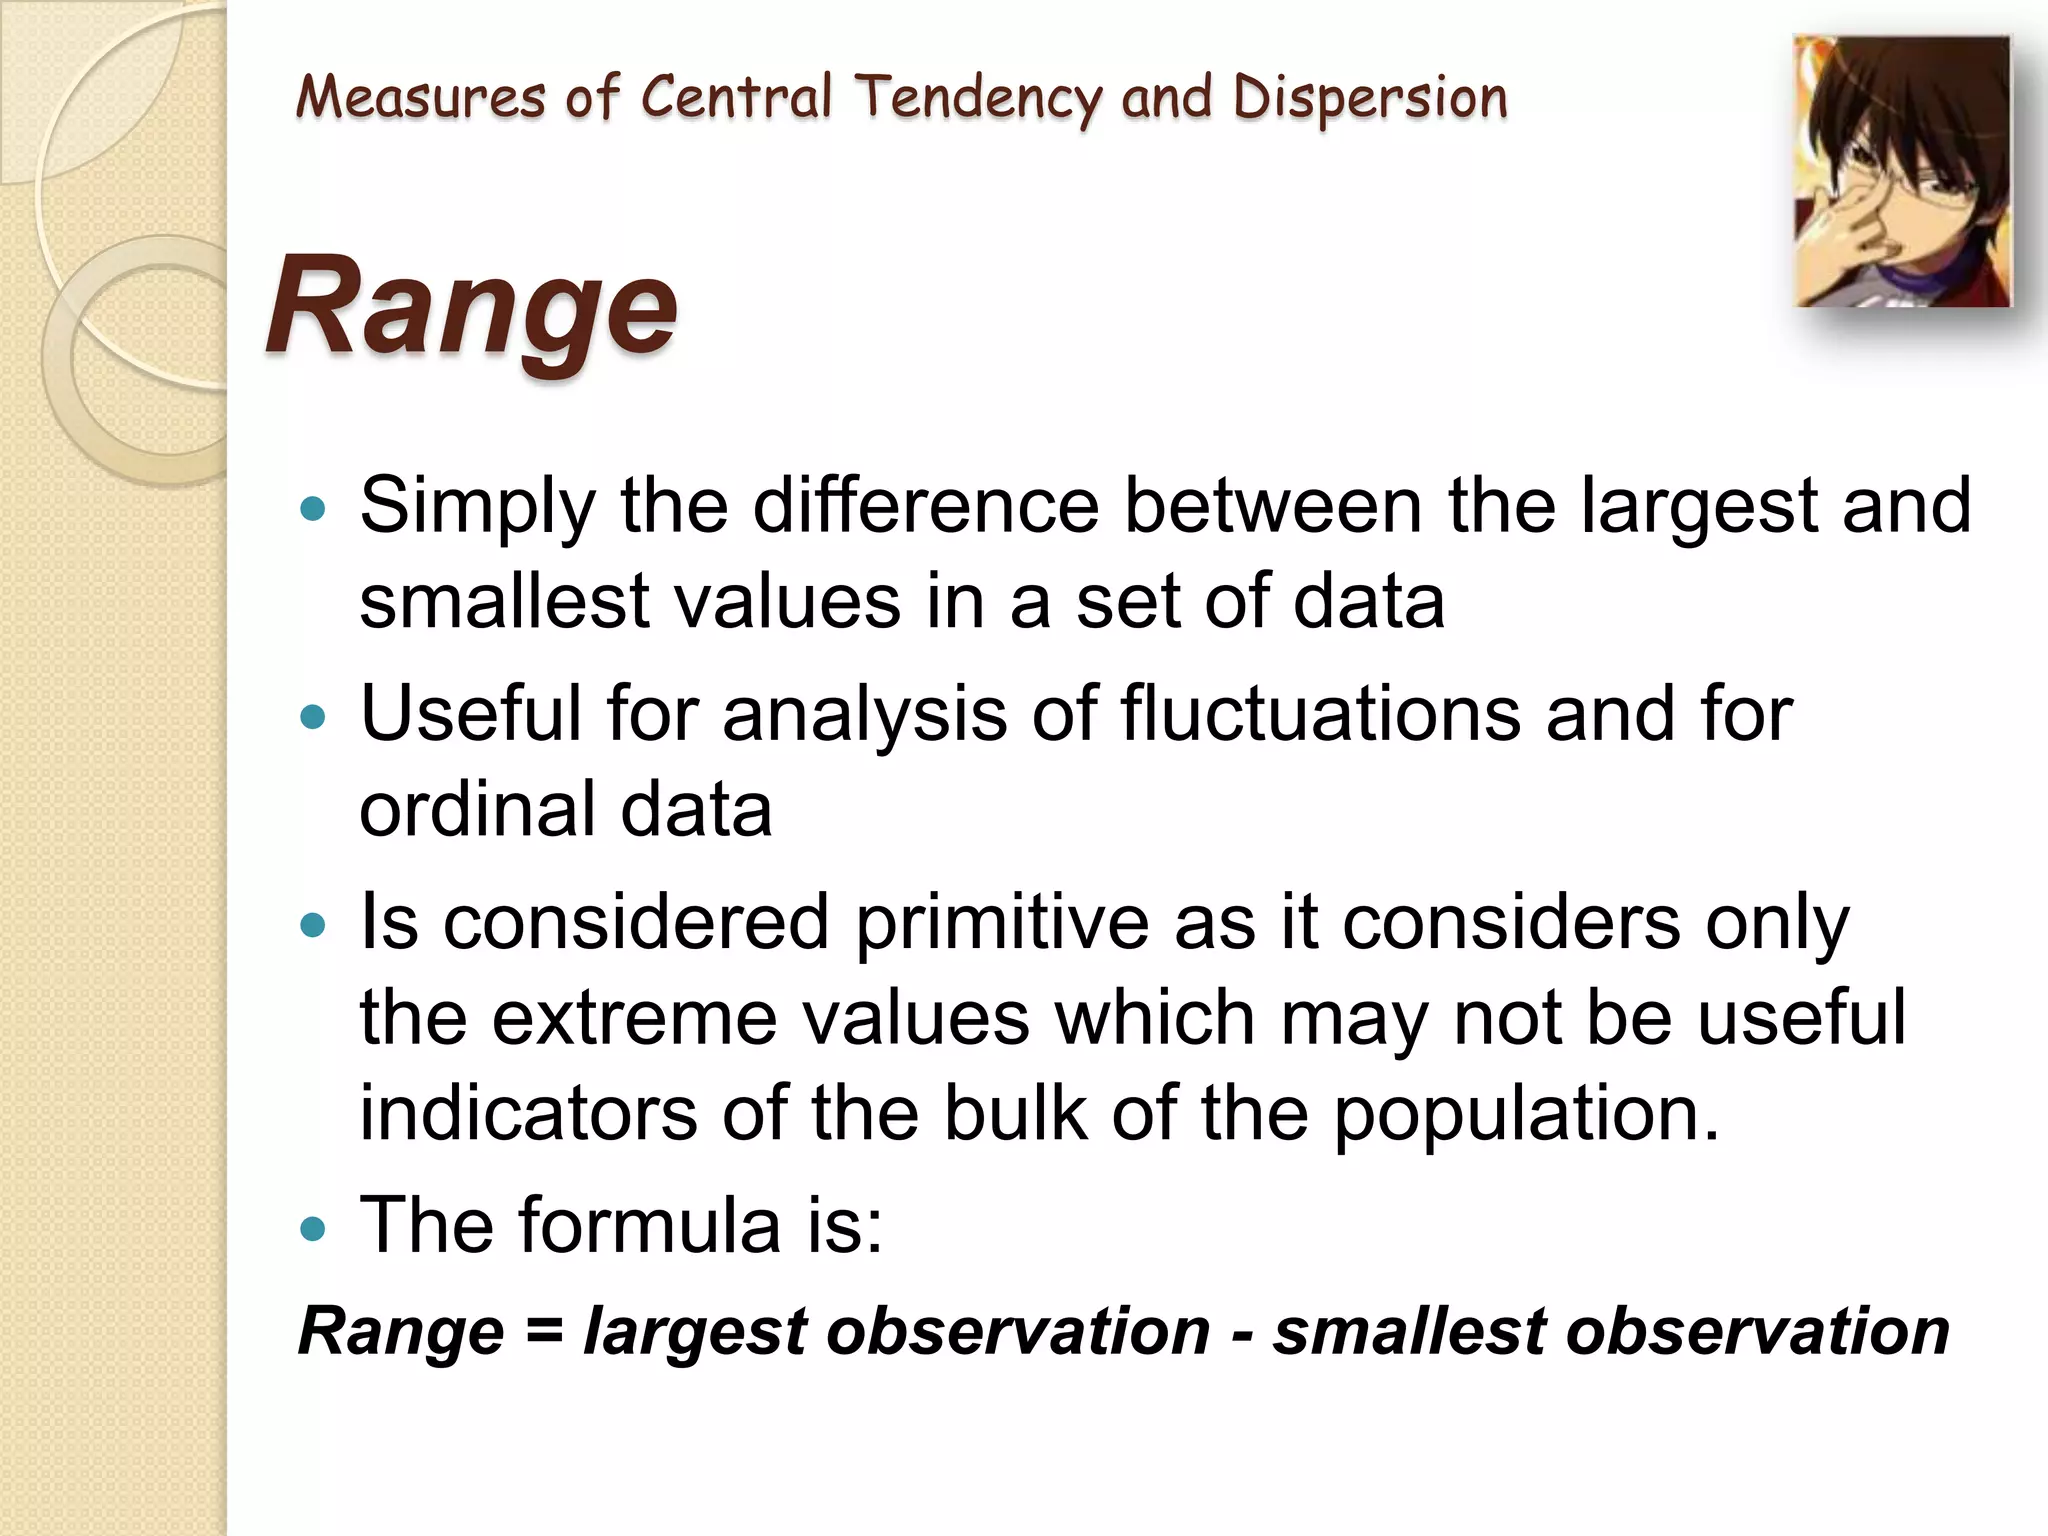
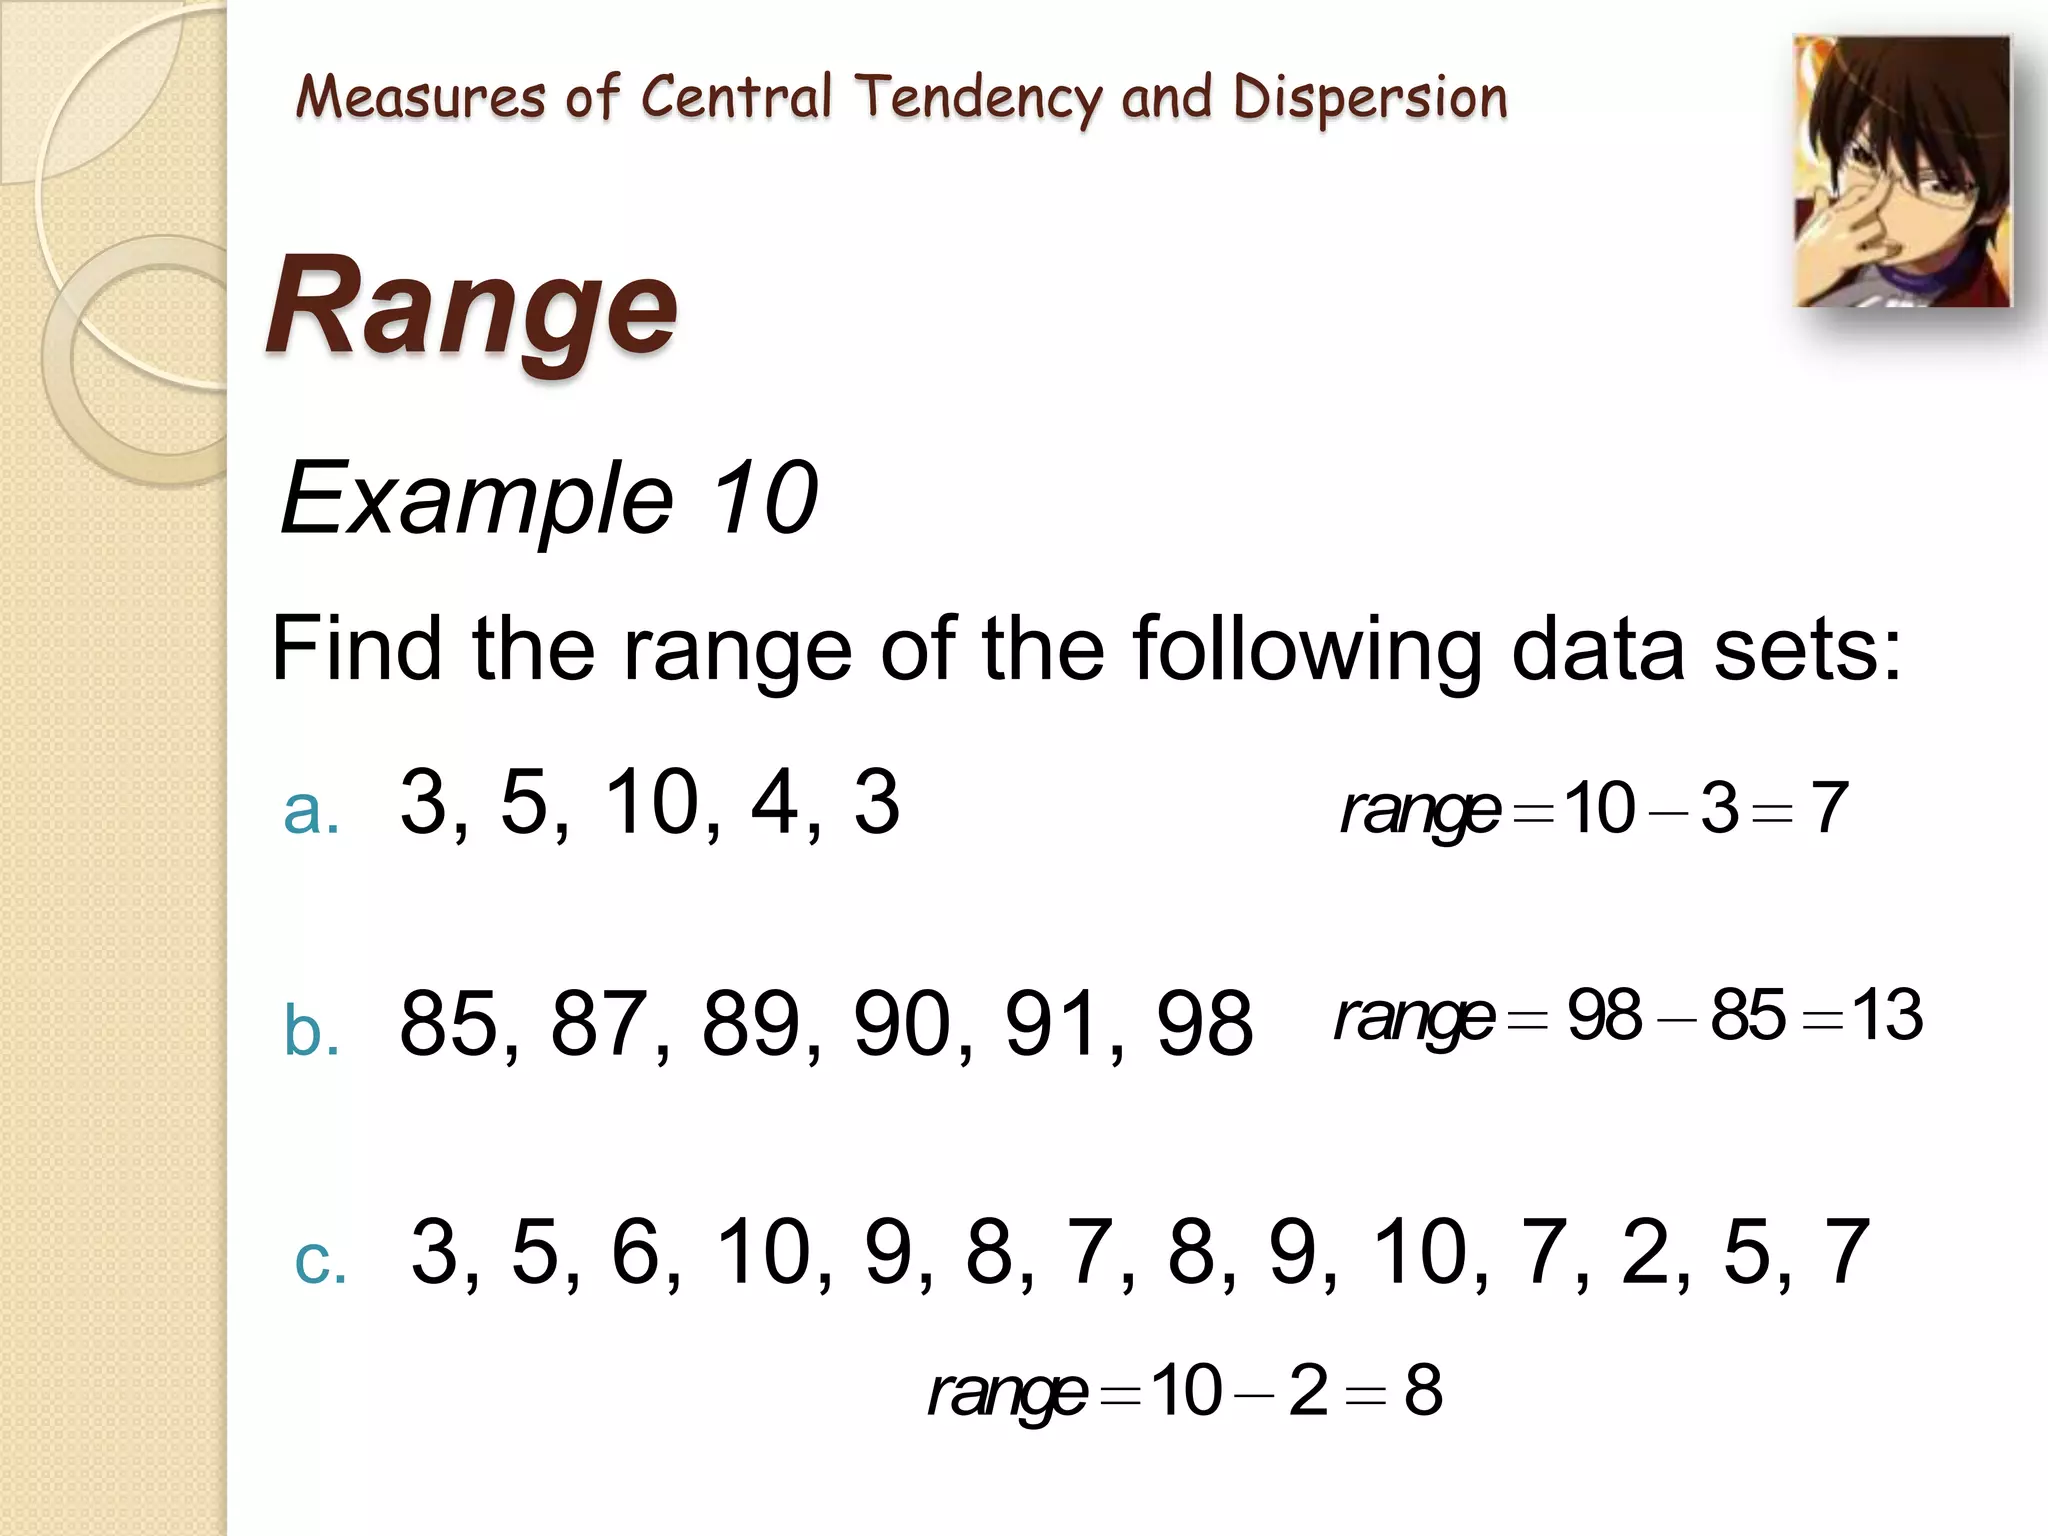
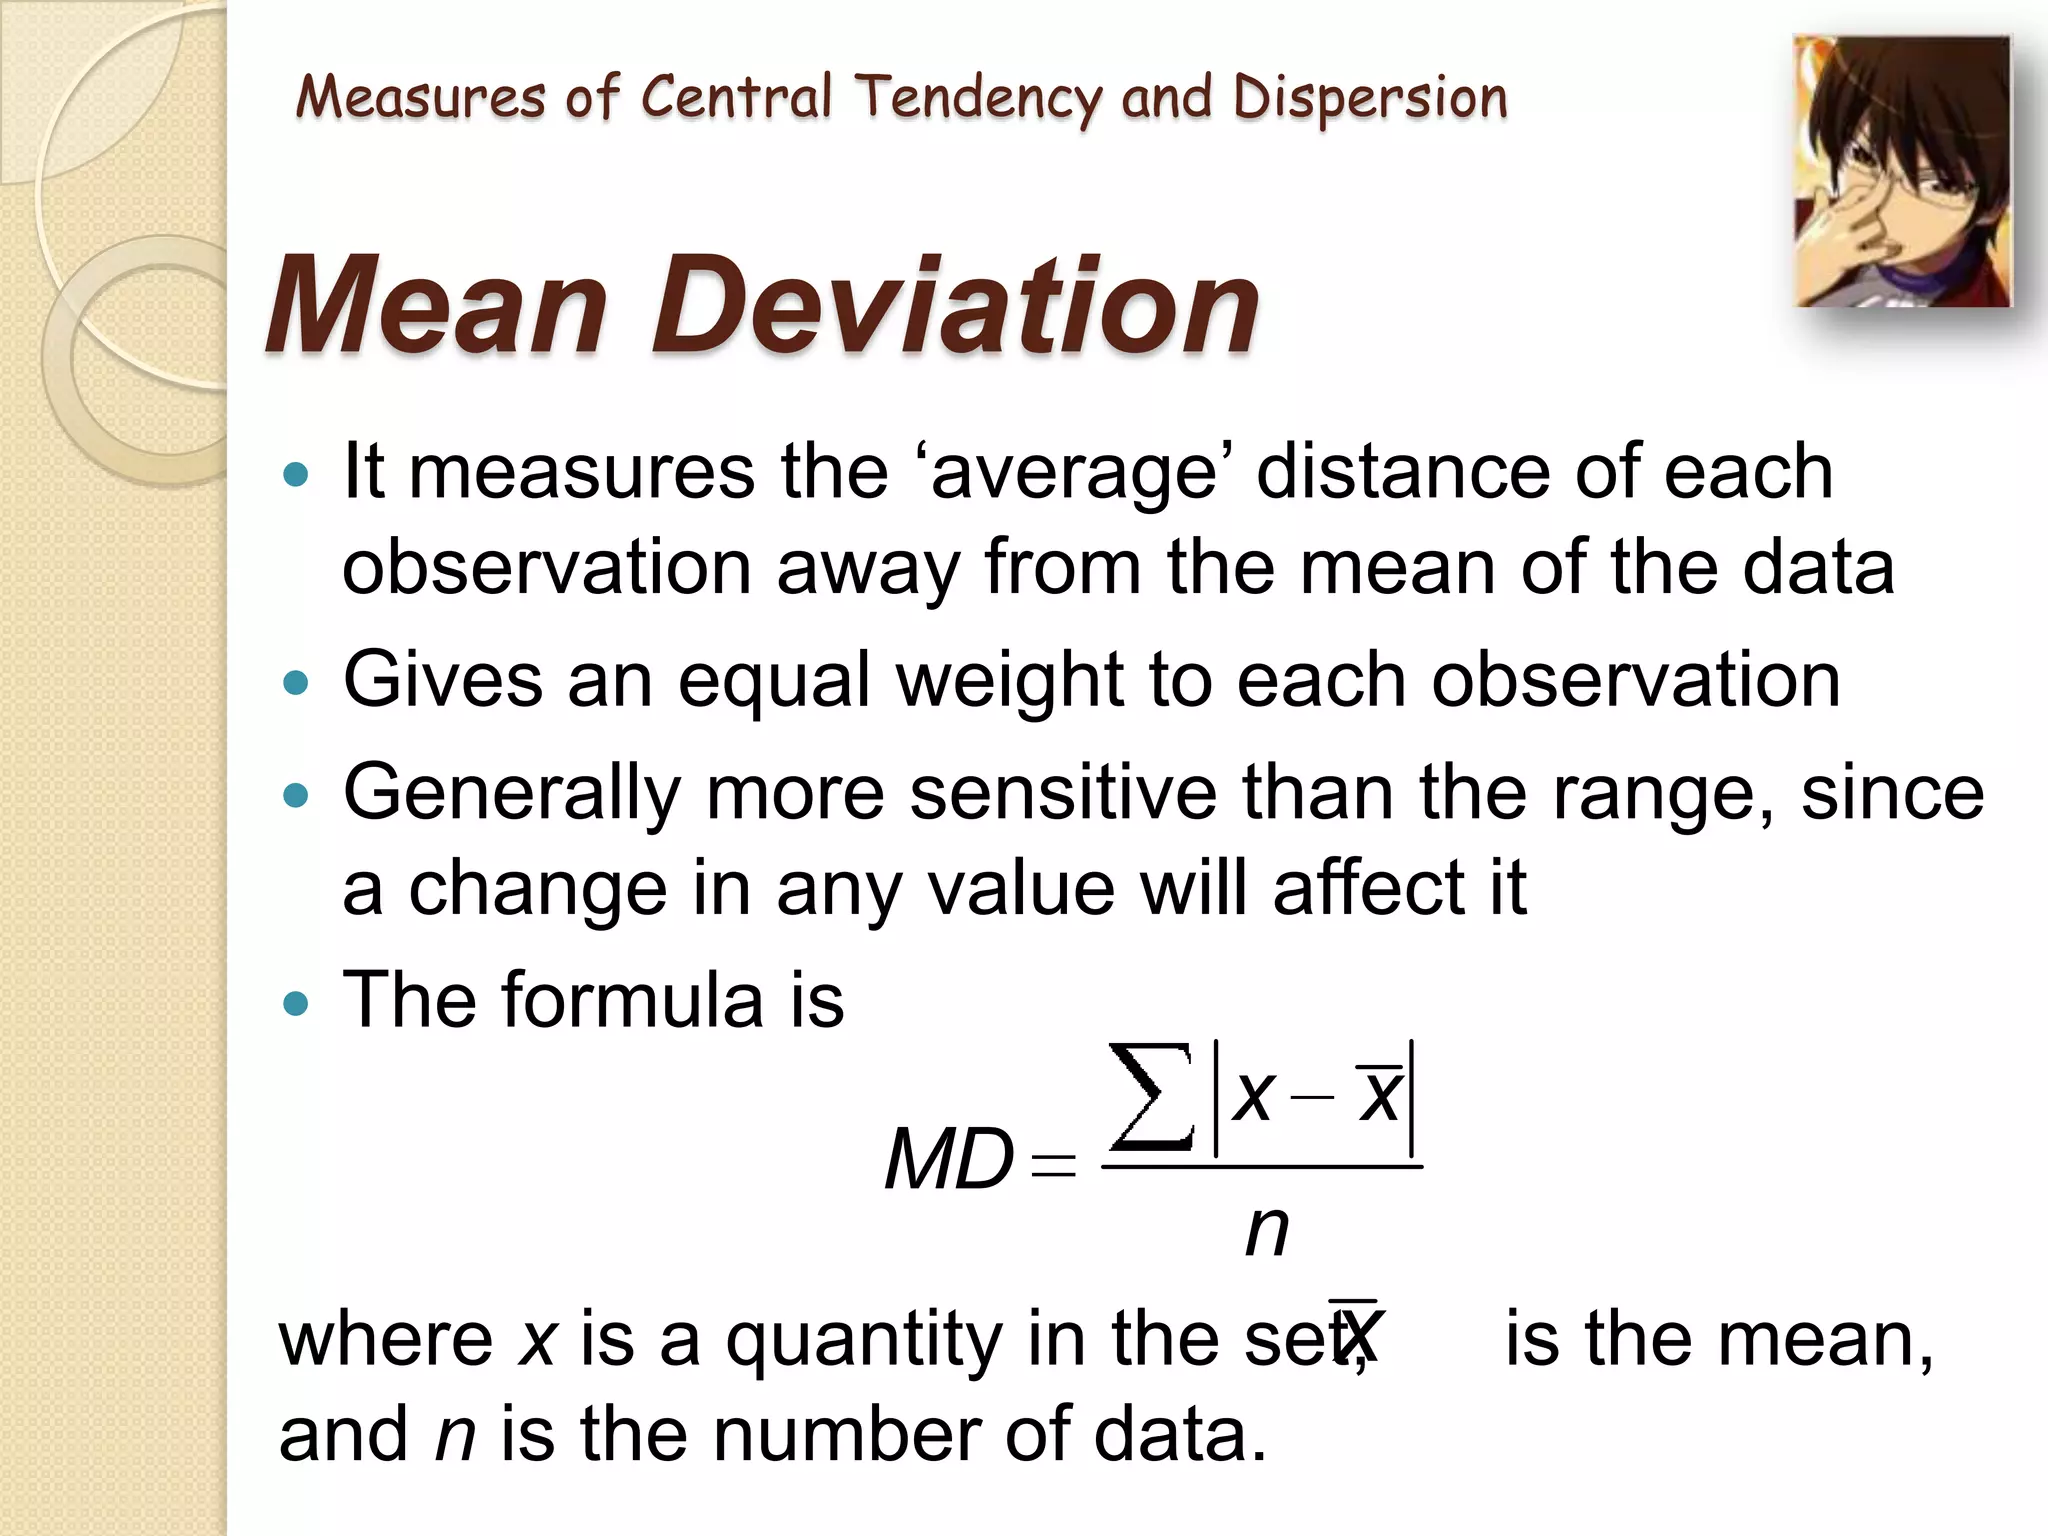
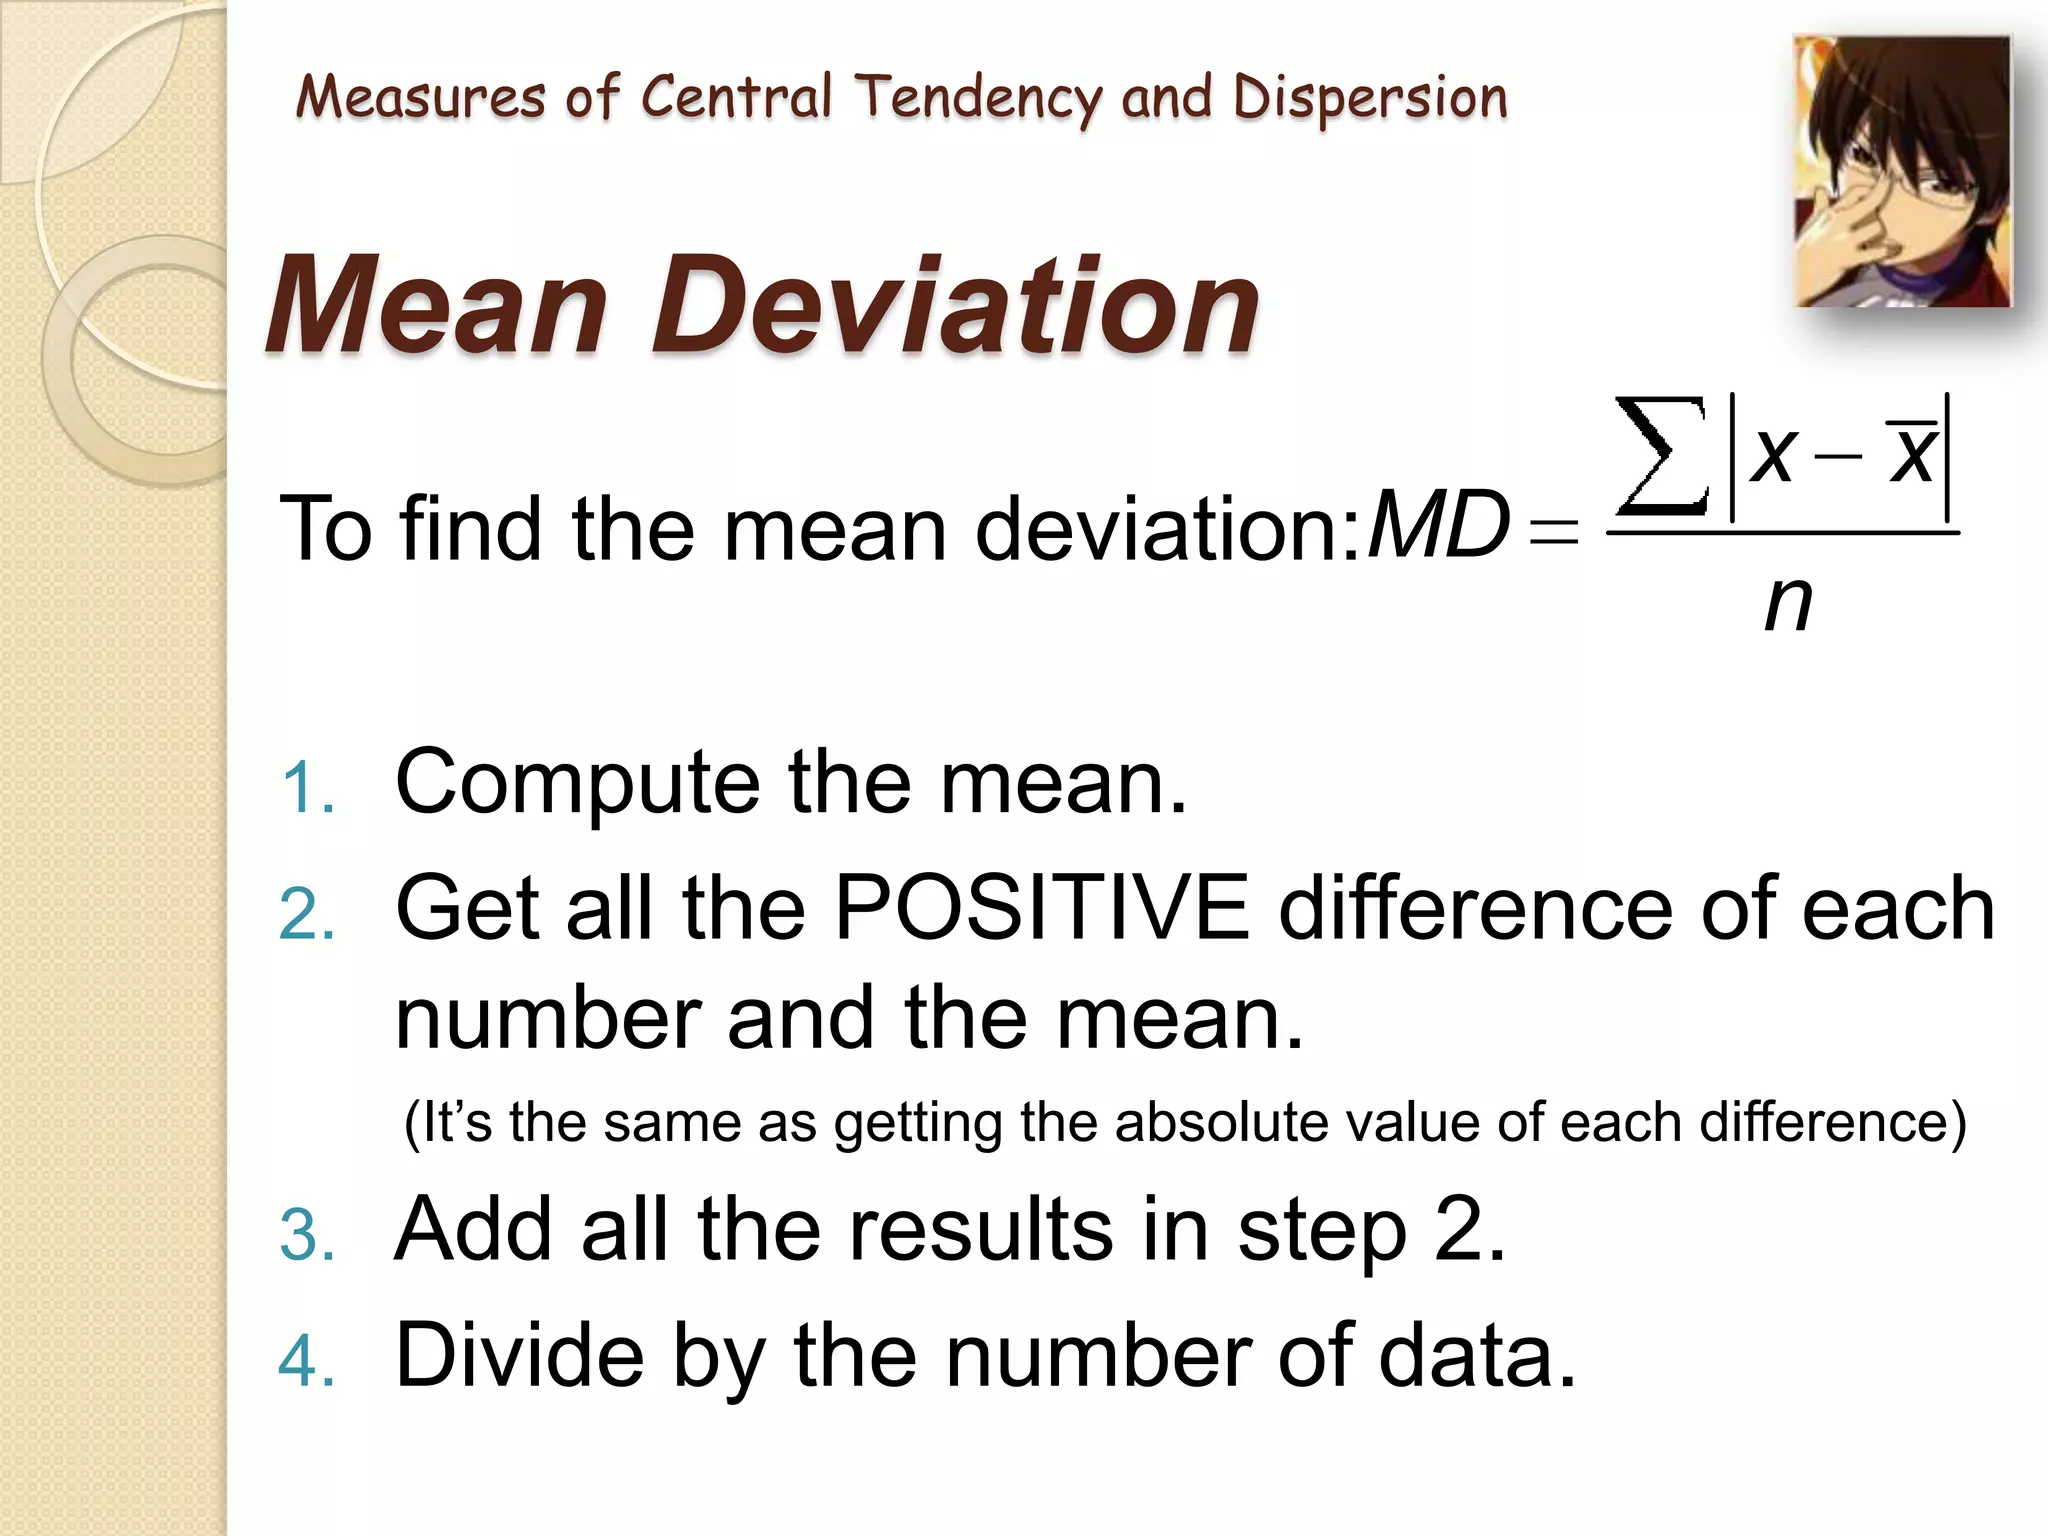
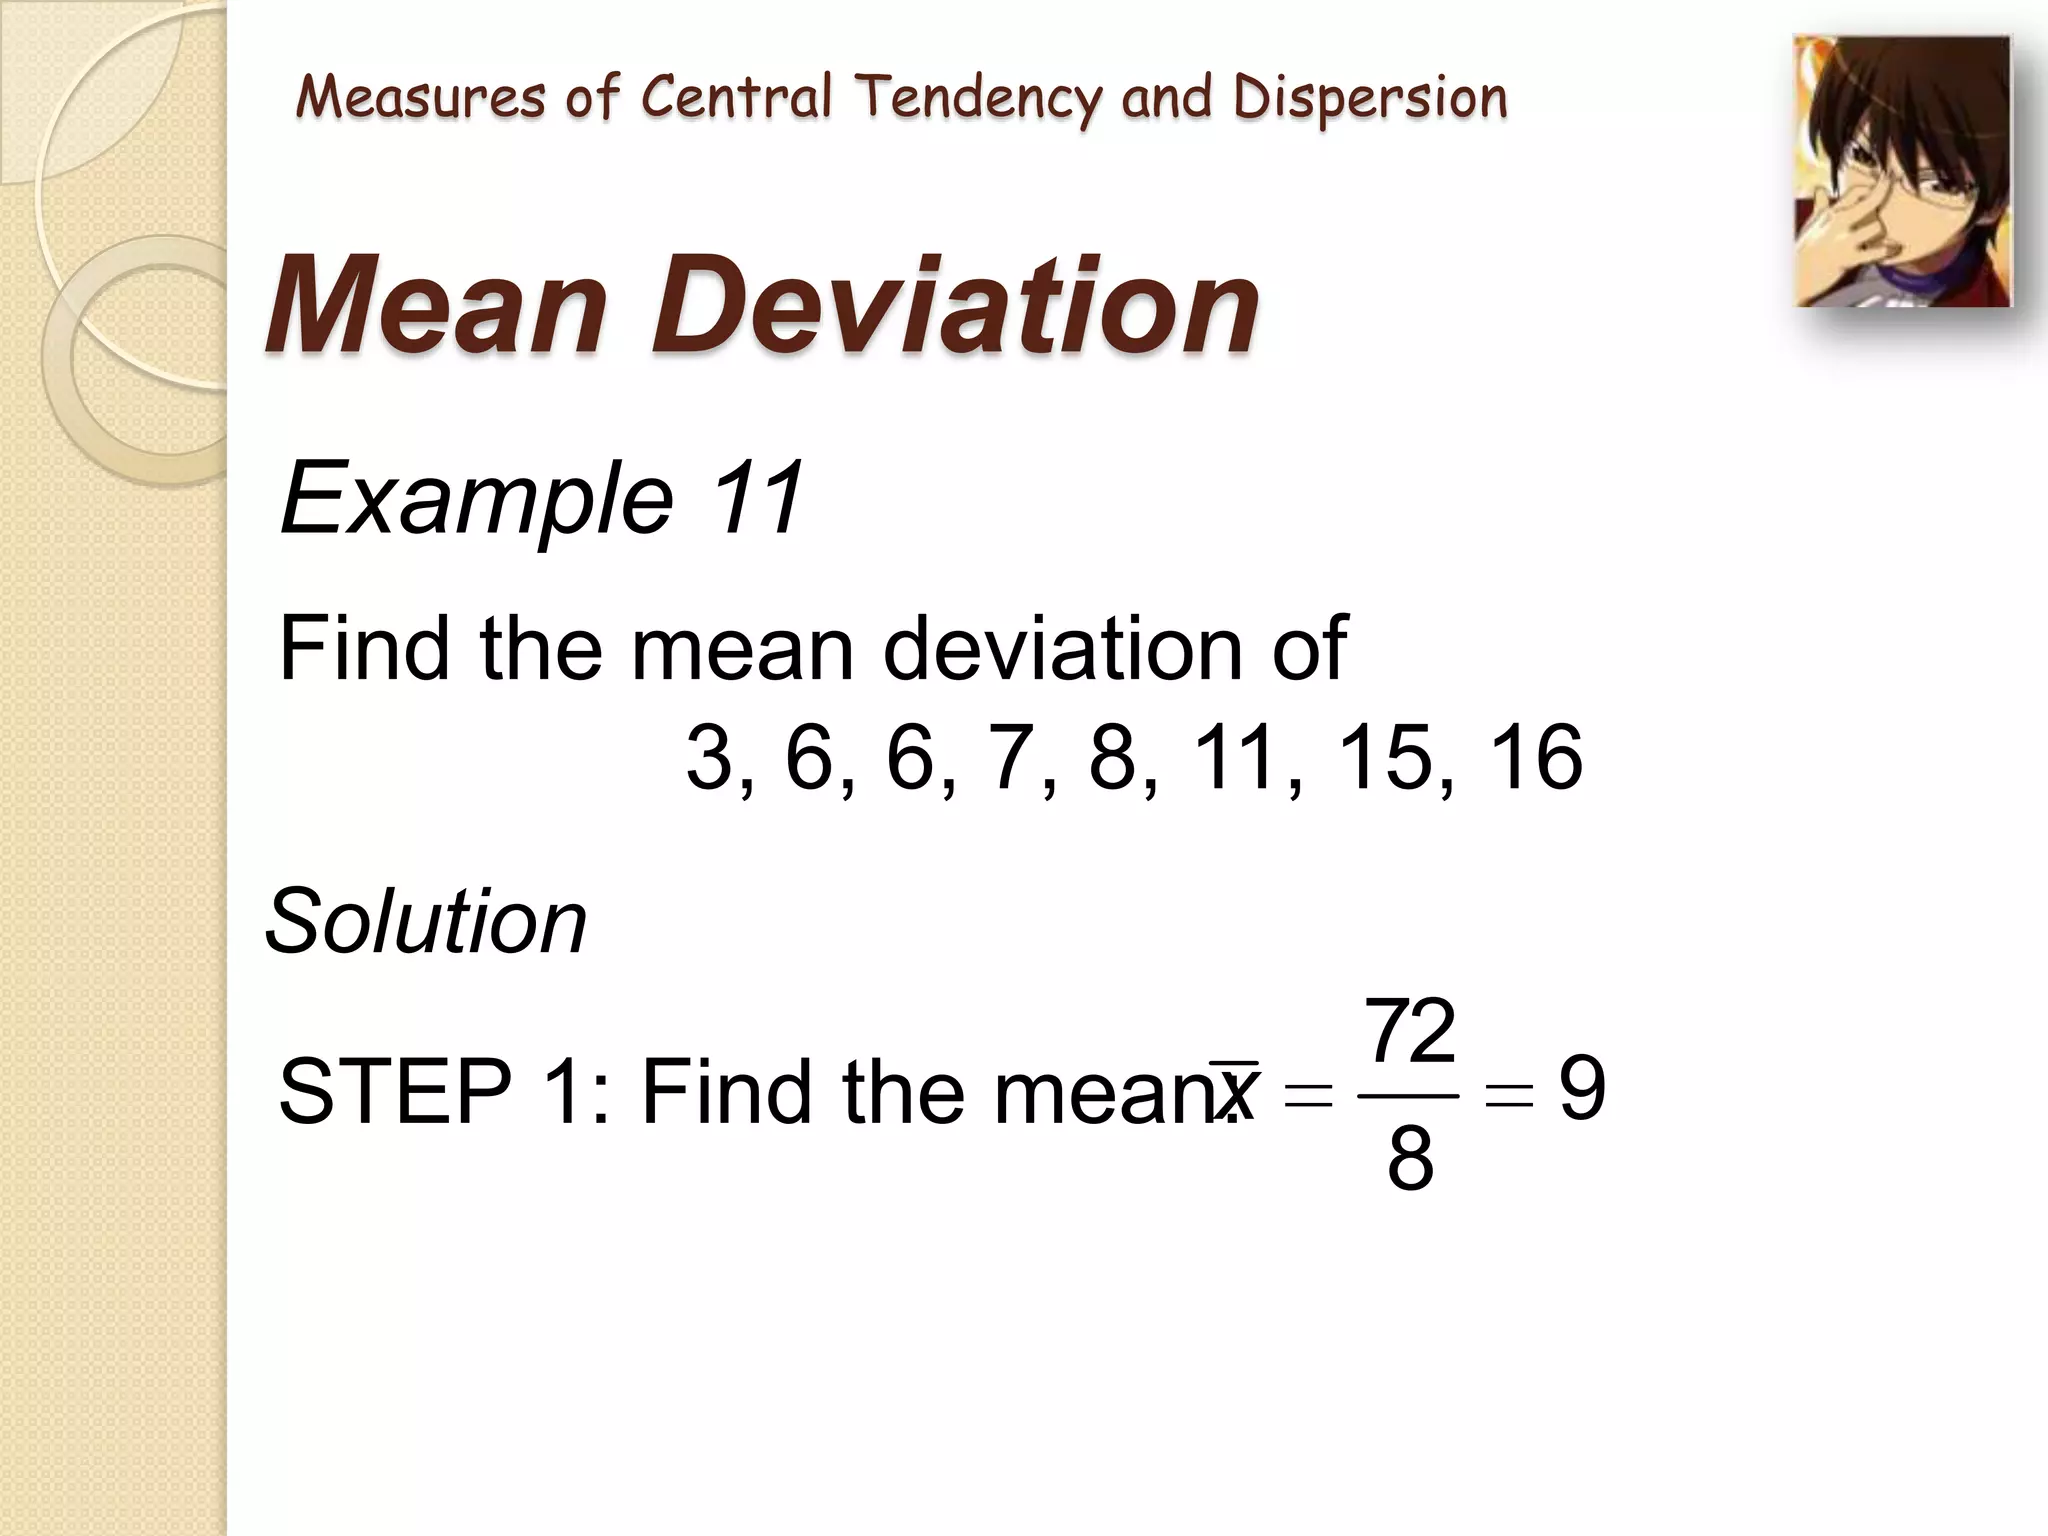
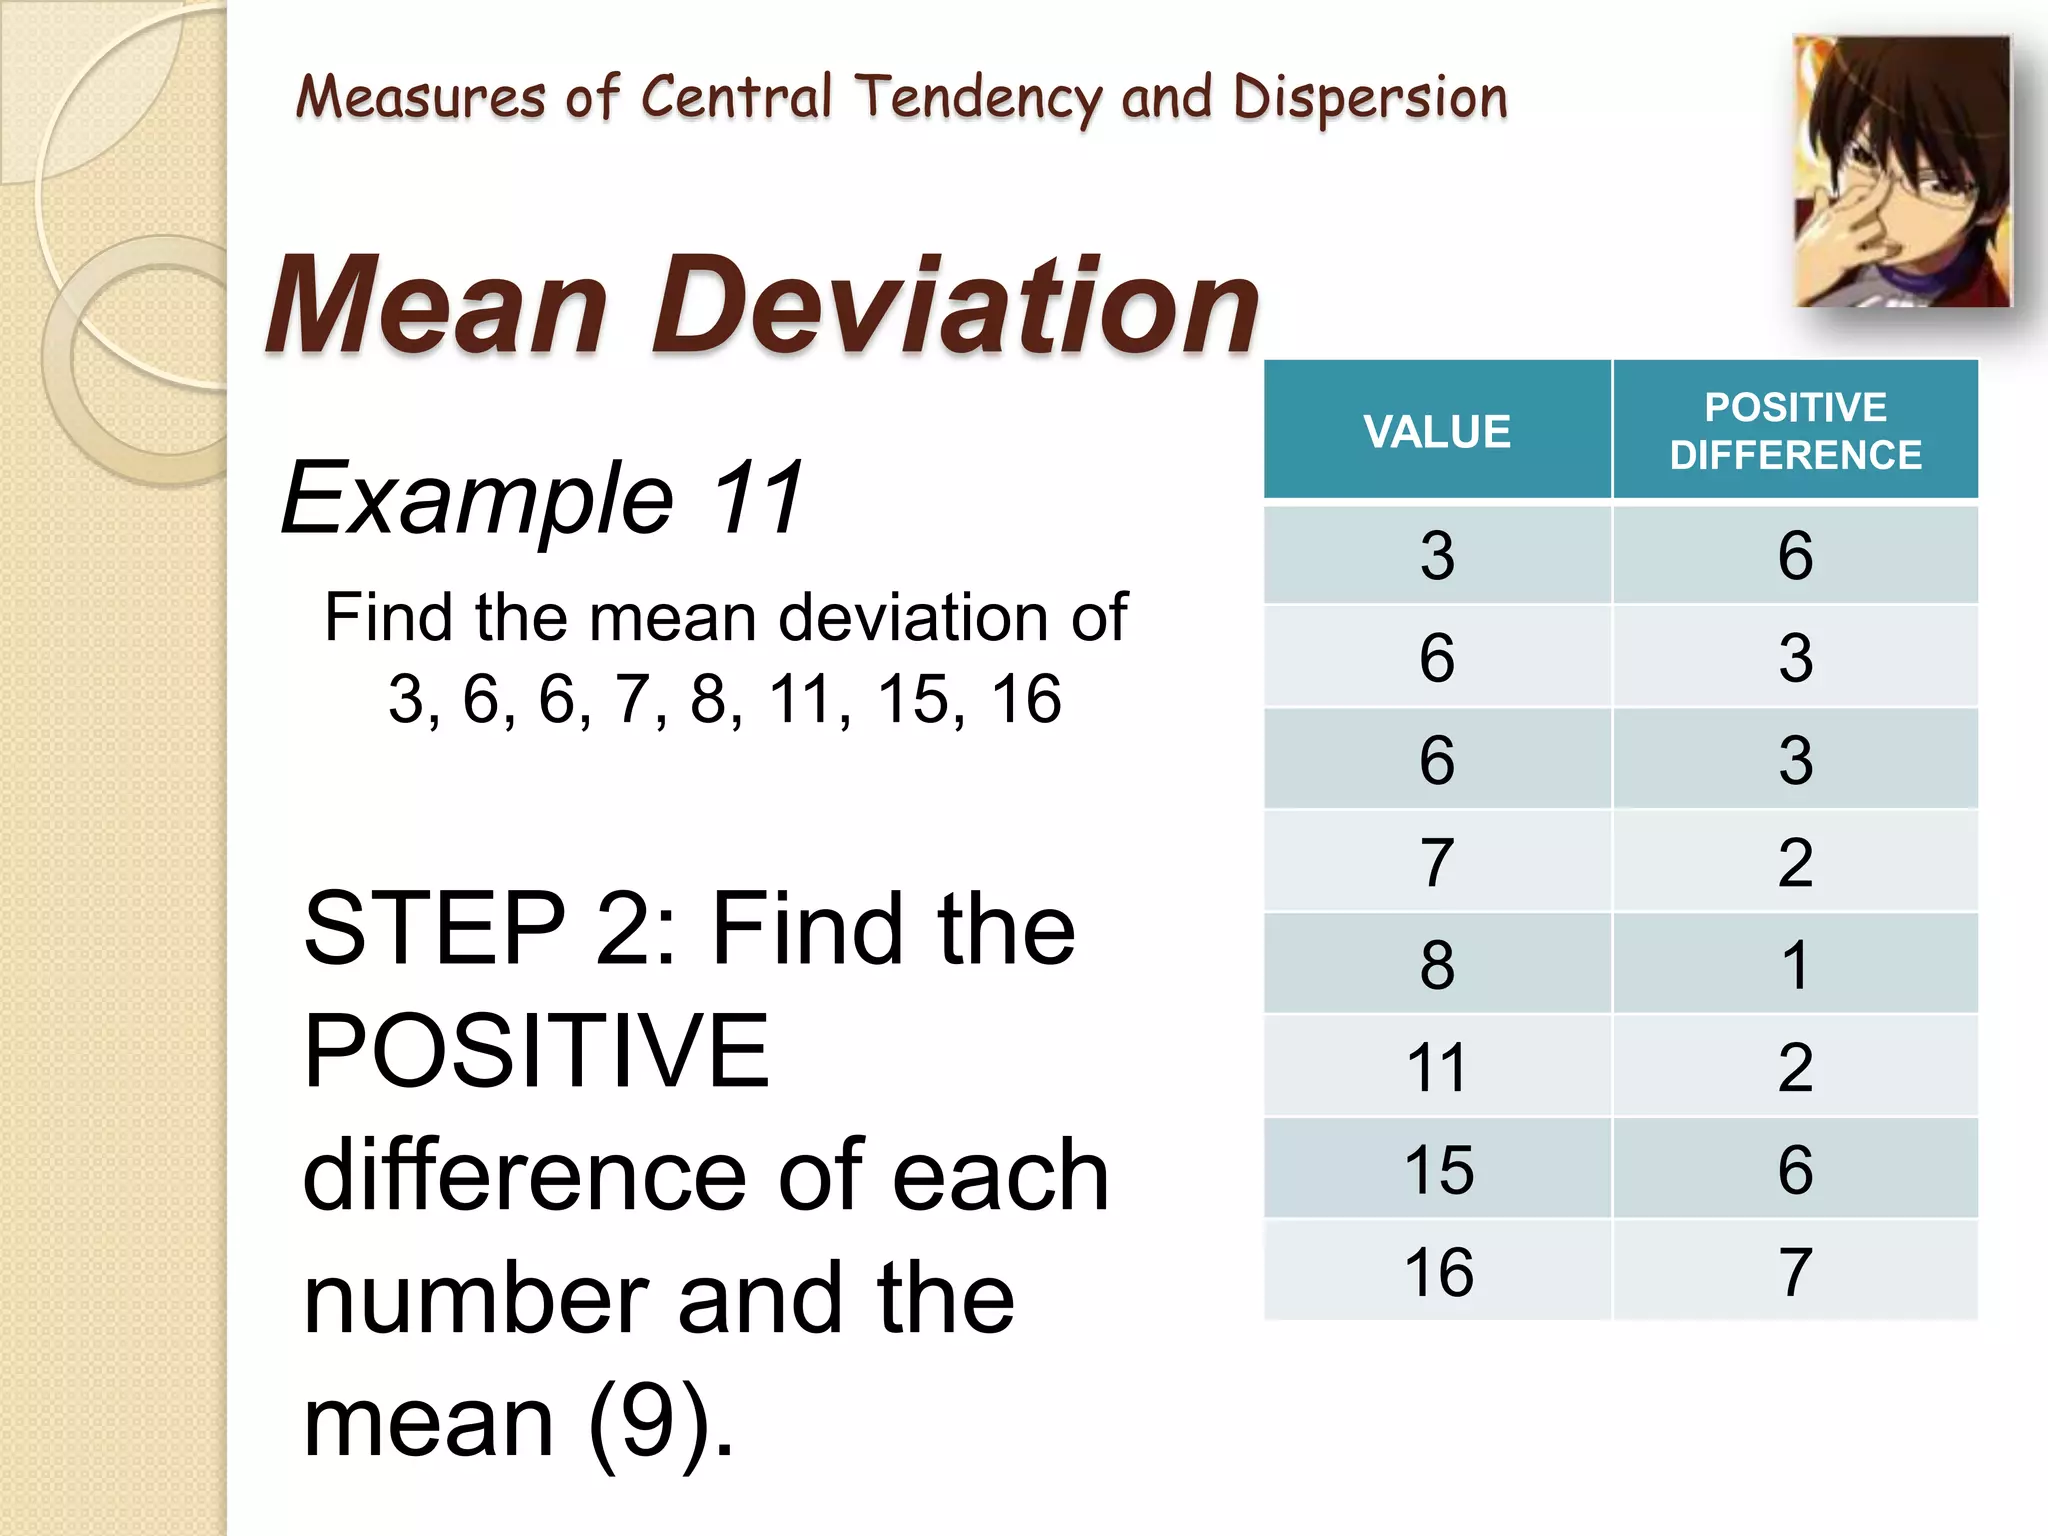
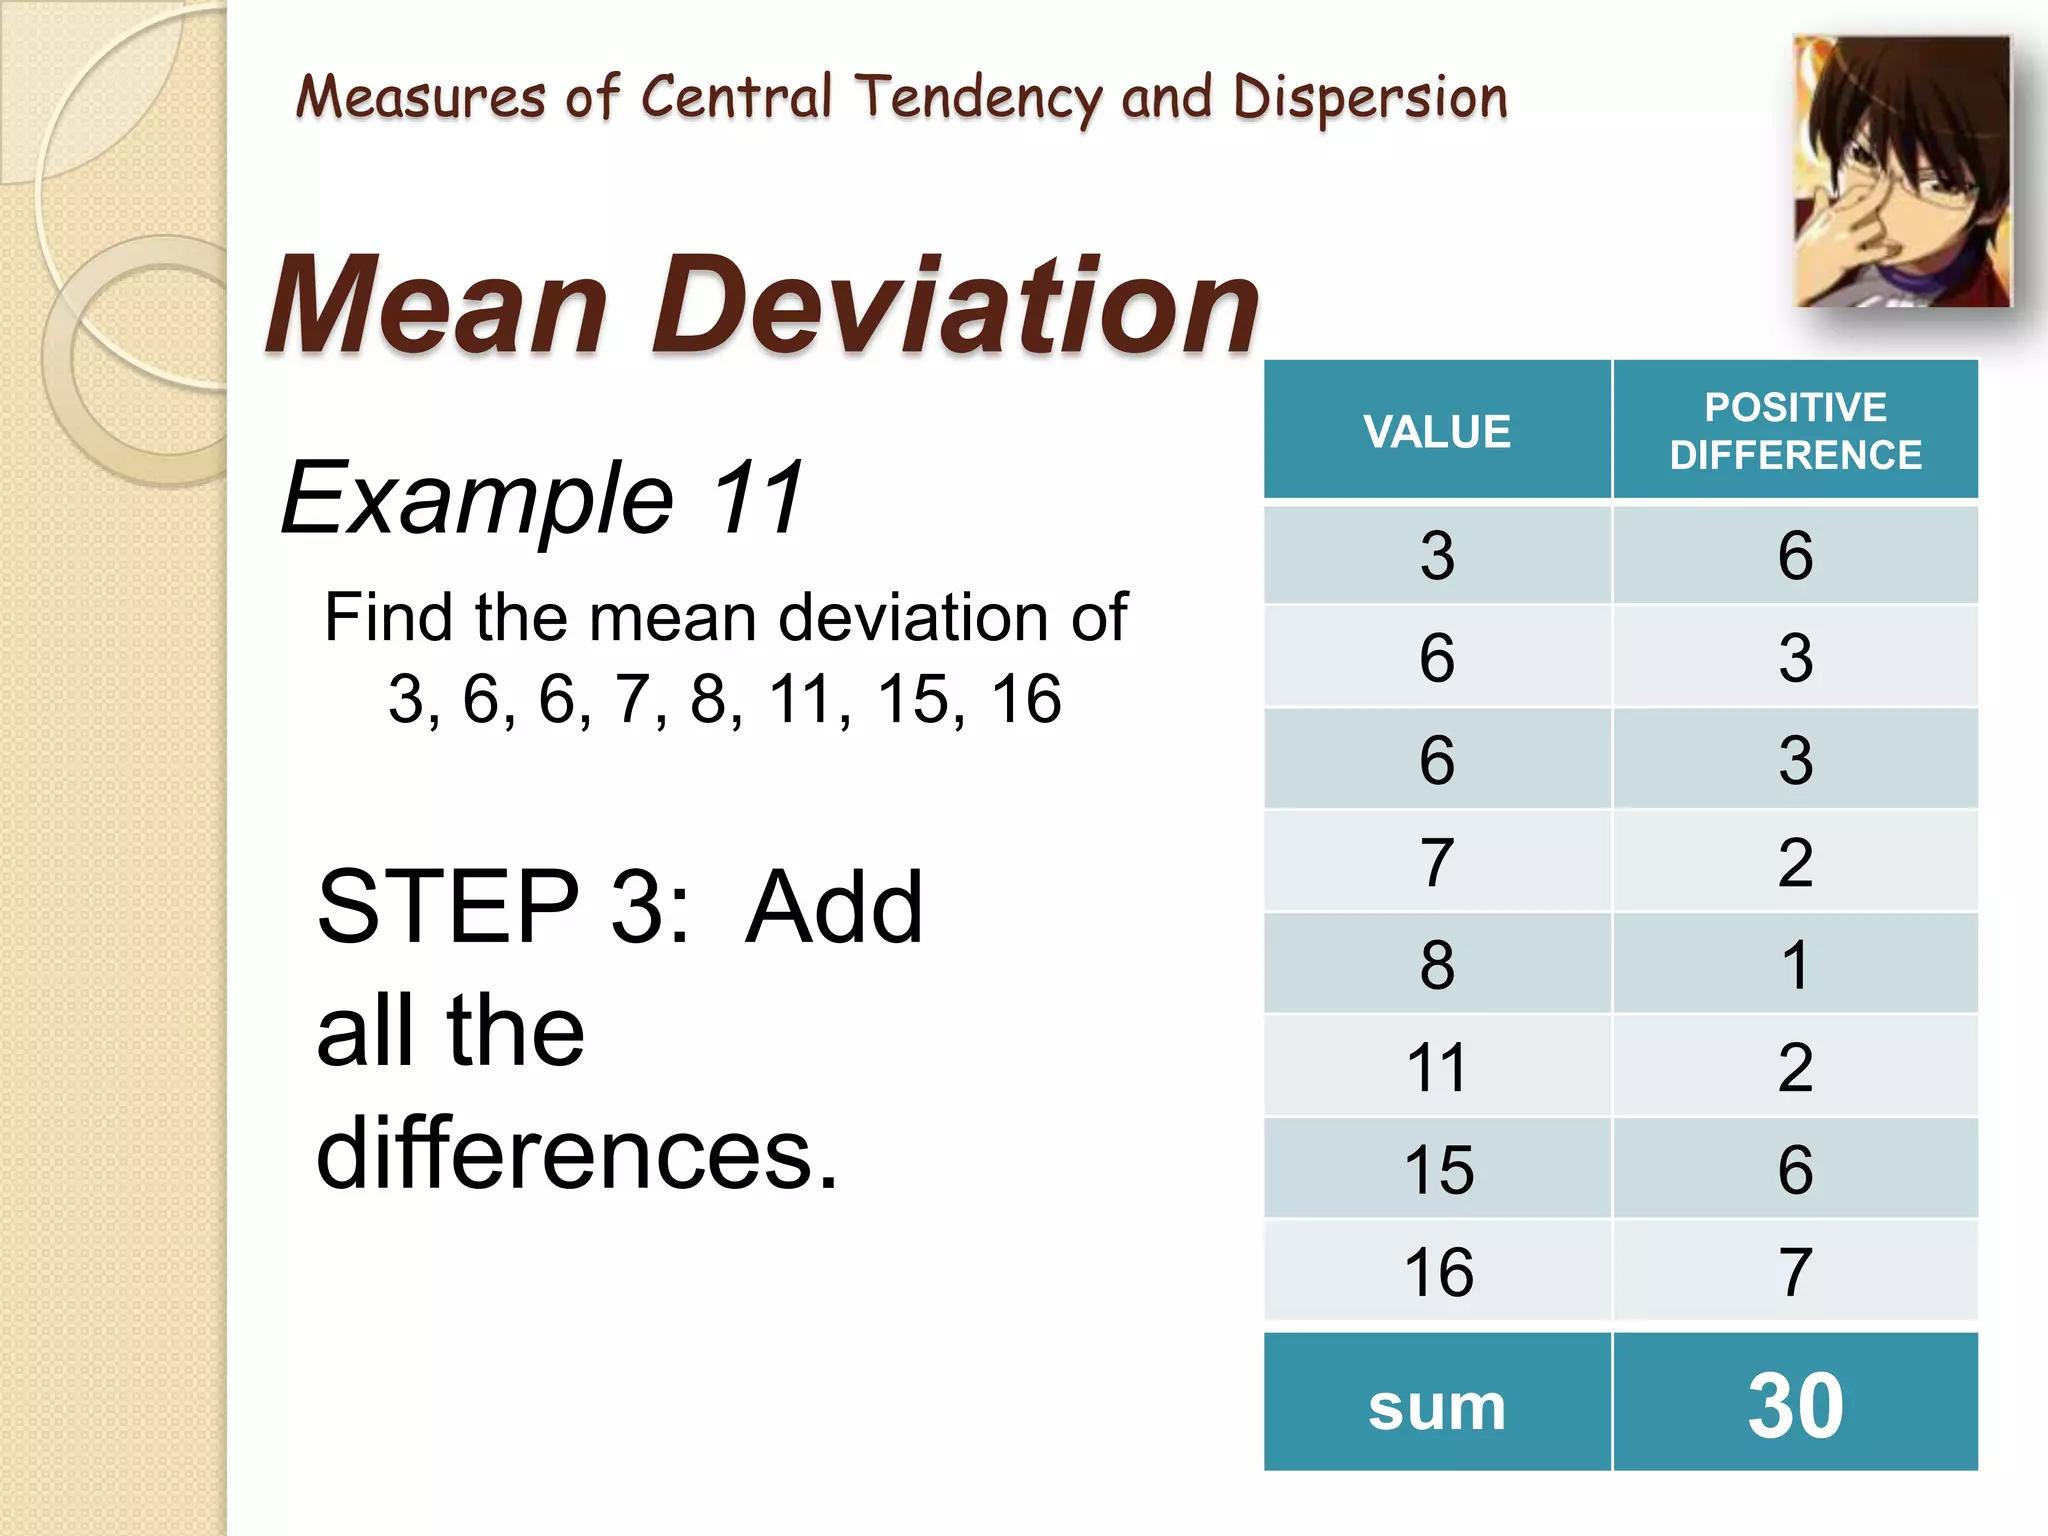
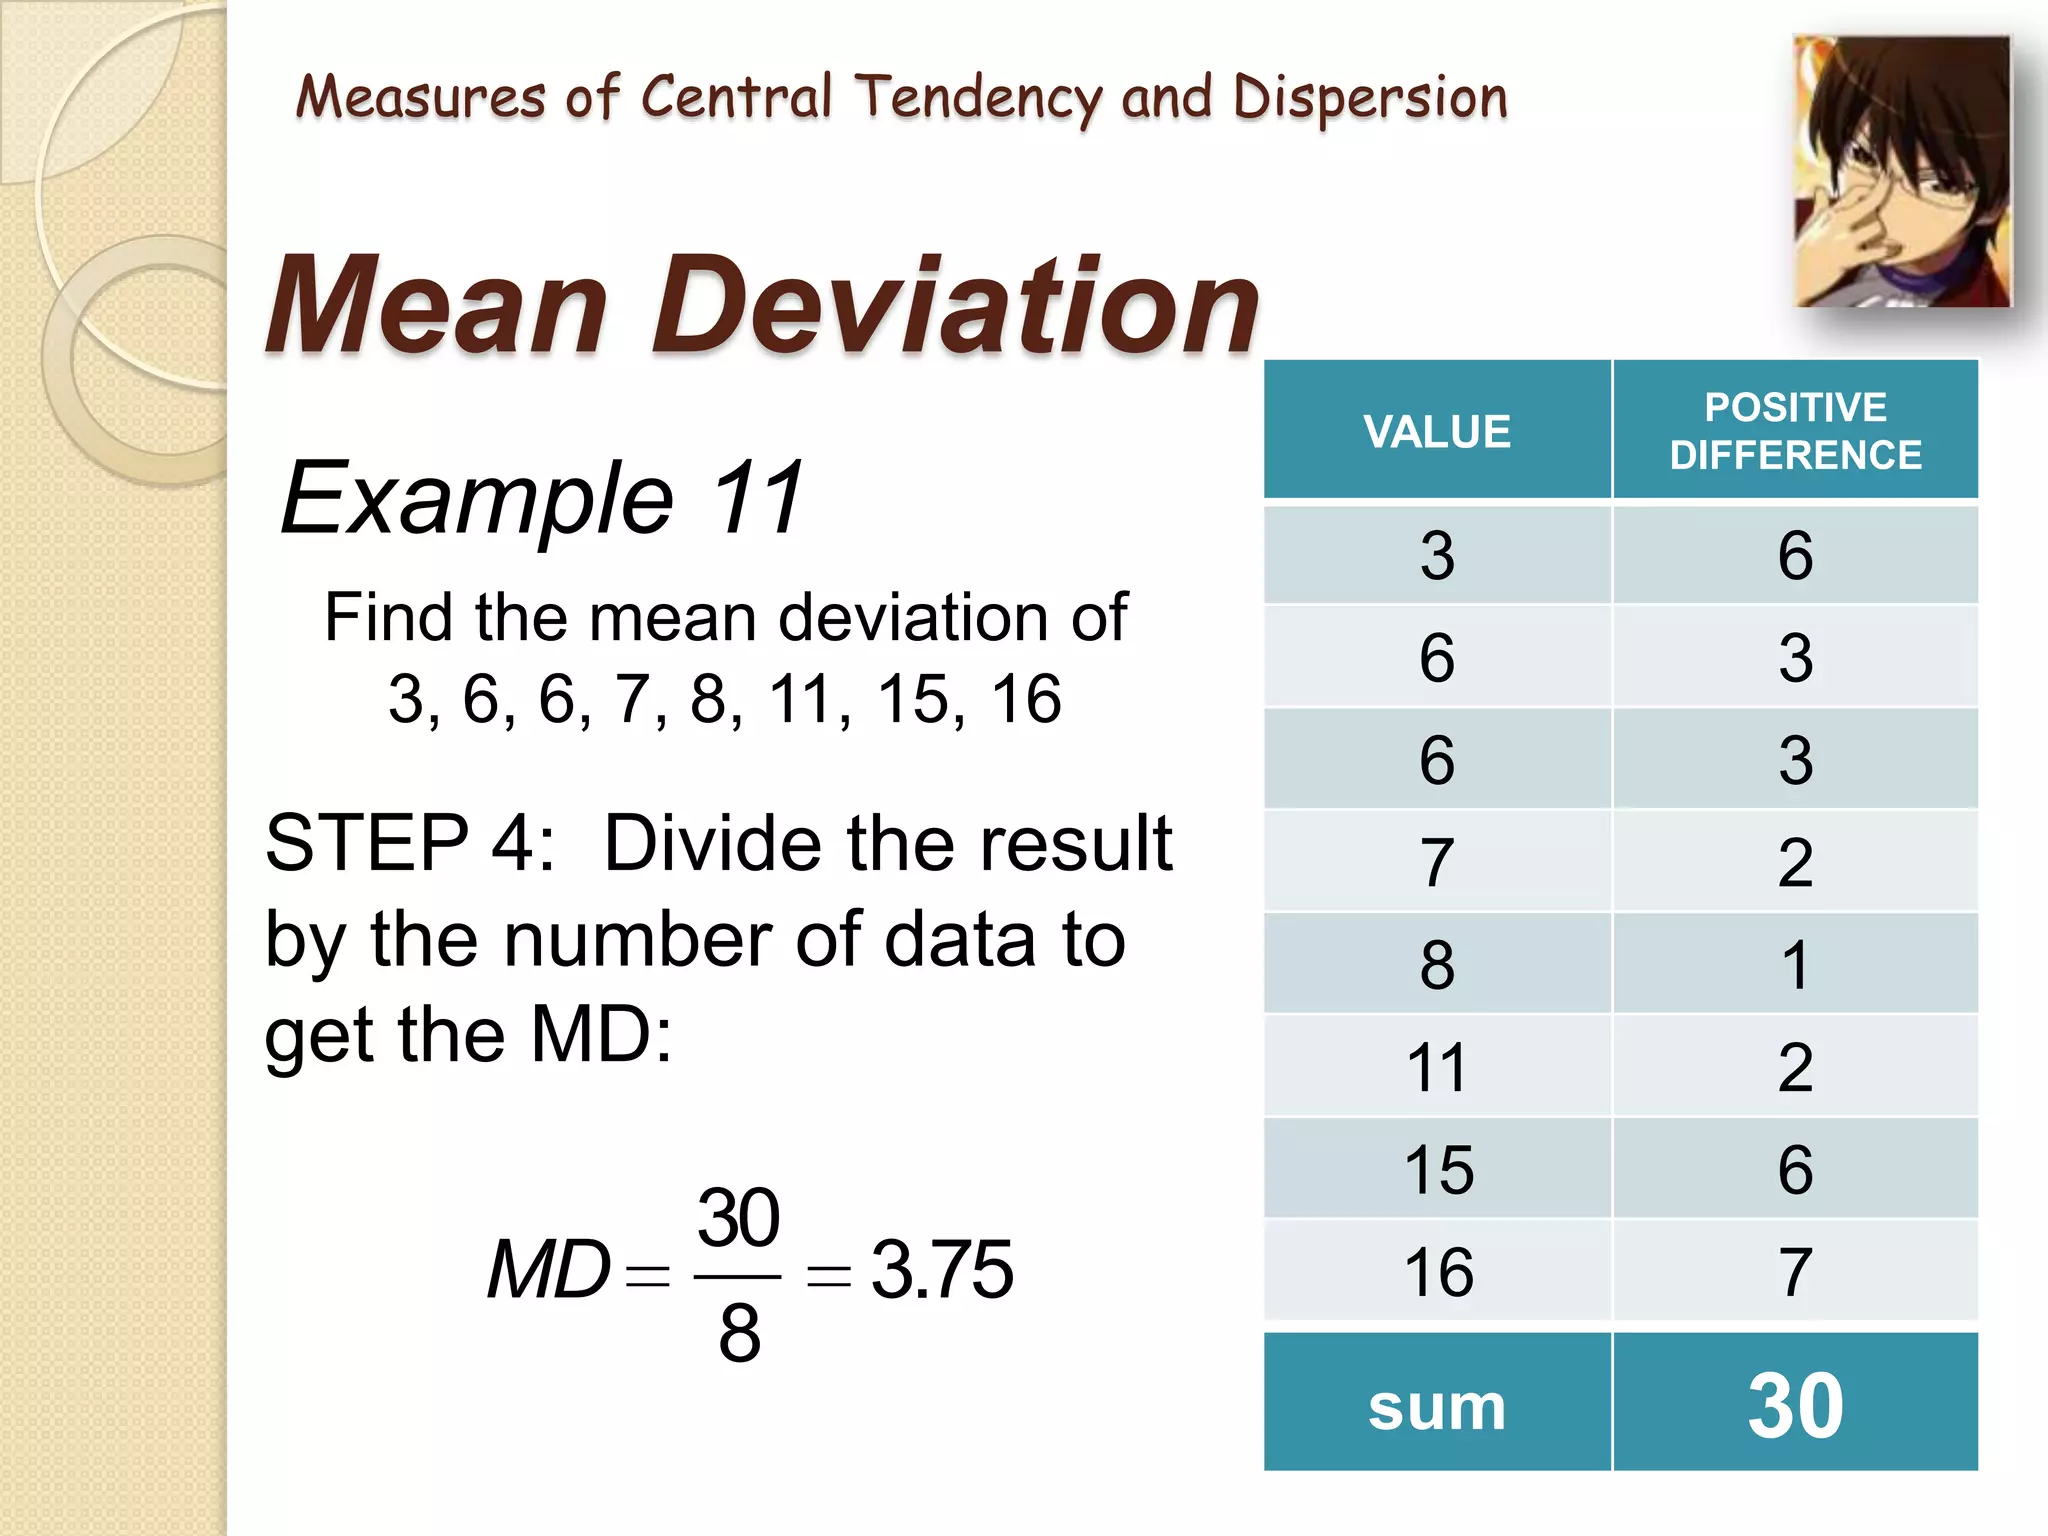
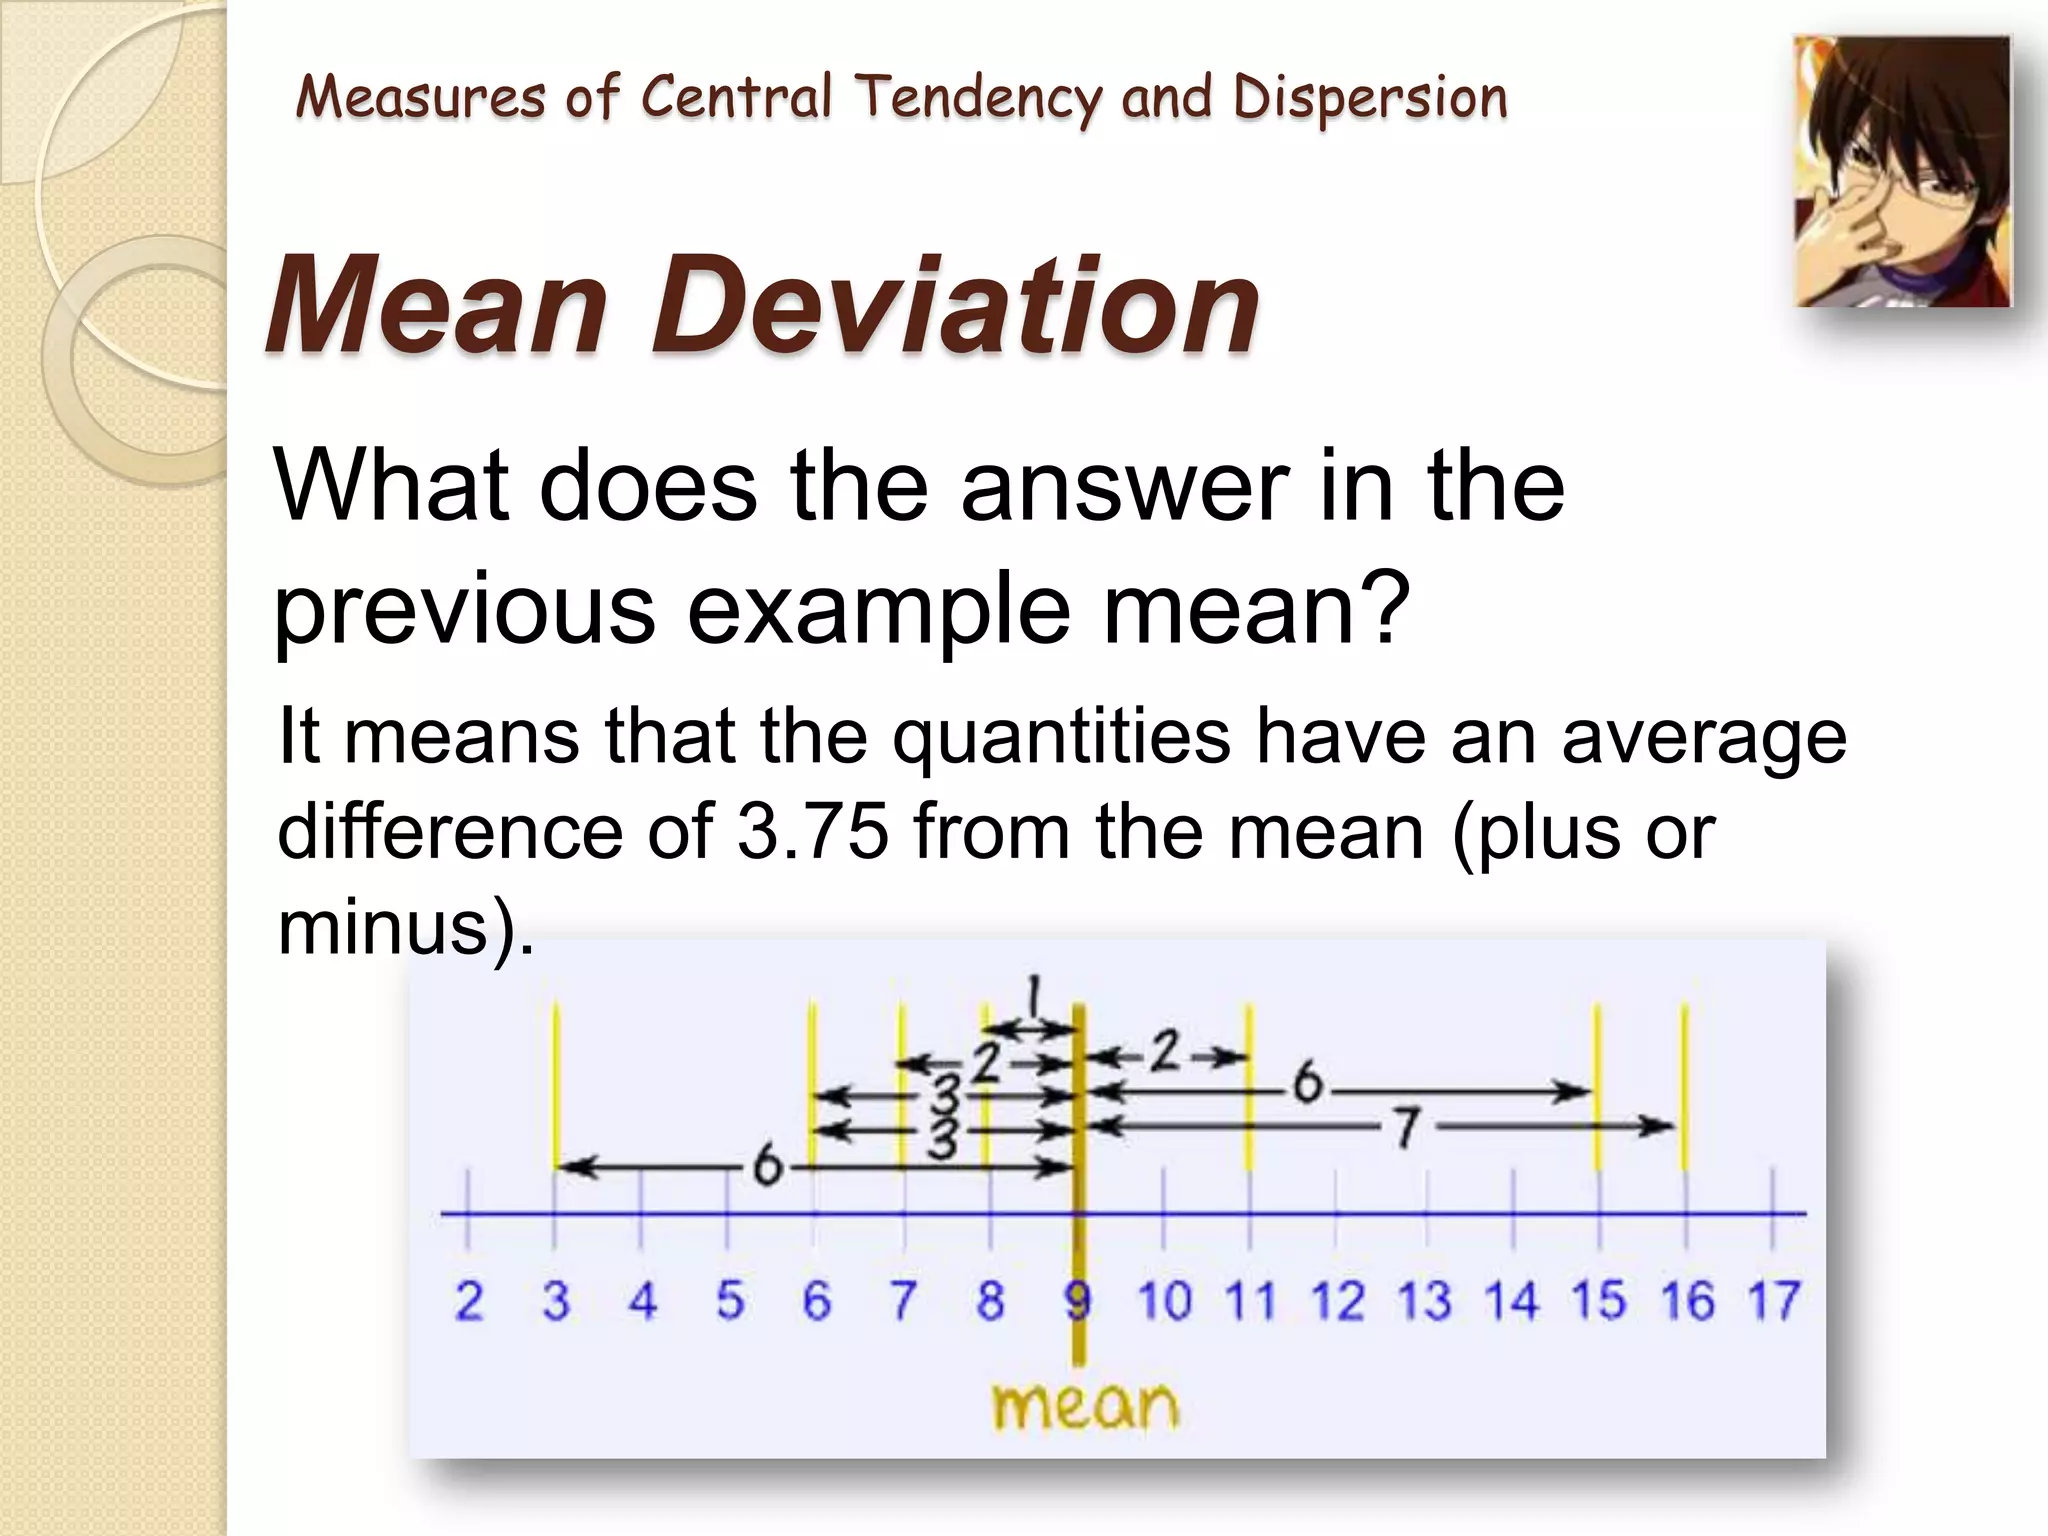
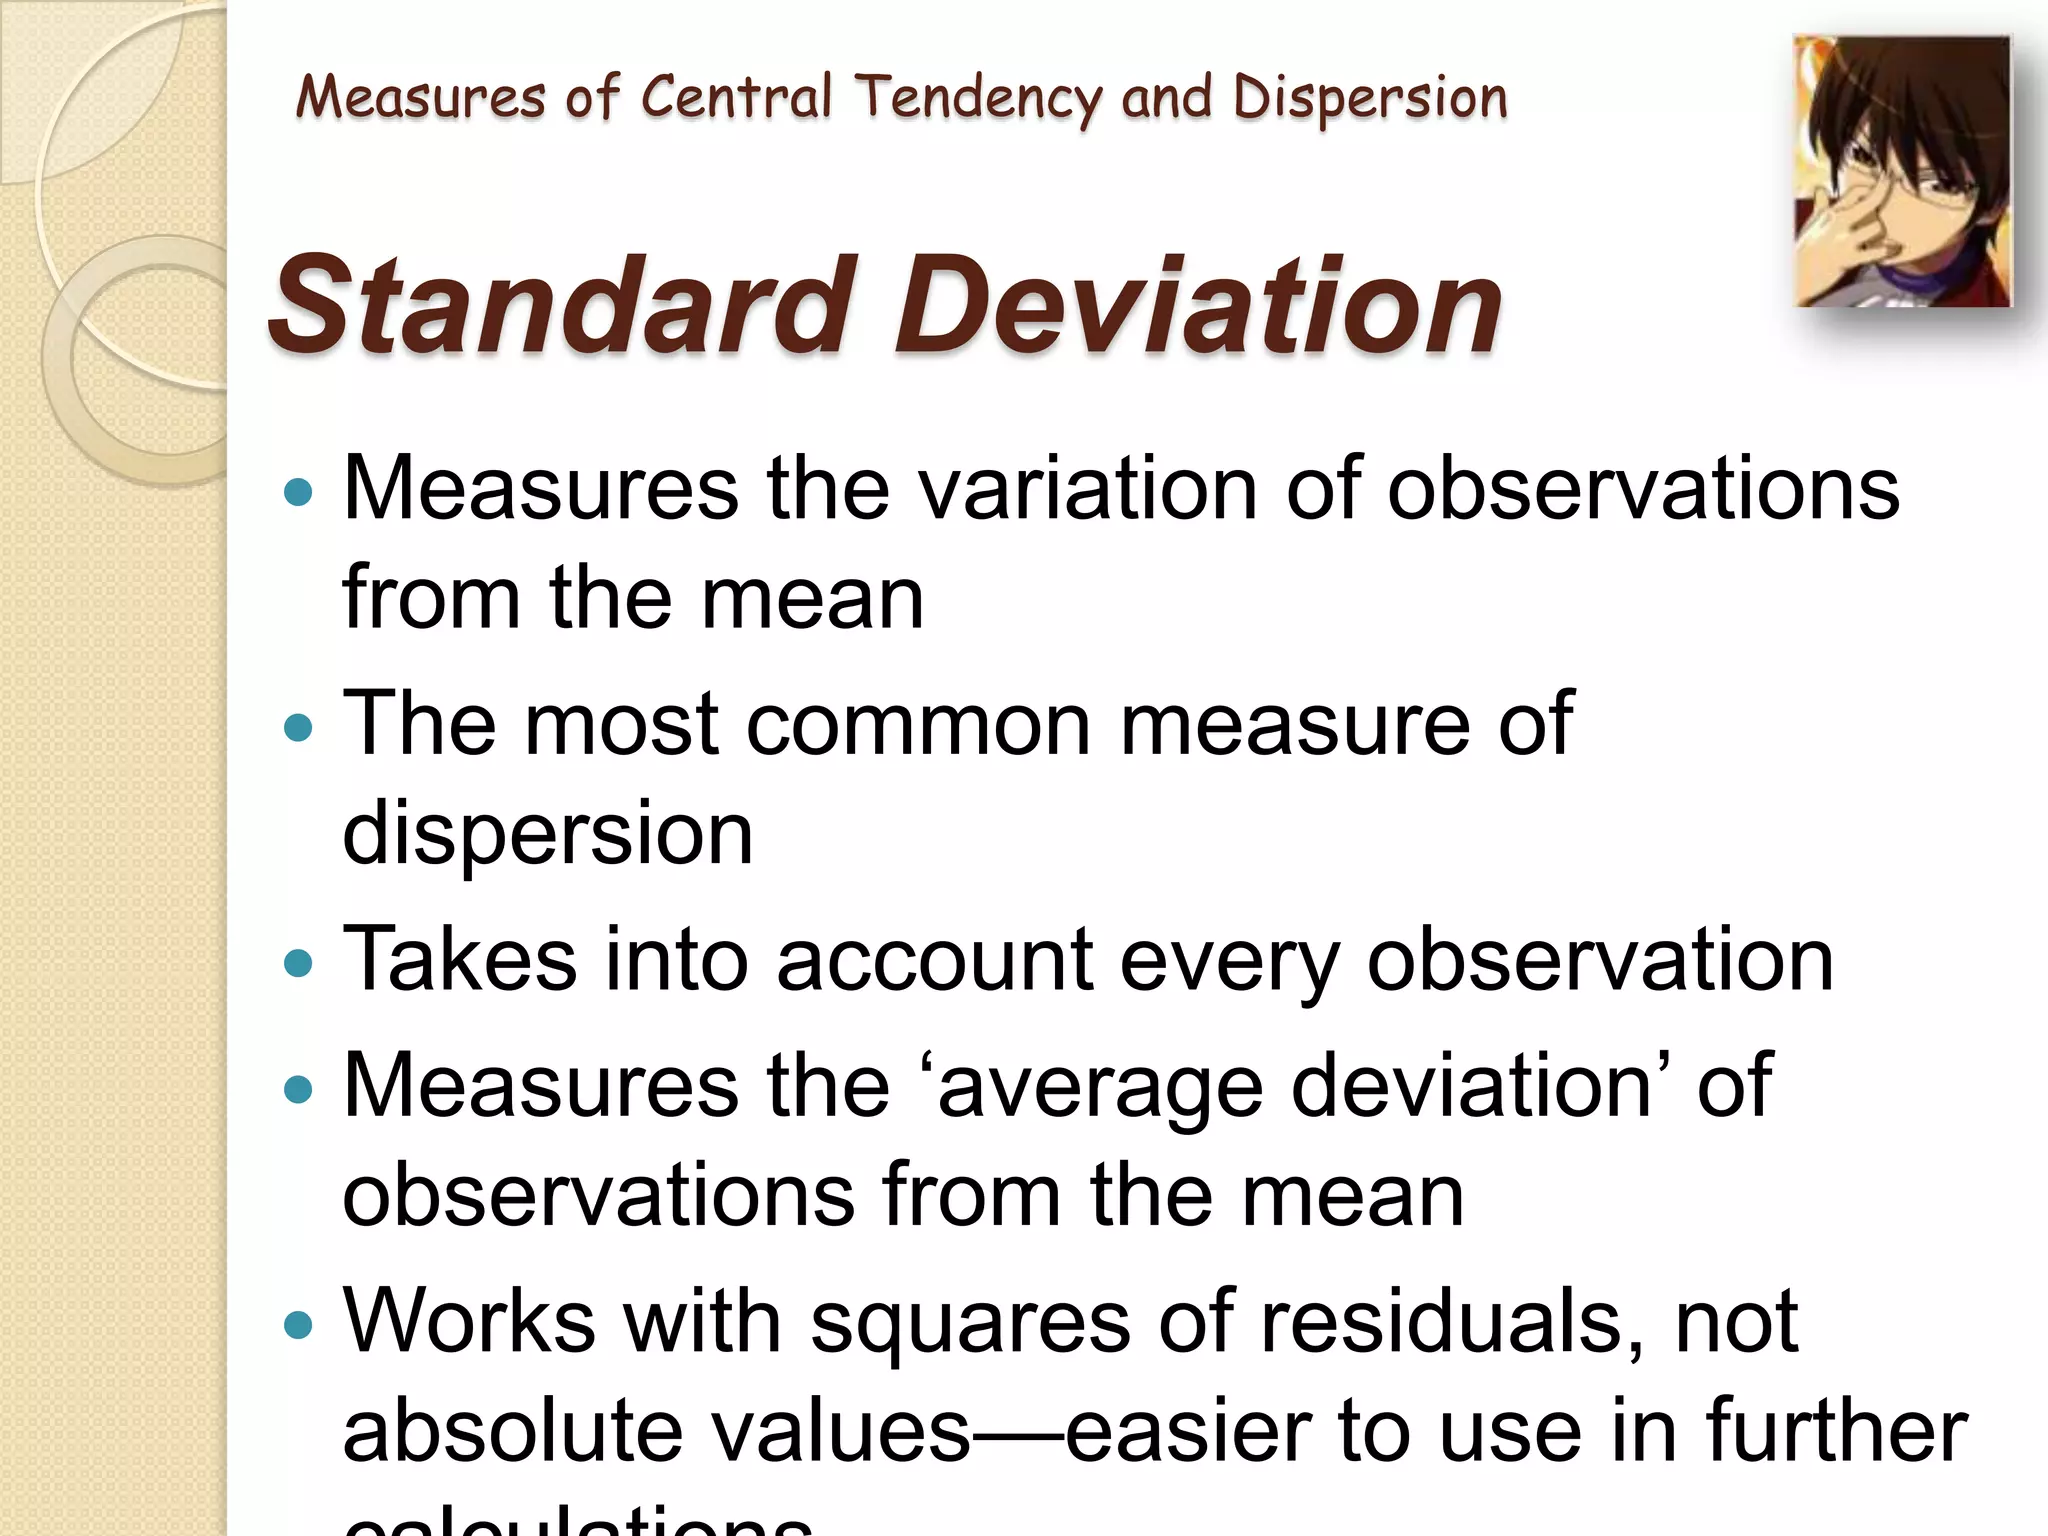
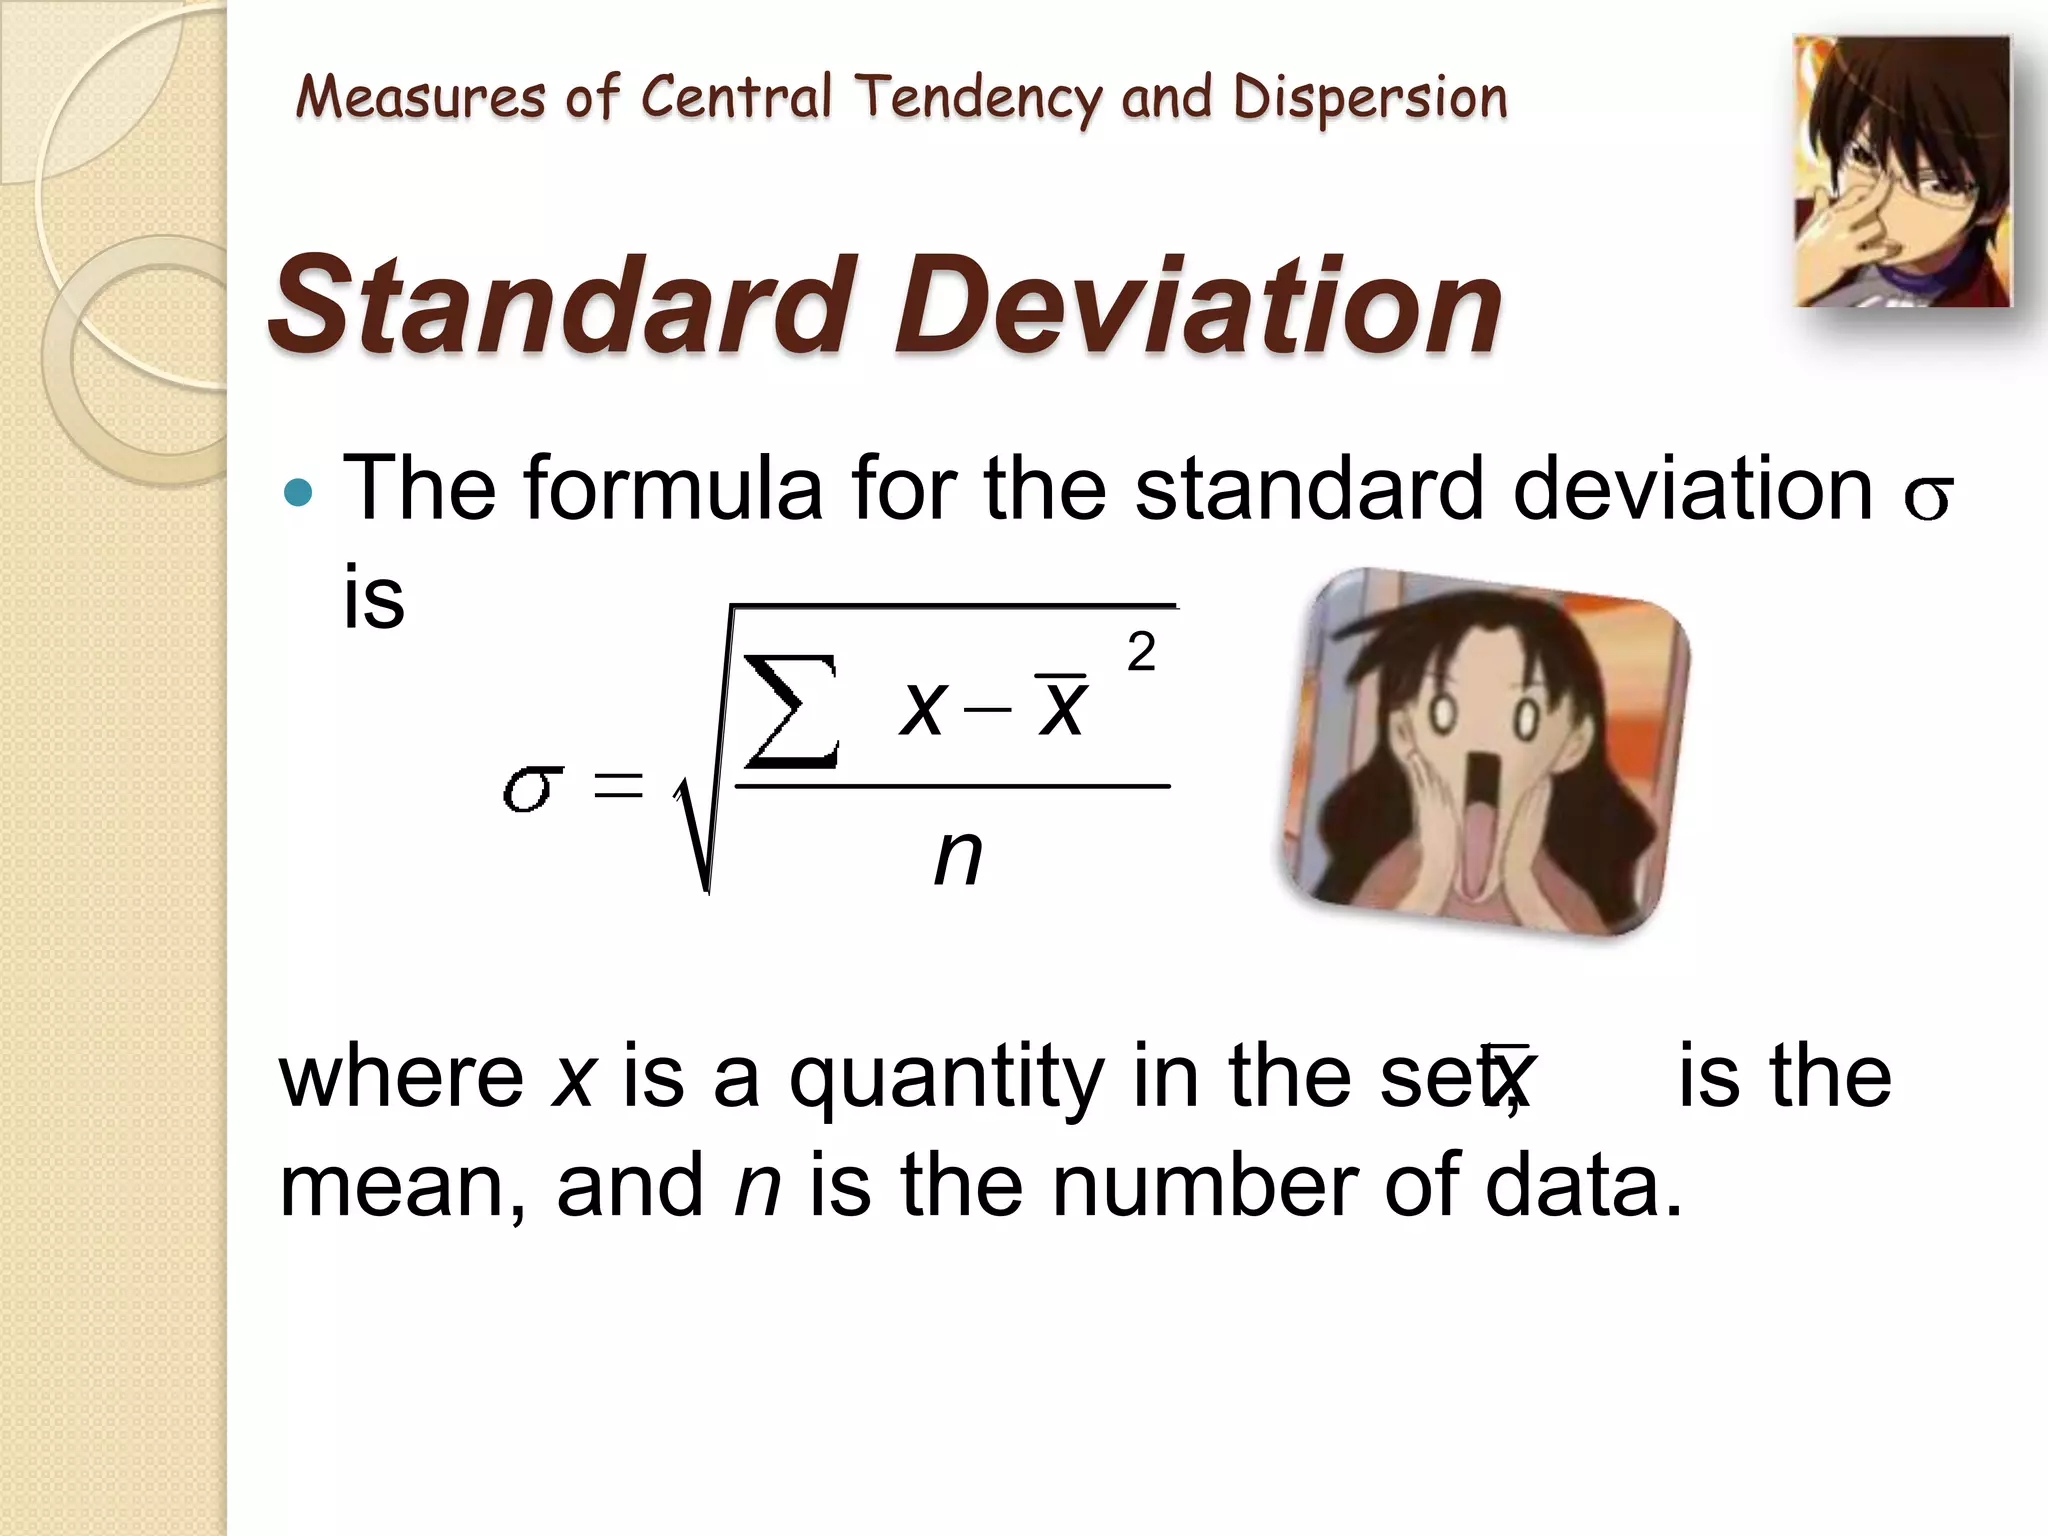
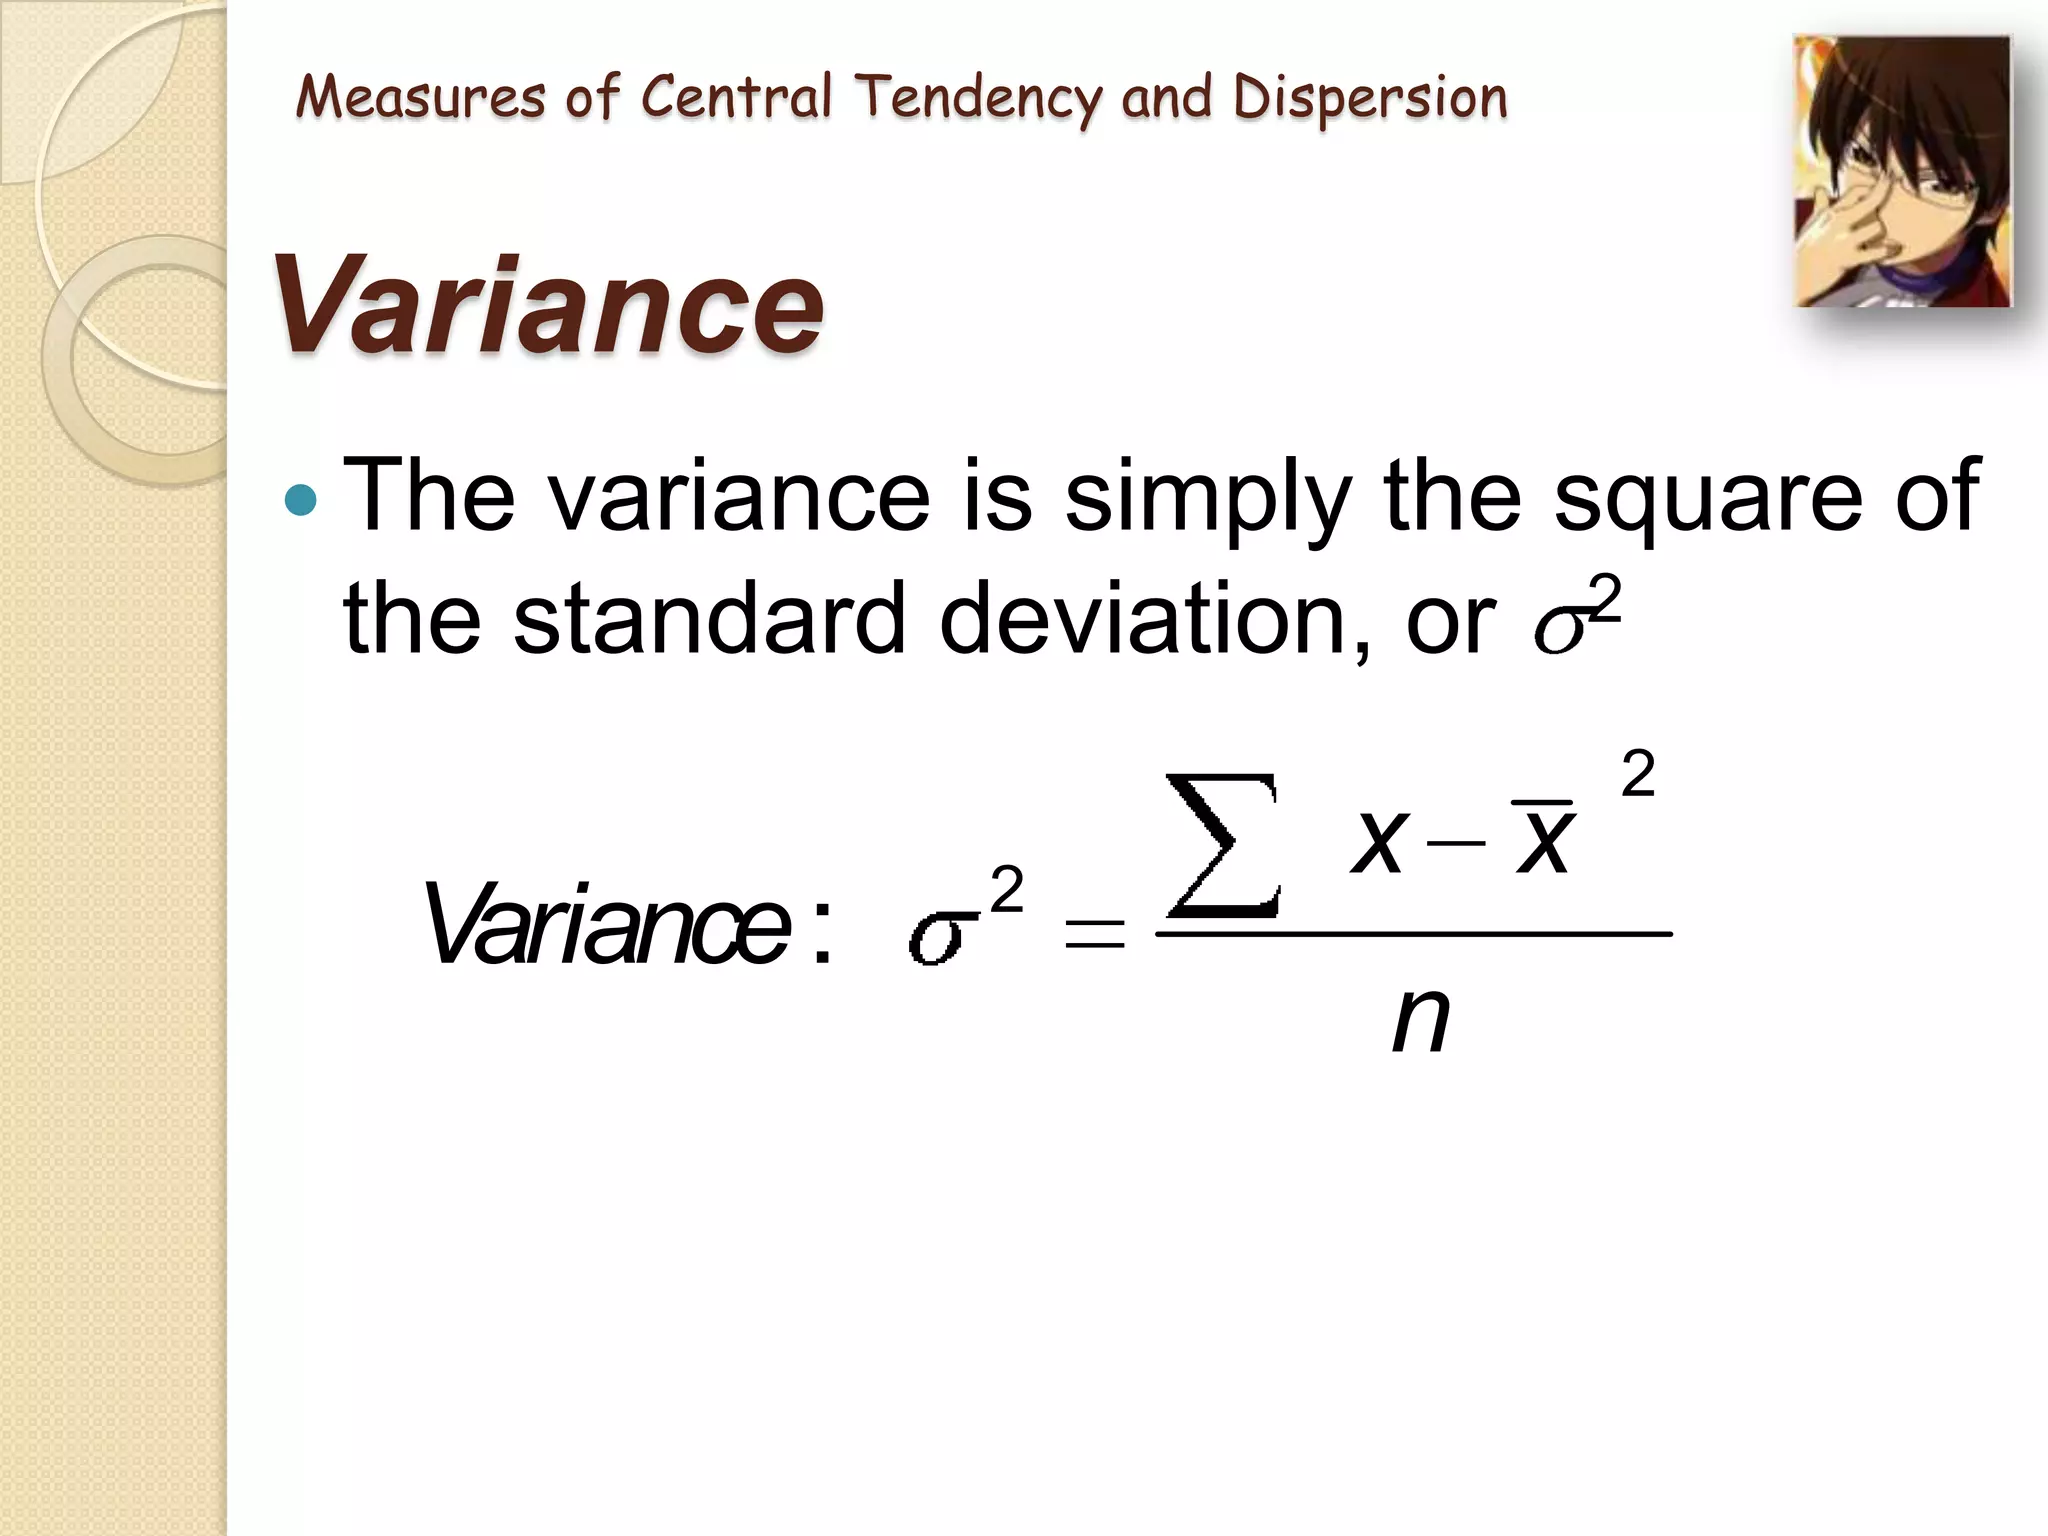
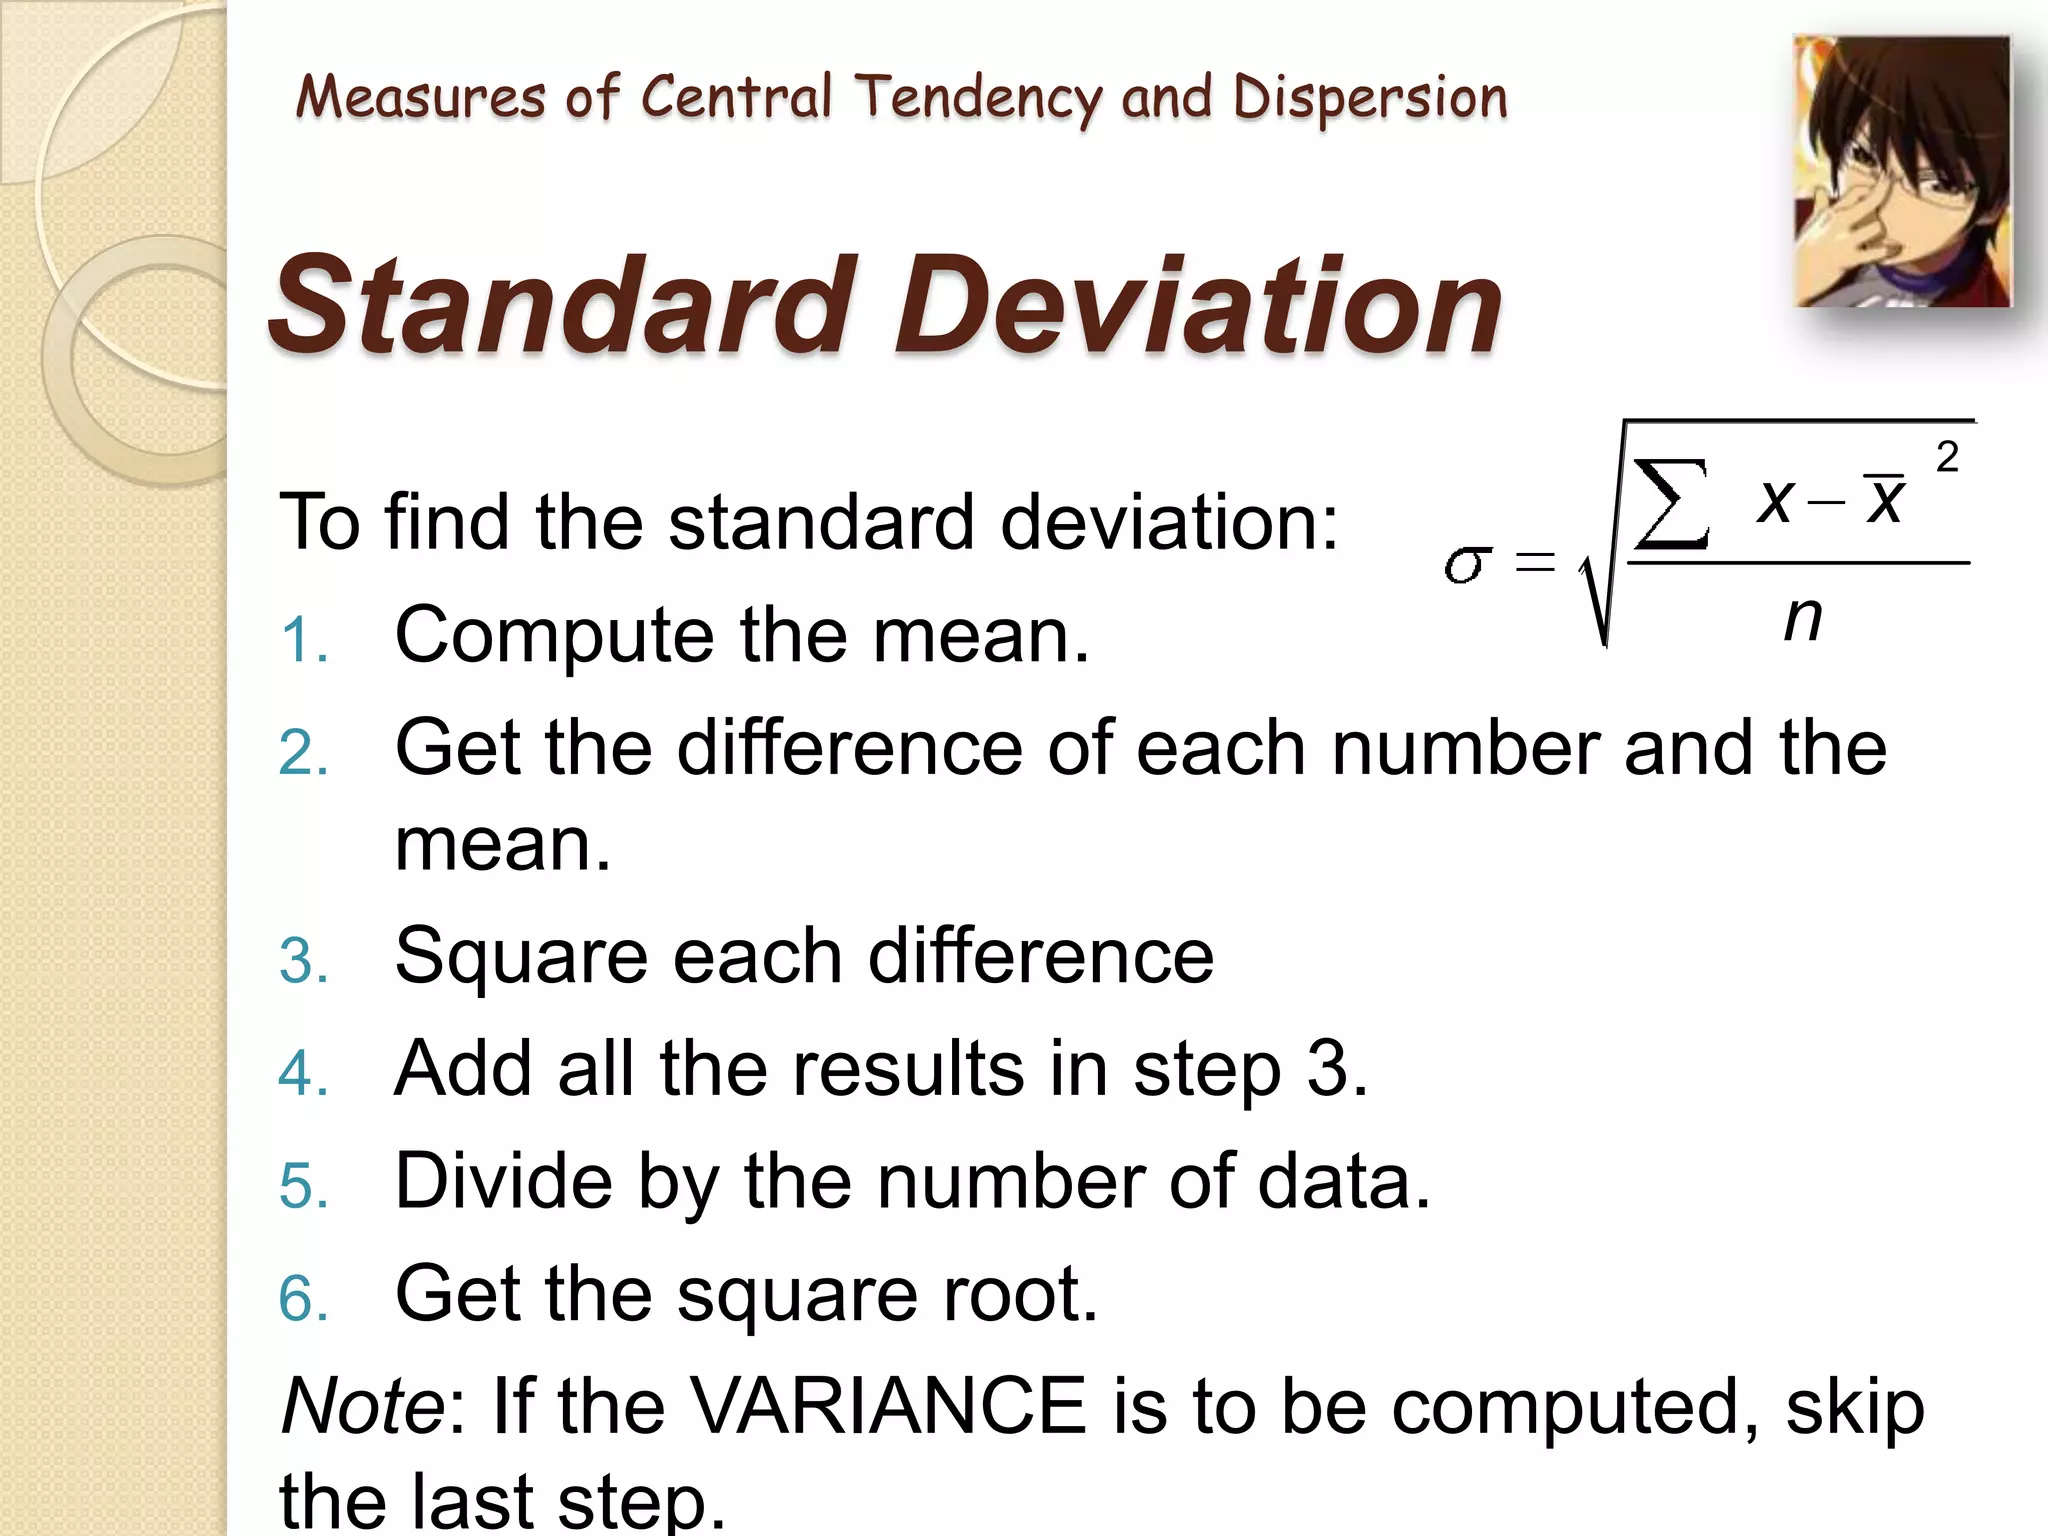
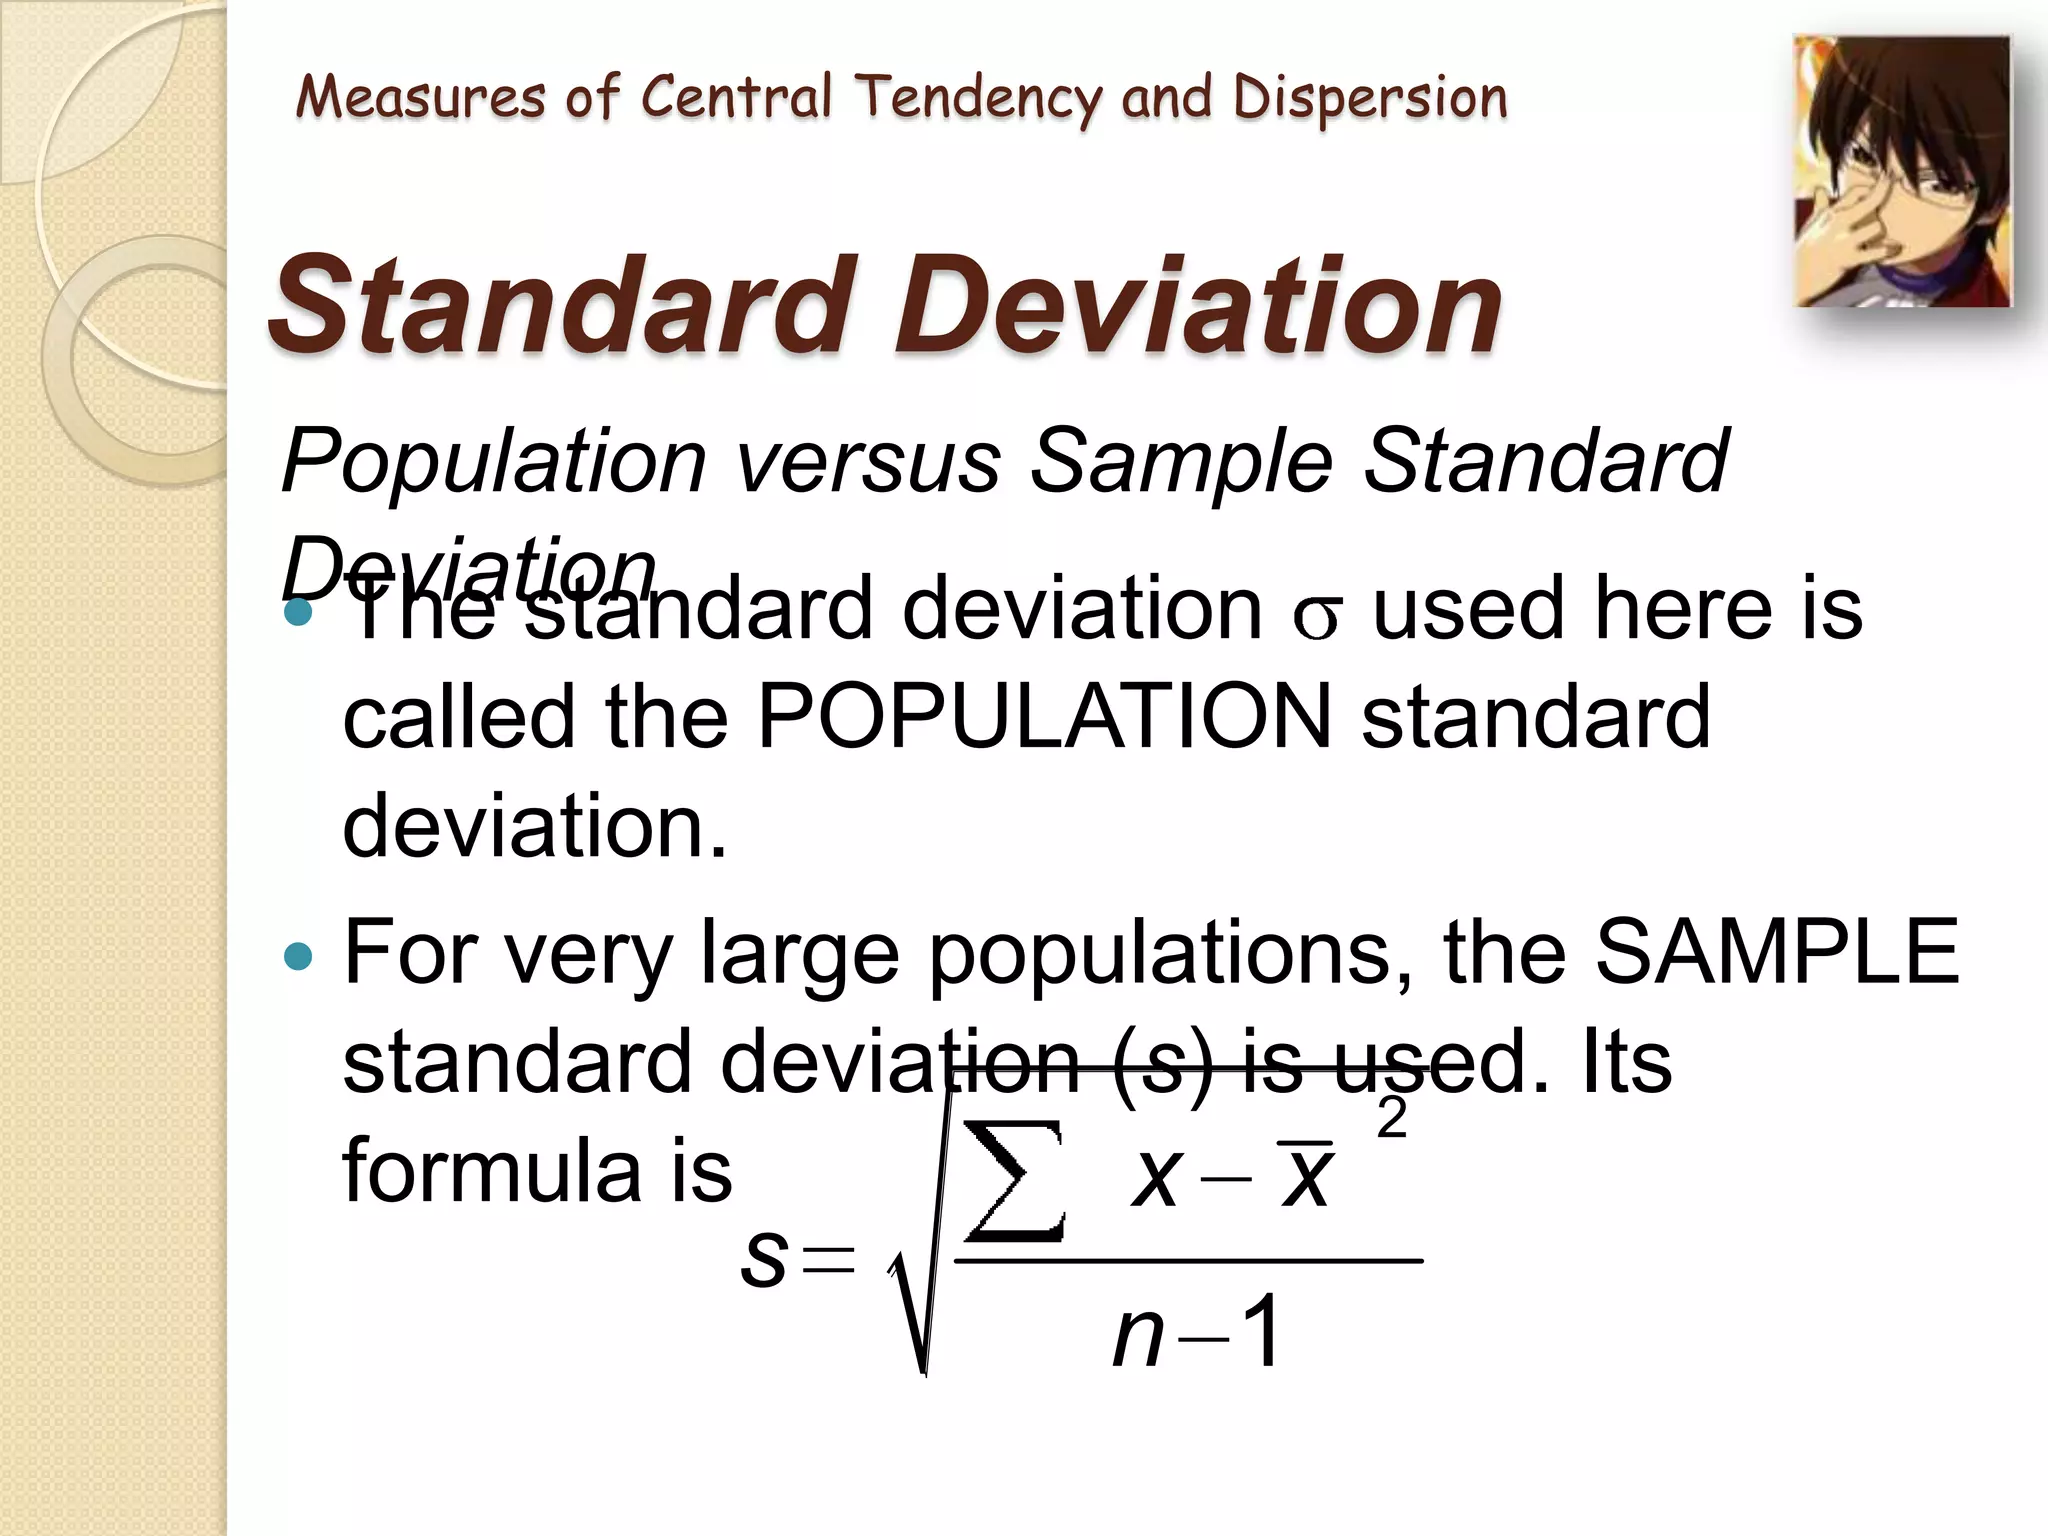
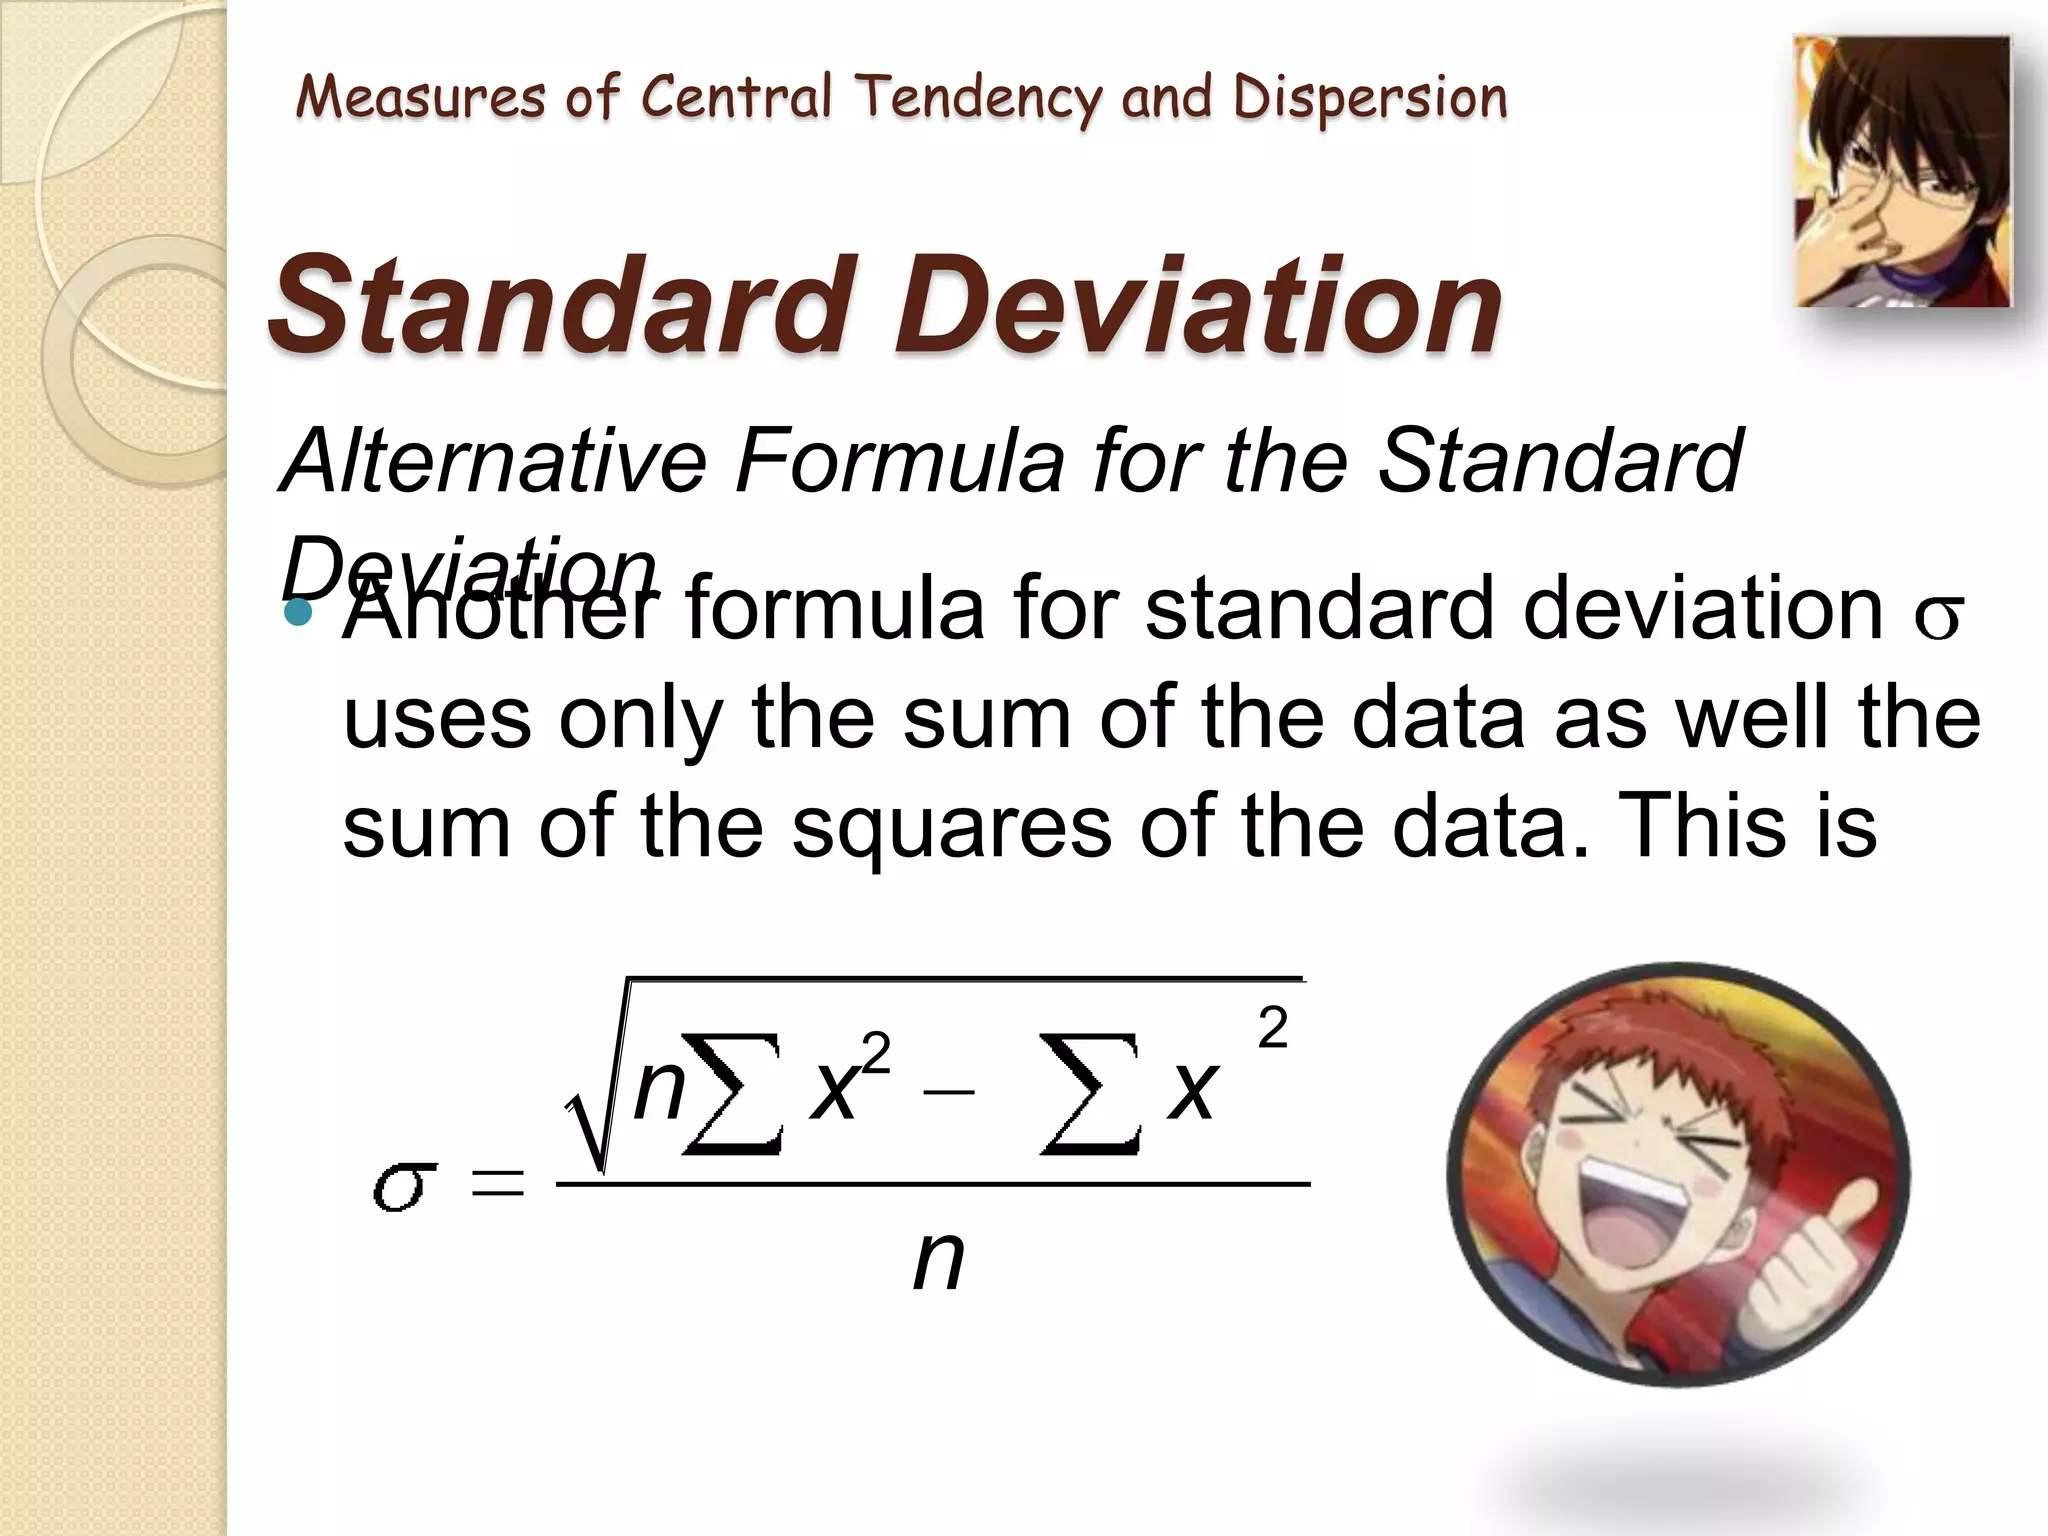
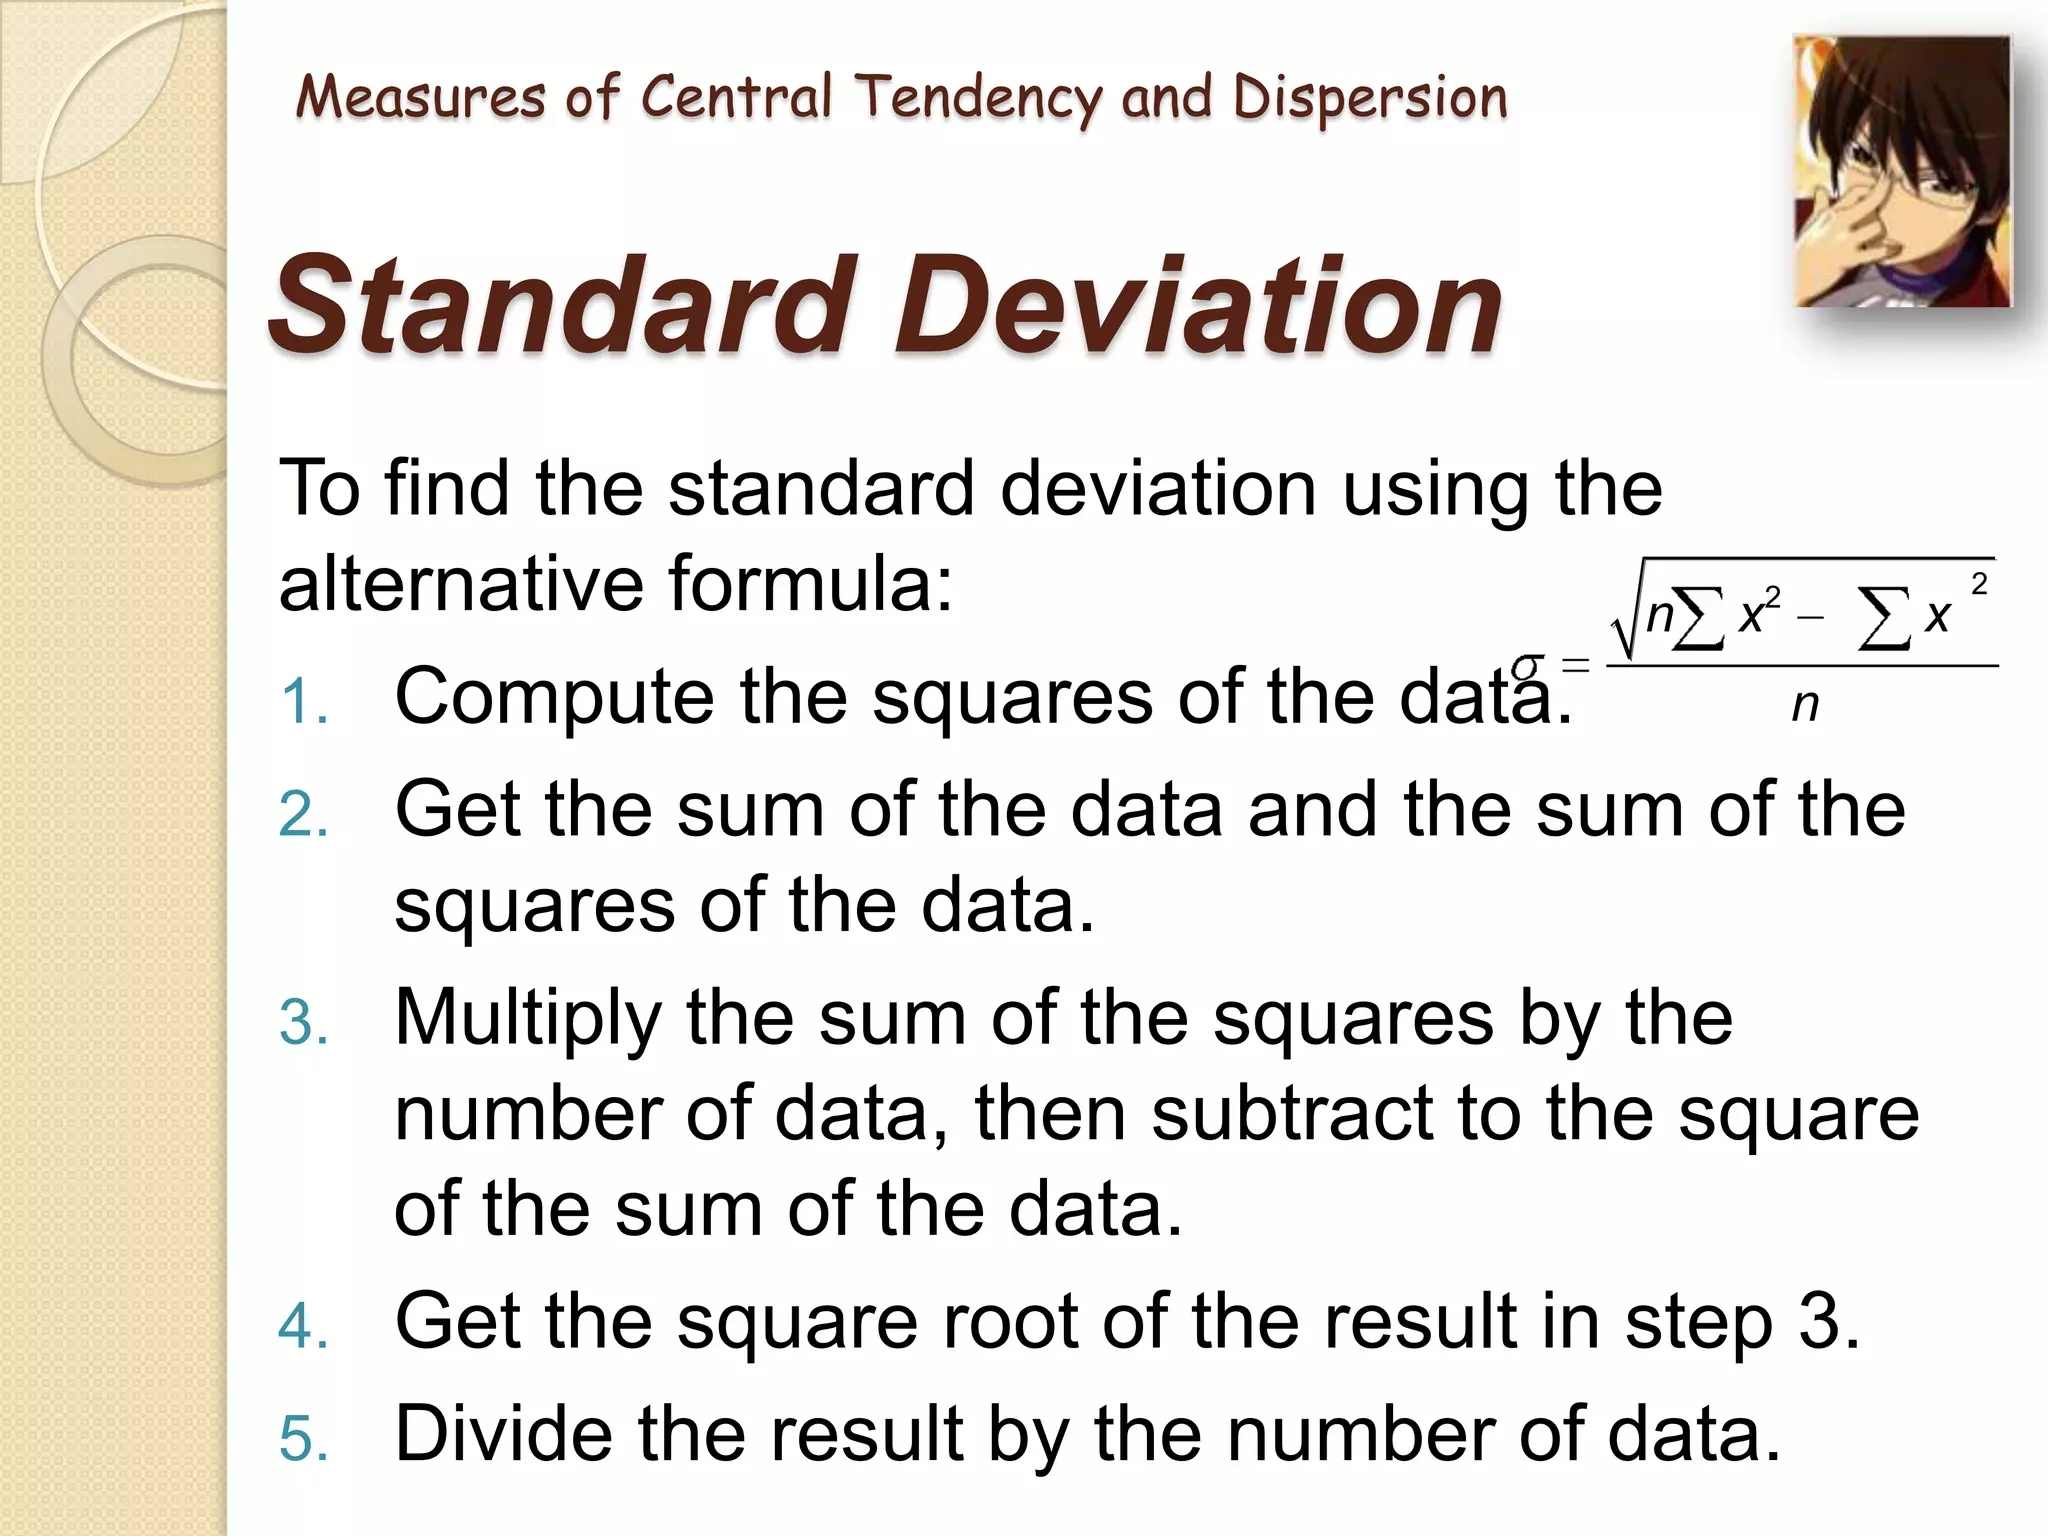
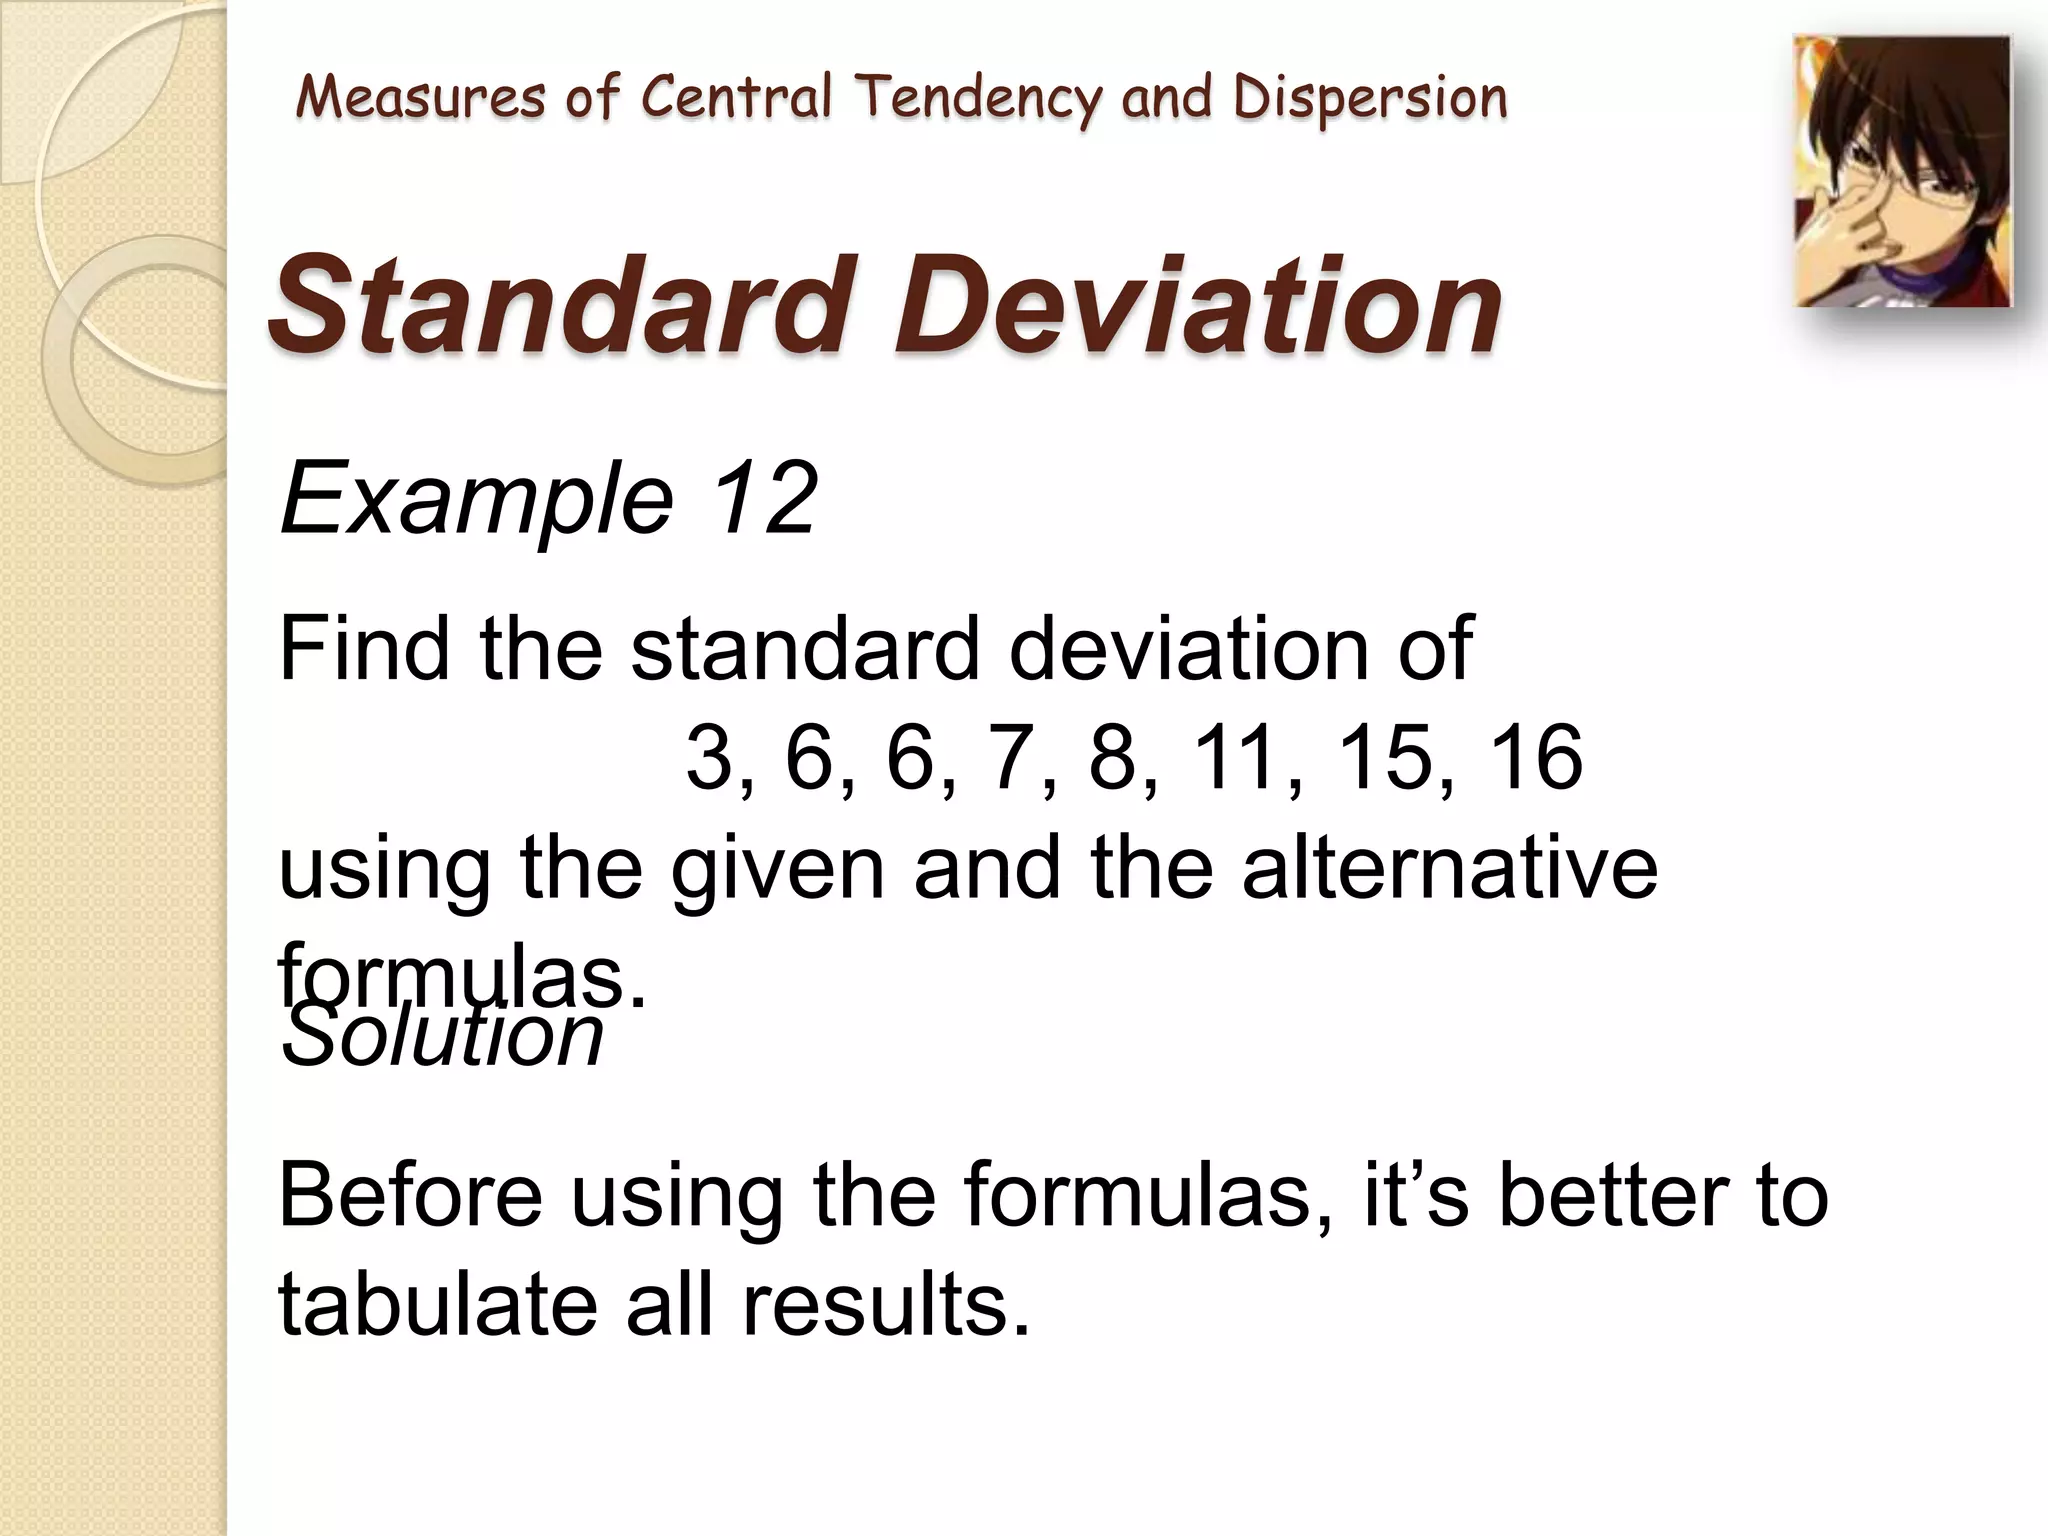
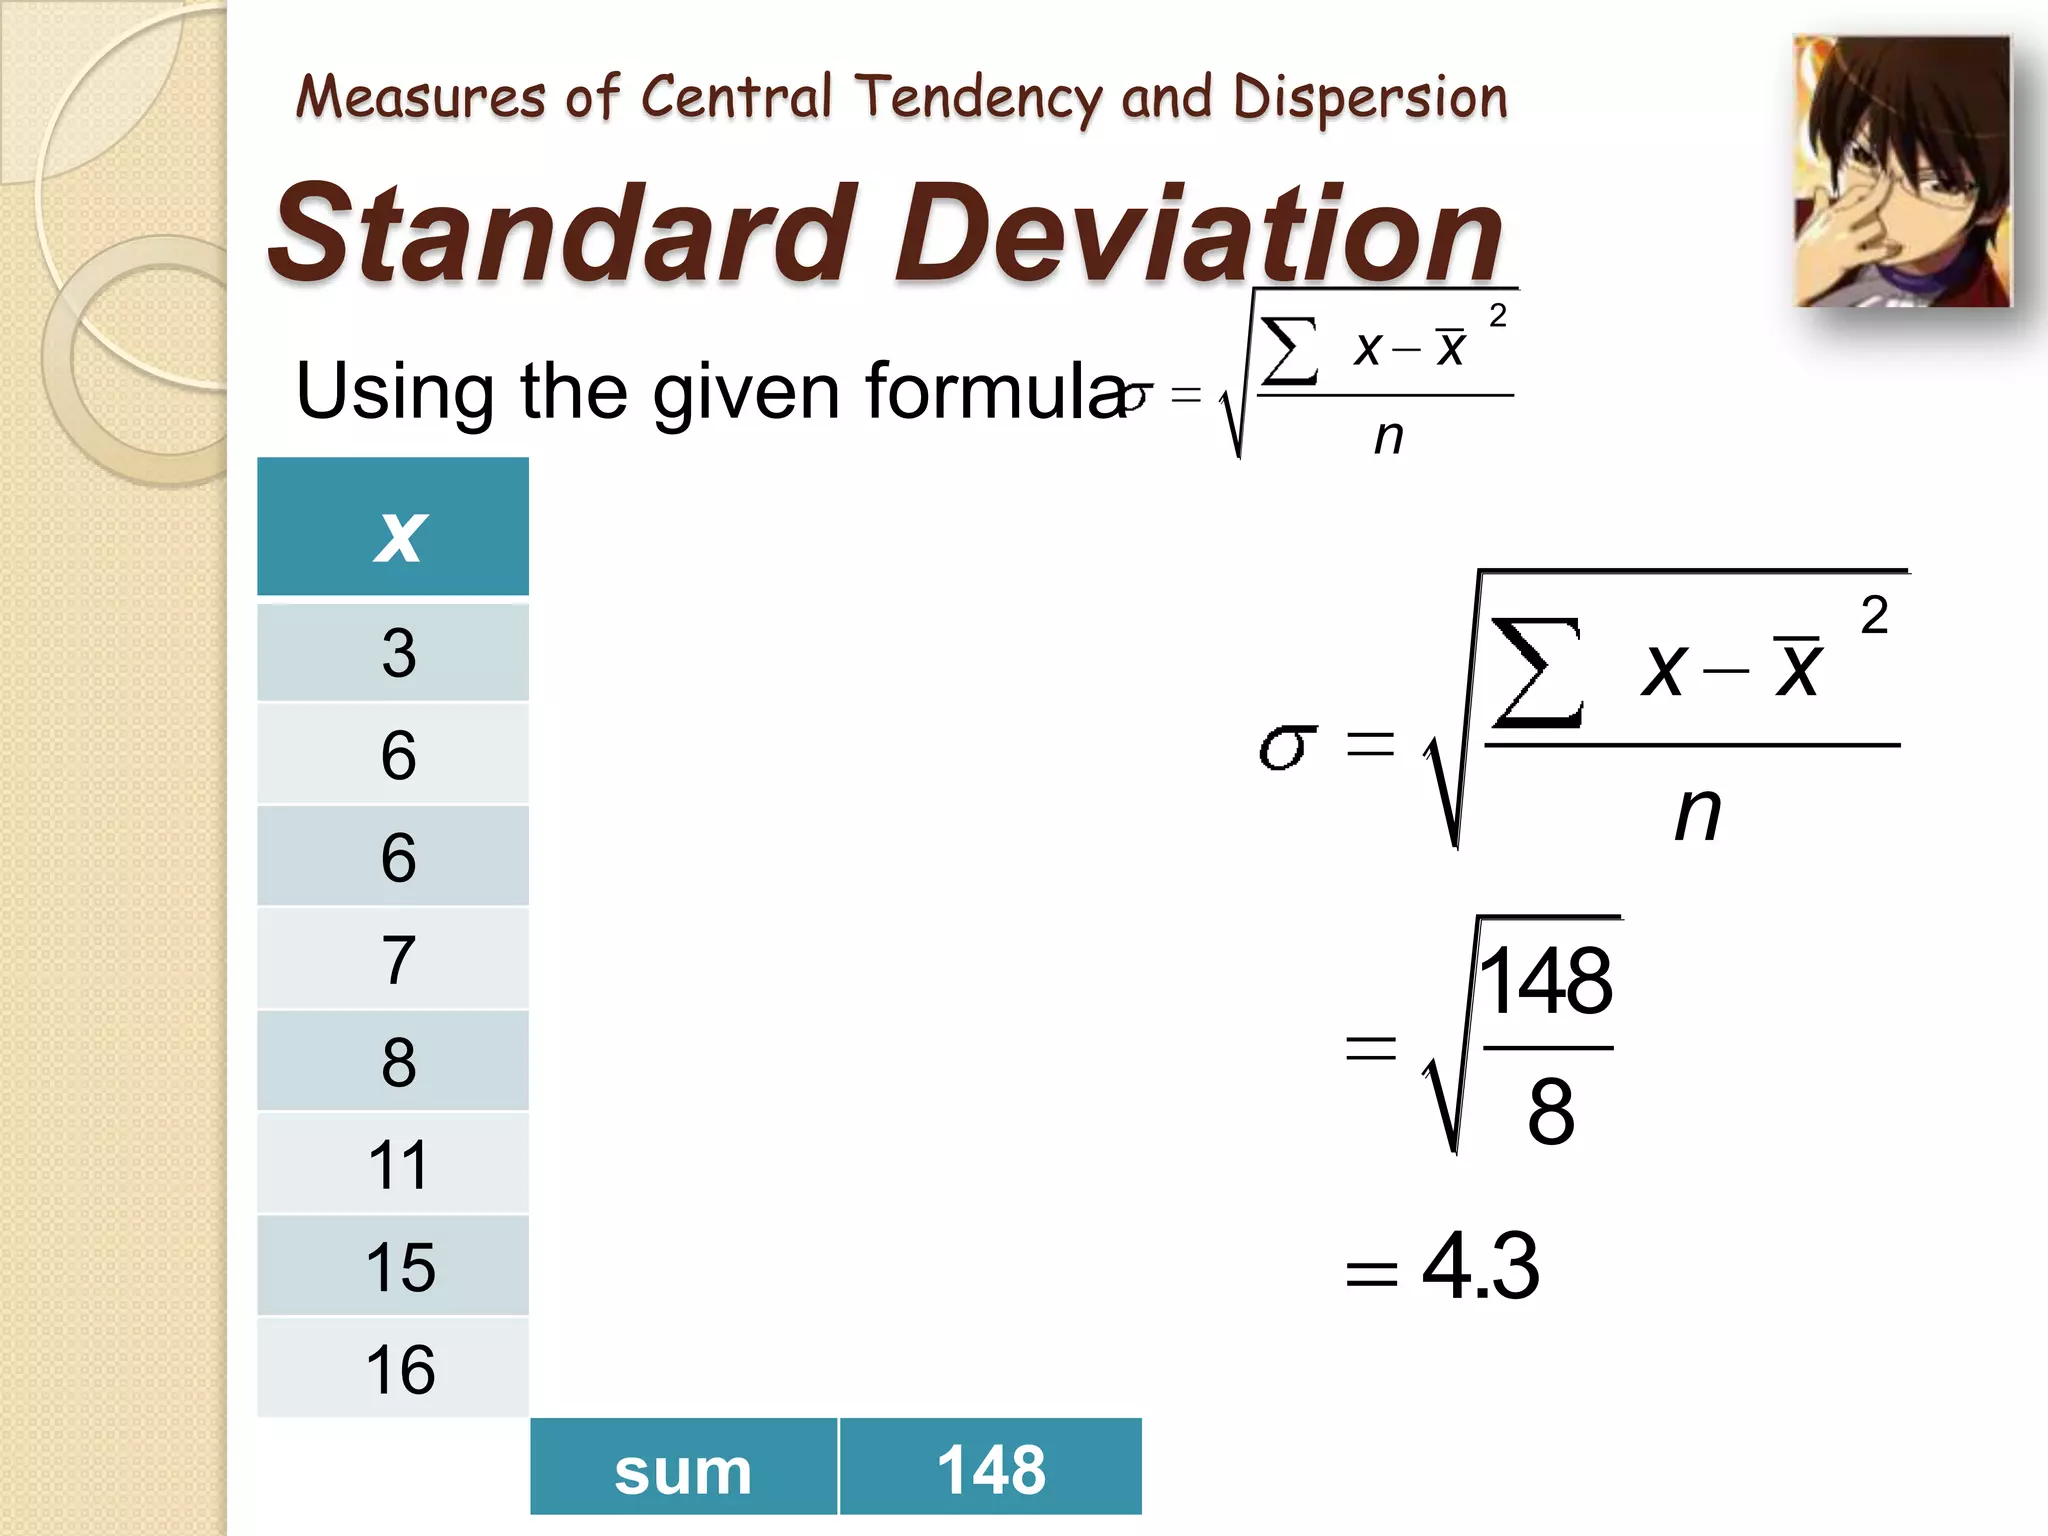
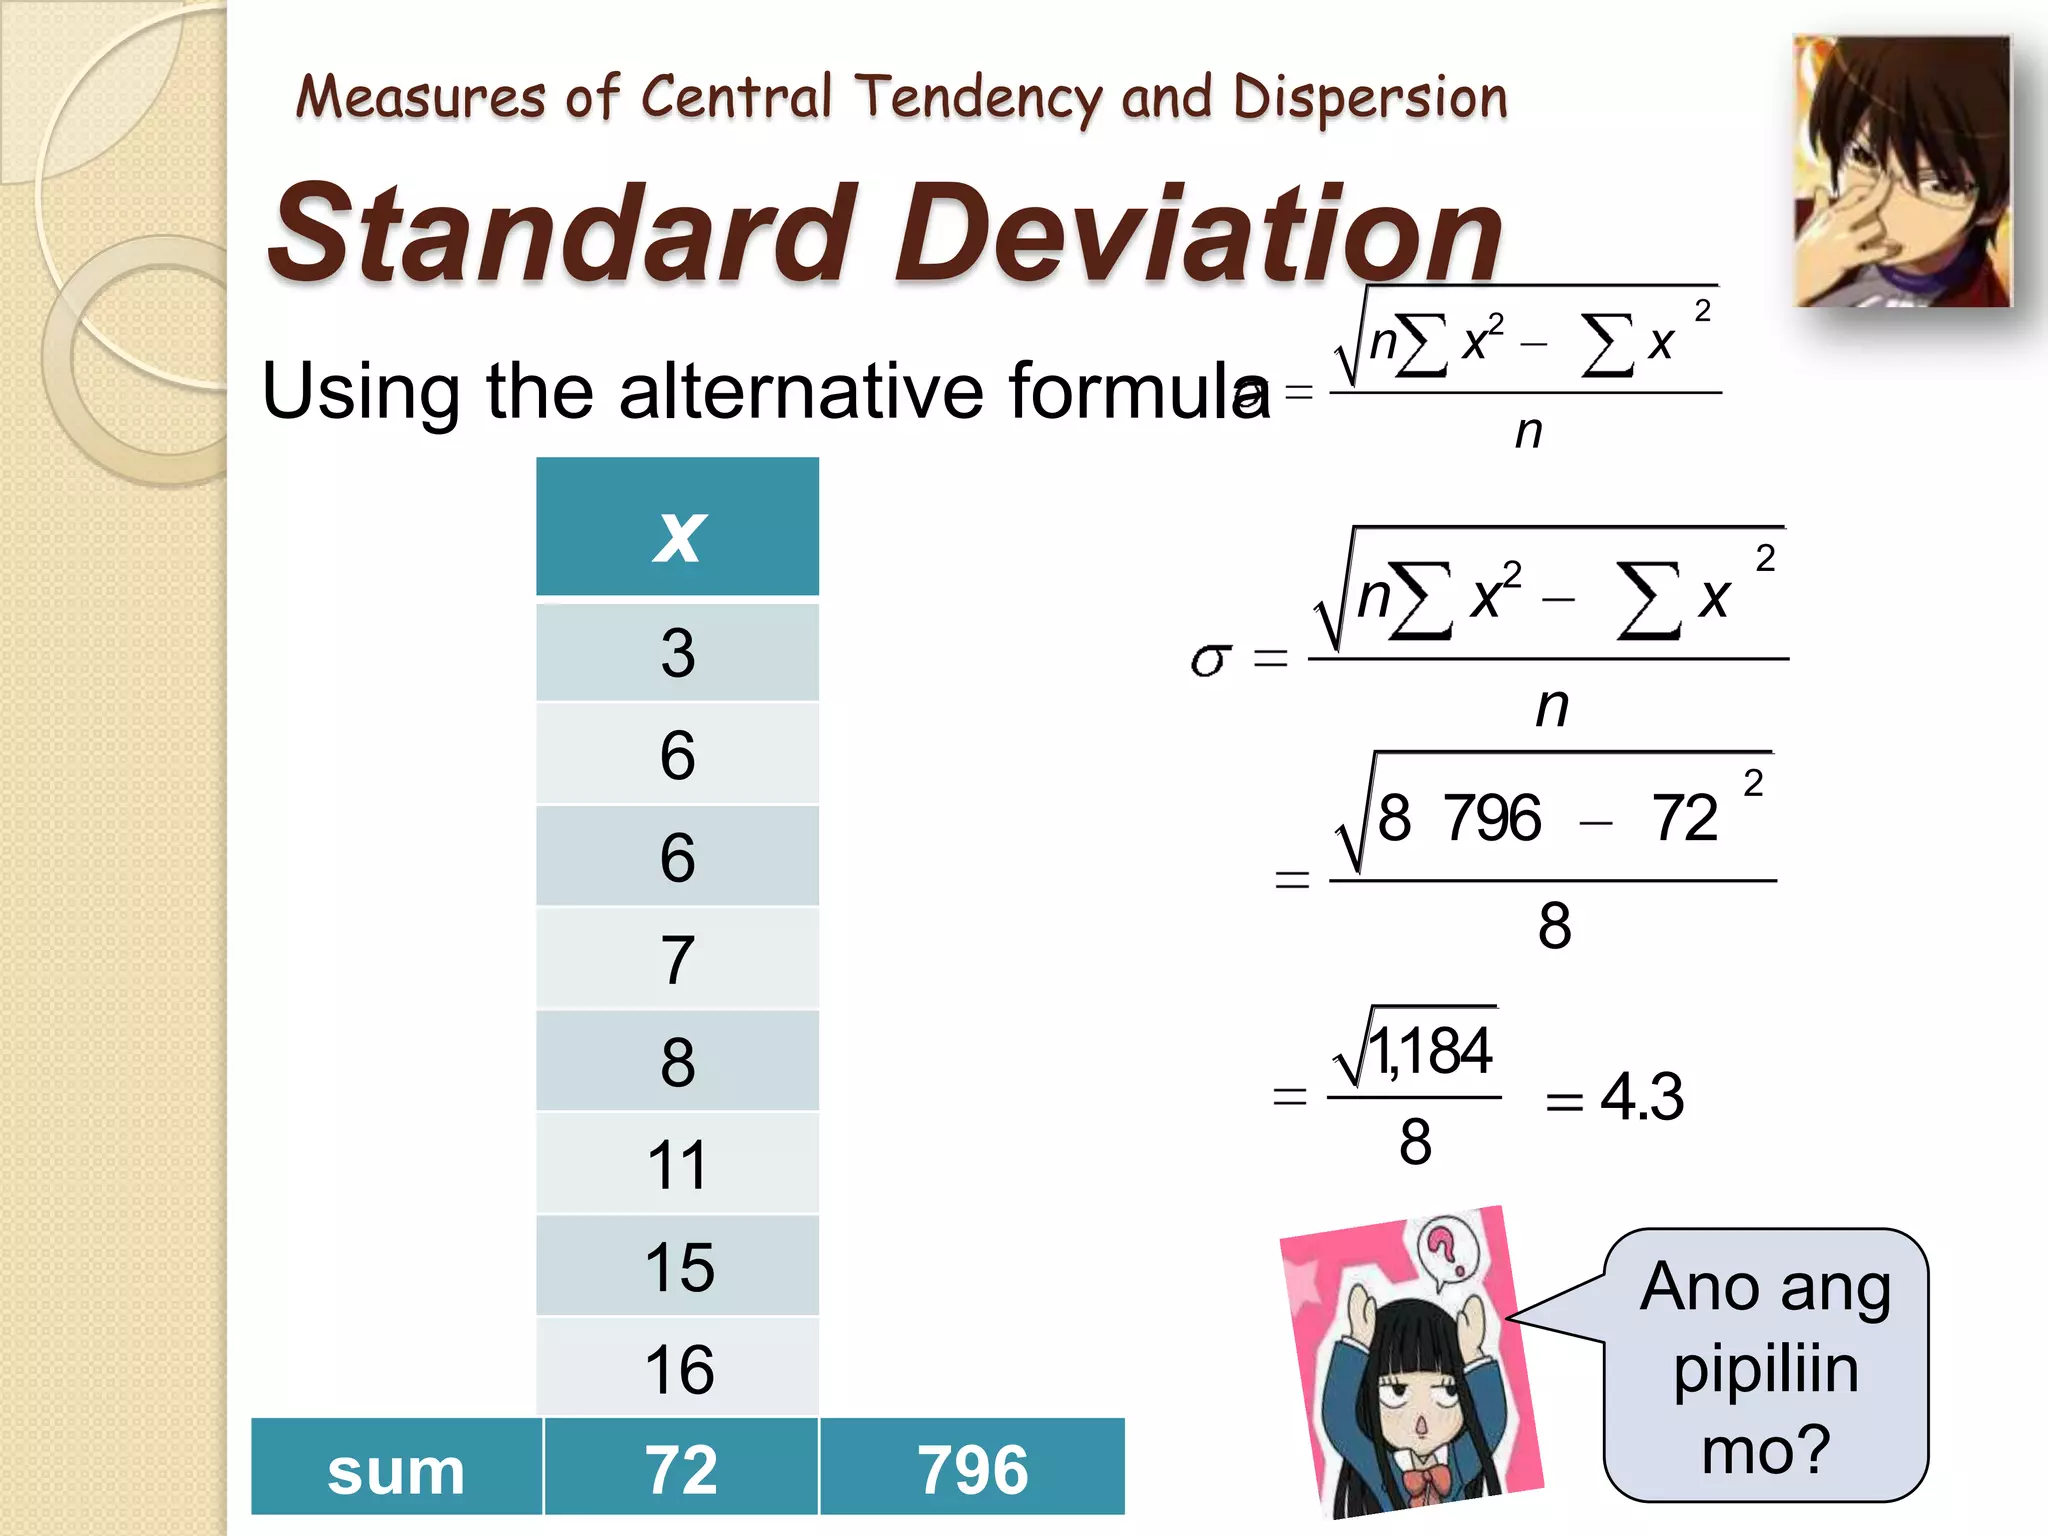
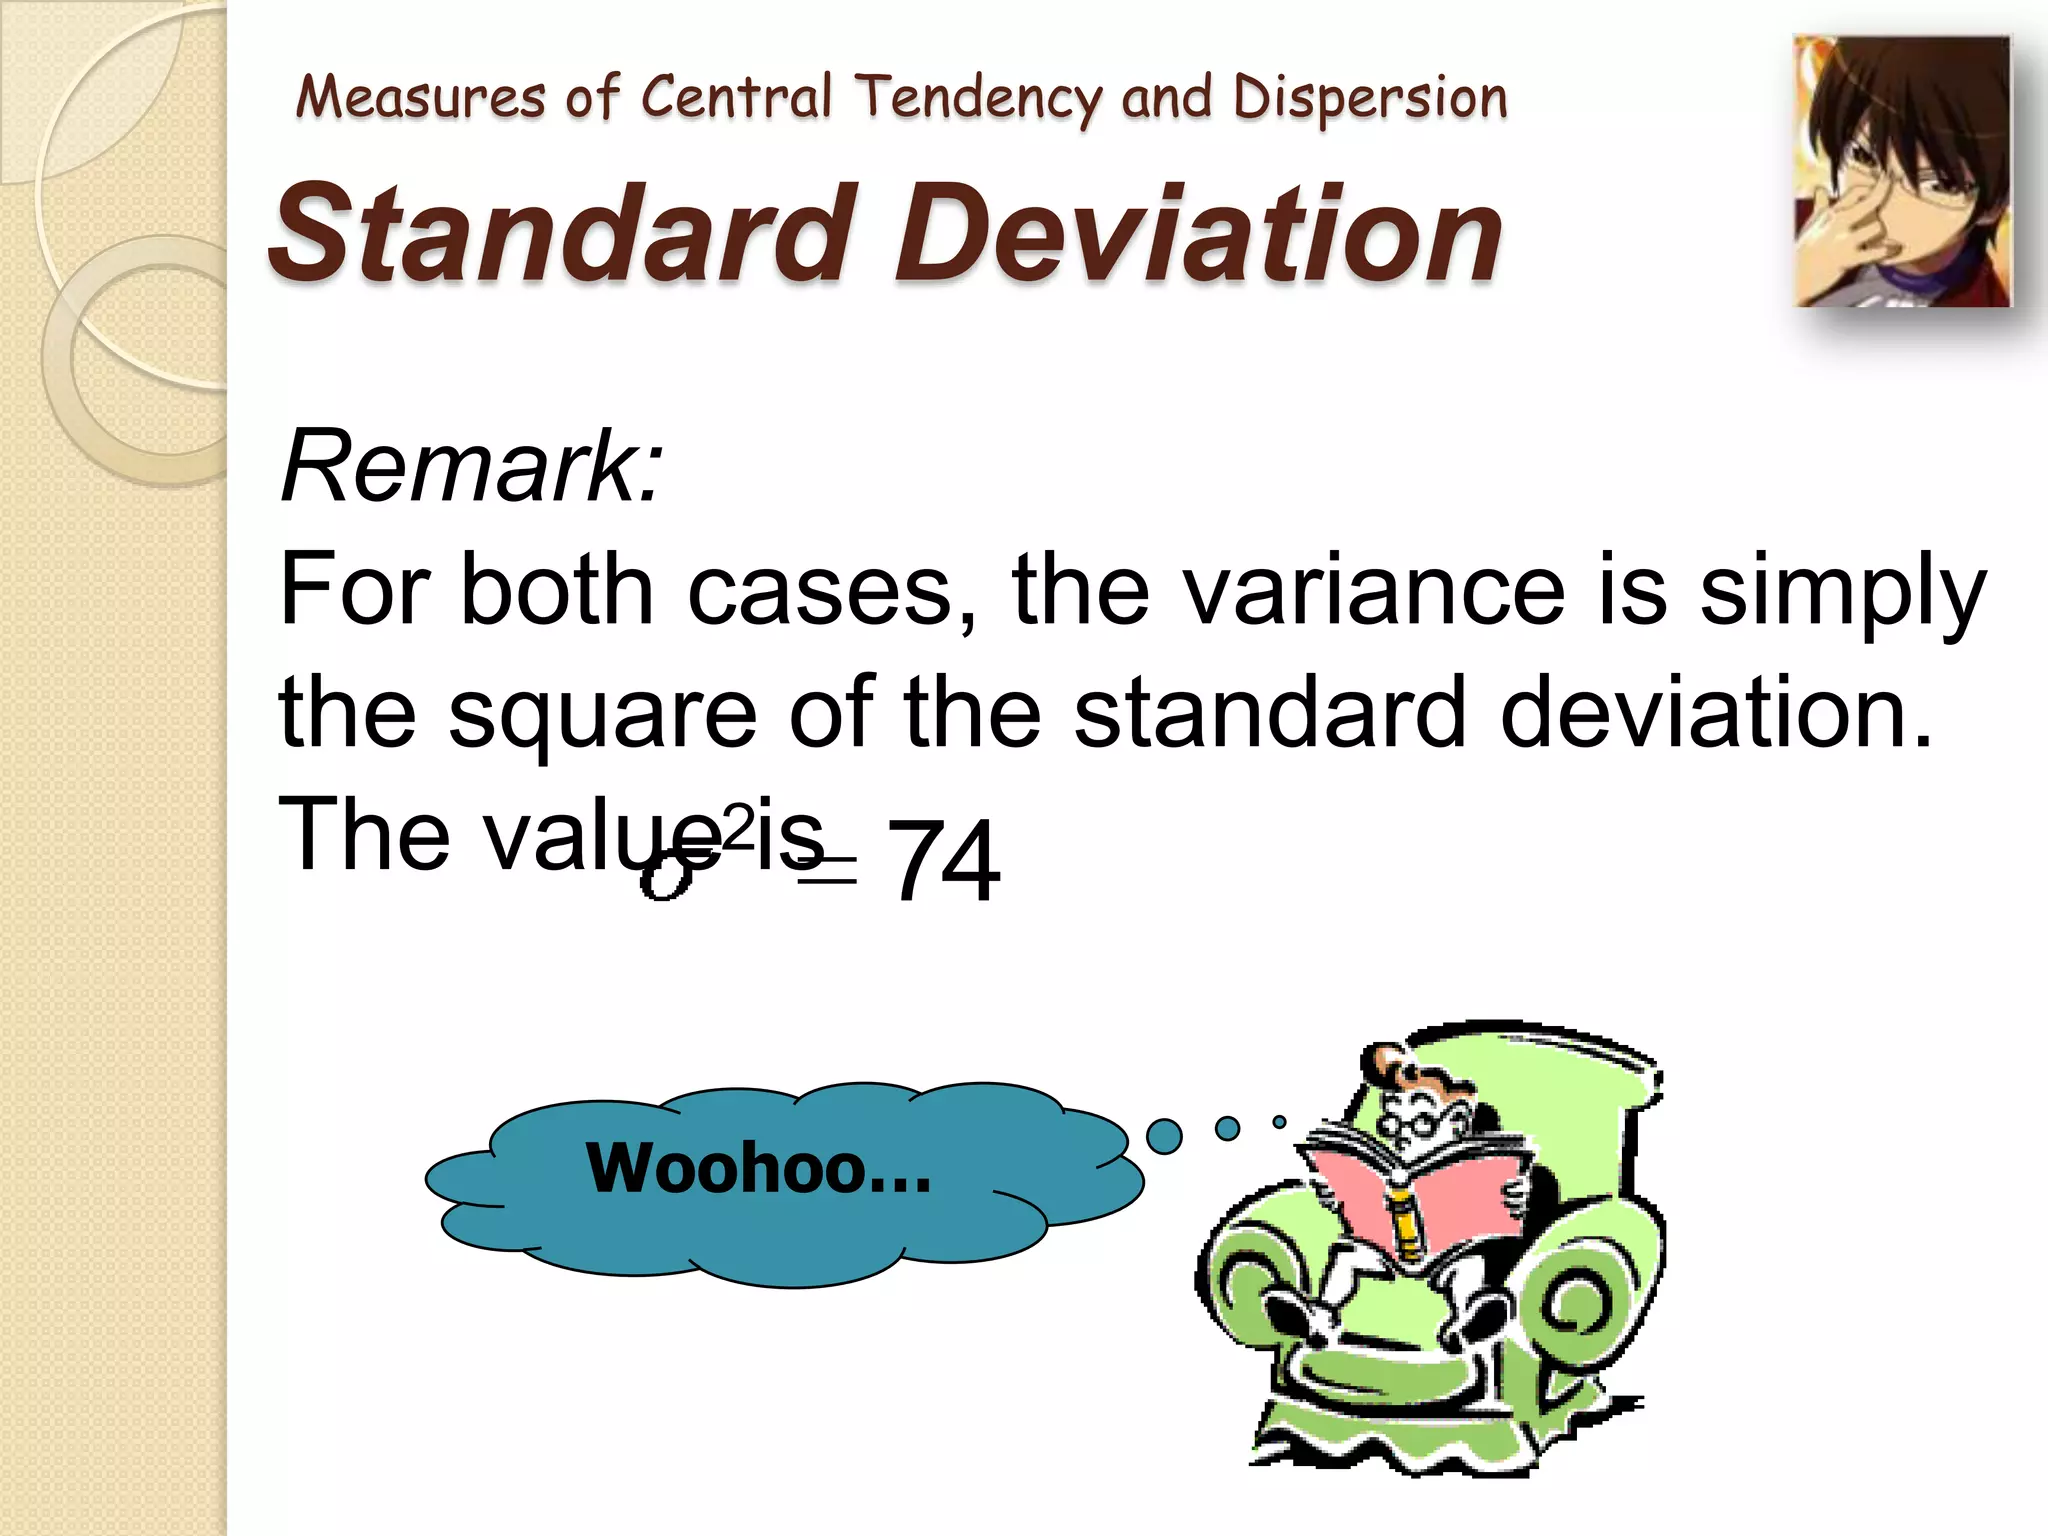
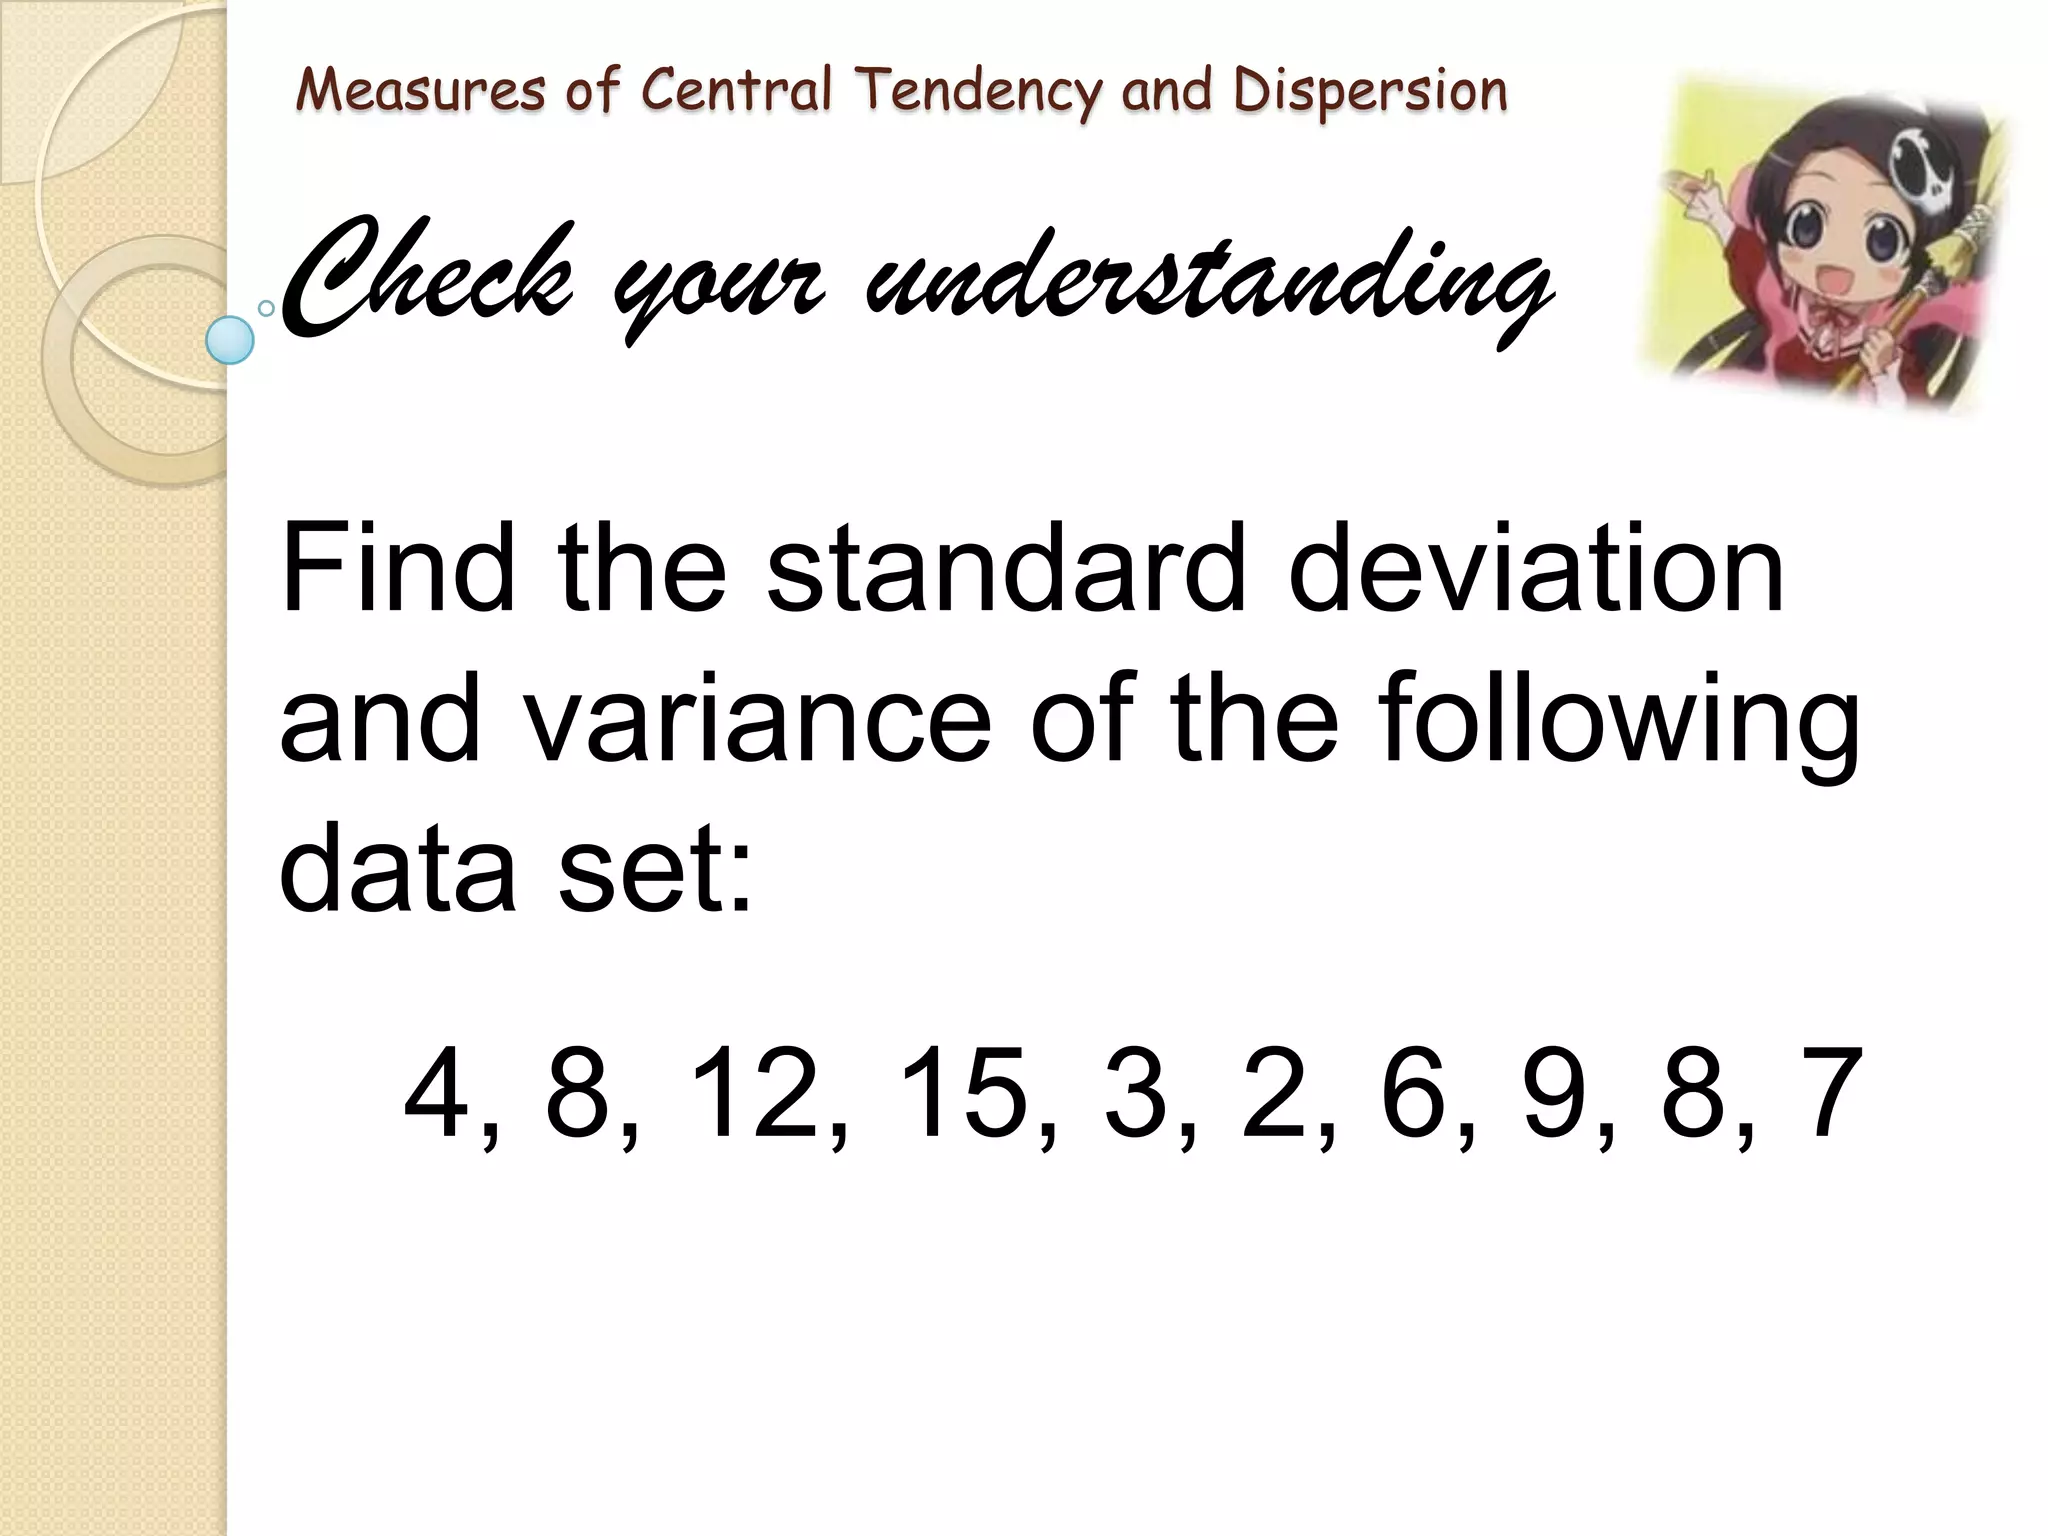


This document provides an introduction to statistics. It discusses what statistics is, the two main branches of statistics (descriptive and inferential), and the different types of data. It then describes several key measures used in statistics, including measures of central tendency (mean, median, mode) and measures of dispersion (range, mean deviation, standard deviation). The mean is the average value, the median is the middle value, and the mode is the most frequent value. The range is the difference between highest and lowest values, the mean deviation is the average distance from the mean, and the standard deviation measures how spread out values are from the mean. Examples are provided to demonstrate how to calculate each measure.