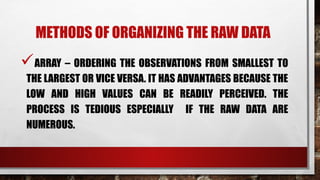
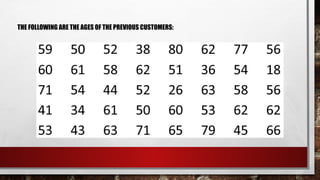
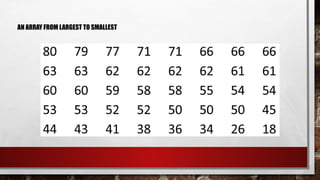
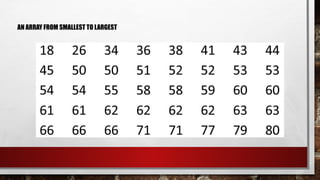
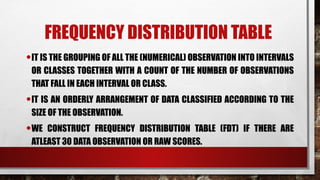
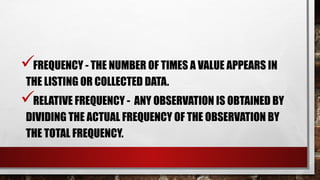
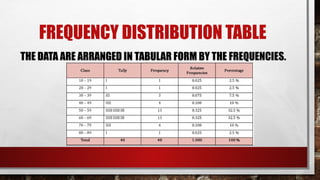
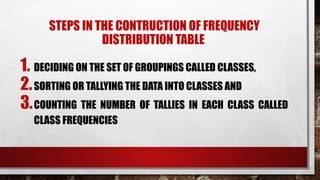
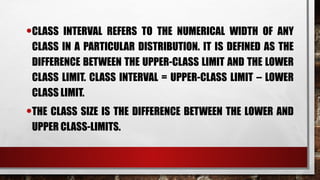
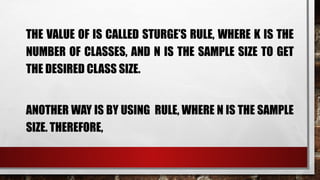
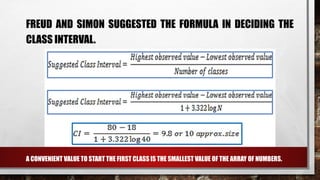
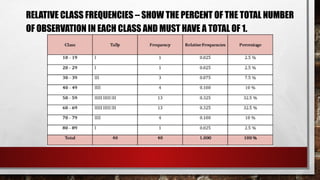
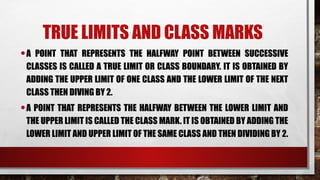
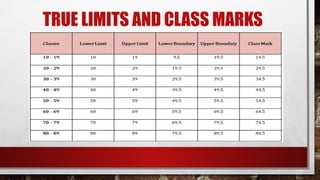
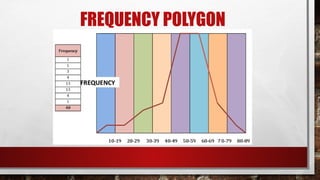
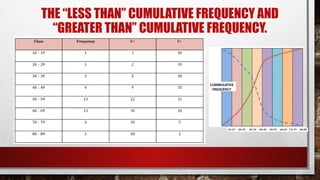
The document discusses the organization of raw data into frequency distribution tables, which group numerical observations into intervals with corresponding counts. It outlines the steps and rules for creating these tables, including class intervals, frequencies, and methods to avoid overlap and ensure equal ranges. Additionally, it introduces concepts such as relative frequency, true limits, class marks, and frequency polygons for visual representation of data.