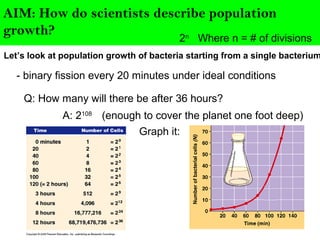
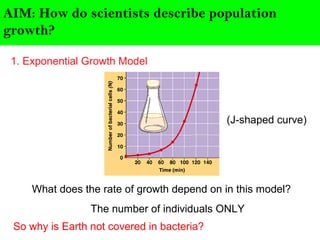
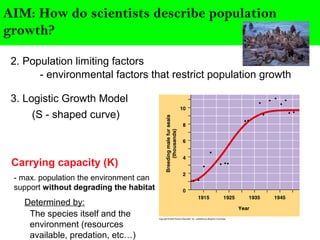
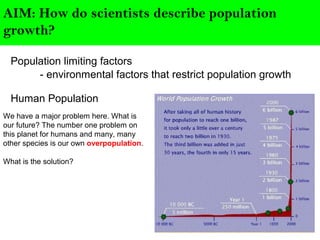
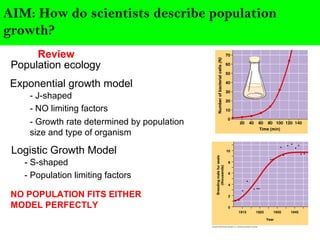
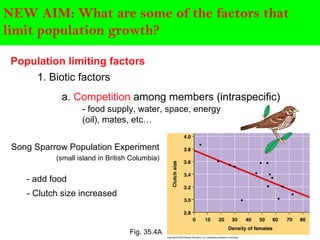
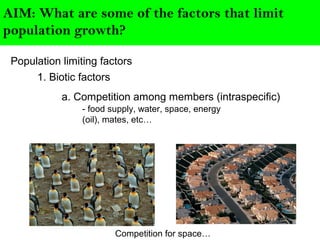
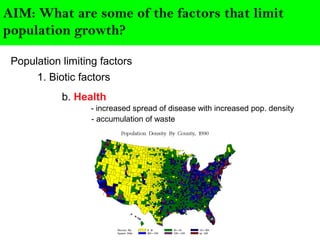
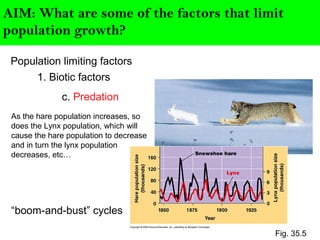
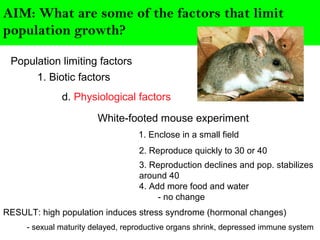
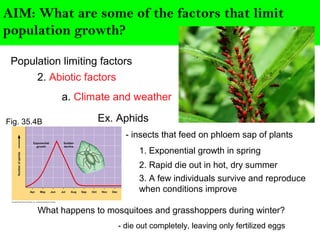
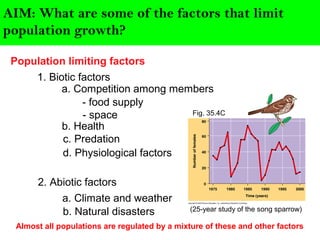
Scientists describe population growth using models like exponential and logistic growth. Exponential growth assumes unlimited resources leading to rapid growth, while logistic growth incorporates limiting factors that slow growth as the population approaches the carrying capacity. Population size is regulated by biotic factors like competition for resources, disease, predation, and physiological stress at high densities, as well as abiotic factors such as climate, weather, and natural disasters. No population perfectly fits either the exponential or logistic growth models due to the complex interplay of these limiting factors.
Exponential growth: Resource (food and space) availability is
obviously essential for the unimpeded growth of a population.
Ideally, when resources in the habitat are unlimited, each species
has the ability to realise fully its innate potential to grow in number,
as Darwin observed while developing his theory of natural
selection.
Learning targets: This presentation will help you understand:
(1) The scope of human population growth
(2) The effect of population, affluence and technology on the environment
(3) Fundamentals of demography
(4) The demographic transition
(5) Factors that affect population growth
(6) Three Technological Eras
(7) Basic Concepts of Population Growth
(8) Factors Affecting Human Population Size
(9) Factors Affecting Birth Rates and Total Fertility Rates
(10) Population Movements
(11) Population Trend Comparisons
(12) Human Population Issues
This is the 7th lesson of the course - Foundation of Environmental Management taught at the Faculty of Social Sciences and Humanities, Rajarata University of Sri Lanka
EXAM 1 STUDY GUIDE CONSIDER LECTURES UP TO 26 FEB and TEXT Bgalinagrabow44ms
EXAM 1 STUDY GUIDE
CONSIDER LECTURES UP TO 26 FEB and TEXT BOOK CHAPTERS UP THOURGH MODULE 4.1 (Through HUMAN POPULATIONS)
1.
Give a basic definition of biodiversity.
2.
Which of the following accurately reflects the connection between science, decision-making, and environmental science? a. Science and environmental science rely on evidence; good decision-making only sometimes relies on evidence.
b. Science and good decision-making rely on evidence; environmental science does not always rely on evidence.
c. Science relies on good decision-making and environmental science relies on evidence.
d. Science and good decision-making relies on evidence; environmental science relies on good decision-making.
e. Science and good decision-making rely on evidence; environmental science relies on evidence.
3.
Compare the life history strategy of a deer mouse with that of a bear, and identify each as either an r- or K-selected species.
4.
Why are tertiary information sources considered less reliable than primary and secondary sources? What is a primary source?
5.
What is an environmental footprint? How is this used to measure sustainability?
6.
Scientists have studied the impact of clear cutting forests on erosion and waterways. They know that clear cutting will cause erosion and waterways will suffer the impact of sediment loading. Evaluate the situation and choose the statement that best explains how humans may perceive the risks involved.
a. Since the chance of disaster is low humans will not have biases about this situation.
b. Although the seriousness of the impact is well known people’s judgment may still vary dramatically.
c. All people understand this situation and will work together on a solution. d. Both a and c
e. None of the above
7.
Why are some people more vulnerable to toxic substances than other people, even if exposed to the same dose?
8.
Explain how a composting toilet works. Use a diagram to explain the cycling of water and organic matter.
9.
Distinguish between chronic and acute effects cuased by exposure to toxic substances.
10.
List THREE abiotic parameters and THREE biotic parameters: ABIOTIC
1
2
3
BIOTIC
1
2
3
11.
Which of the following best describes ecosystem capital? a. mineral and living resources of the earth.
b. living organisms and other renewable resources of the earth.
c. natural resources such as forests and fisheries.
d. natural resources (goods) and services provided by ecosystems
e. ecosystem services that support life on earth
12.
Refer to the figure below to determine which country has the lowest population size but the highest density?
a. Asia
b. South Africa
c. Eastern Europe
d. Western Europe
e. Oceania
13.
List three of the things you might measure to determine your ecolo ...
ECS 111 SECTION P SPRING 2019 Dr. SEALEY STUDY GUIDE FOR .docxtidwellveronique
ECS 111 SECTION P SPRING 2019 Dr. SEALEY
STUDY GUIDE FOR EXAM ONE on 28 FEBRUARY 2019
1 | P a g e
EXAM 1 STUDY GUIDE
CONSIDER LECTURES UP TO 26 FEB and TEXT BOOK CHAPTERS UP THOURGH MODULE 4.1 (Through HUMAN POPULATIONS)
1. Give a basic definition of biodiversity.
2. Which of the following accurately reflects the connection between science, decision-making, and environmental science?
a. Science and environmental science rely on evidence; good decision-making only sometimes relies on evidence.
b. Science and good decision-making rely on evidence; environmental science does not always rely on evidence.
c. Science relies on good decision-making and environmental science relies on evidence.
d. Science and good decision-making relies on evidence; environmental science relies on good decision-making.
e. Science and good decision-making rely on evidence; environmental science relies on evidence.
3. Compare the life history strategy of a deer mouse with that of a bear, and identify each as either an r- or K-selected species.
4. Why are tertiary information sources considered less reliable than primary and secondary sources? What is a primary
source?
5. What is an environmental footprint? How is this used to measure sustainability?
6. Scientists have studied the impact of clear cutting forests on erosion and waterways. They know that clear cutting will cause
erosion and waterways will suffer the impact of sediment loading. Evaluate the situation and choose the statement that
best explains how humans may perceive the risks involved.
a. Since the chance of disaster is low humans will not have biases about this situation.
b. Although the seriousness of the impact is well known people’s judgment may still vary dramatically.
c. All people understand this situation and will work together on a solution.
d. Both a and c
e. None of the above
7. Why are some people more vulnerable to toxic substances than other people, even if exposed to the same dose?
8. Explain how a composting toilet works. Use a diagram to explain the cycling of water and organic matter.
9. Distinguish between chronic and acute effects cuased by exposure to toxic substances.
10. List THREE abiotic parameters and THREE biotic parameters:
ABIOTIC
1
2
3
BIOTIC
1
2
3
ECS 111 SECTION P SPRING 2019 Dr. SEALEY
STUDY GUIDE FOR EXAM ONE on 28 FEBRUARY 2019
2 | P a g e
11. Which of the following best describes ecosystem capital?
a. mineral and living resources of the earth.
b. living organisms and other renewable resources of the earth.
c. natural resources such as forests and fisheries.
d. natural resources (goods) and services provided by ecosystems
e. ecosystem services that support life on earth
12. Refer to the figure below to determine which country has the lowest population size but the highest density?
a. Asia
b. South Africa
c. Eastern Europe
d. Wes.
Toxic effects of heavy metals : Lead and Arsenicsanjana502982
Heavy metals are naturally occuring metallic chemical elements that have relatively high density, and are toxic at even low concentrations. All toxic metals are termed as heavy metals irrespective of their atomic mass and density, eg. arsenic, lead, mercury, cadmium, thallium, chromium, etc.
Phenomics assisted breeding in crop improvementIshaGoswami9
As the population is increasing and will reach about 9 billion upto 2050. Also due to climate change, it is difficult to meet the food requirement of such a large population. Facing the challenges presented by resource shortages, climate
change, and increasing global population, crop yield and quality need to be improved in a sustainable way over the coming decades. Genetic improvement by breeding is the best way to increase crop productivity. With the rapid progression of functional
genomics, an increasing number of crop genomes have been sequenced and dozens of genes influencing key agronomic traits have been identified. However, current genome sequence information has not been adequately exploited for understanding
the complex characteristics of multiple gene, owing to a lack of crop phenotypic data. Efficient, automatic, and accurate technologies and platforms that can capture phenotypic data that can
be linked to genomics information for crop improvement at all growth stages have become as important as genotyping. Thus,
high-throughput phenotyping has become the major bottleneck restricting crop breeding. Plant phenomics has been defined as the high-throughput, accurate acquisition and analysis of multi-dimensional phenotypes
during crop growing stages at the organism level, including the cell, tissue, organ, individual plant, plot, and field levels. With the rapid development of novel sensors, imaging technology,
and analysis methods, numerous infrastructure platforms have been developed for phenotyping.
hematic appreciation test is a psychological assessment tool used to measure an individual's appreciation and understanding of specific themes or topics. This test helps to evaluate an individual's ability to connect different ideas and concepts within a given theme, as well as their overall comprehension and interpretation skills. The results of the test can provide valuable insights into an individual's cognitive abilities, creativity, and critical thinking skills
ESR spectroscopy in liquid food and beverages.pptxPRIYANKA PATEL
With increasing population, people need to rely on packaged food stuffs. Packaging of food materials requires the preservation of food. There are various methods for the treatment of food to preserve them and irradiation treatment of food is one of them. It is the most common and the most harmless method for the food preservation as it does not alter the necessary micronutrients of food materials. Although irradiated food doesn’t cause any harm to the human health but still the quality assessment of food is required to provide consumers with necessary information about the food. ESR spectroscopy is the most sophisticated way to investigate the quality of the food and the free radicals induced during the processing of the food. ESR spin trapping technique is useful for the detection of highly unstable radicals in the food. The antioxidant capability of liquid food and beverages in mainly performed by spin trapping technique.
The use of Nauplii and metanauplii artemia in aquaculture (brine shrimp).pptxMAGOTI ERNEST
Although Artemia has been known to man for centuries, its use as a food for the culture of larval organisms apparently began only in the 1930s, when several investigators found that it made an excellent food for newly hatched fish larvae (Litvinenko et al., 2023). As aquaculture developed in the 1960s and ‘70s, the use of Artemia also became more widespread, due both to its convenience and to its nutritional value for larval organisms (Arenas-Pardo et al., 2024). The fact that Artemia dormant cysts can be stored for long periods in cans, and then used as an off-the-shelf food requiring only 24 h of incubation makes them the most convenient, least labor-intensive, live food available for aquaculture (Sorgeloos & Roubach, 2021). The nutritional value of Artemia, especially for marine organisms, is not constant, but varies both geographically and temporally. During the last decade, however, both the causes of Artemia nutritional variability and methods to improve poorquality Artemia have been identified (Loufi et al., 2024).
Brine shrimp (Artemia spp.) are used in marine aquaculture worldwide. Annually, more than 2,000 metric tons of dry cysts are used for cultivation of fish, crustacean, and shellfish larva. Brine shrimp are important to aquaculture because newly hatched brine shrimp nauplii (larvae) provide a food source for many fish fry (Mozanzadeh et al., 2021). Culture and harvesting of brine shrimp eggs represents another aspect of the aquaculture industry. Nauplii and metanauplii of Artemia, commonly known as brine shrimp, play a crucial role in aquaculture due to their nutritional value and suitability as live feed for many aquatic species, particularly in larval stages (Sorgeloos & Roubach, 2021).
Seminar of U.V. Spectroscopy by SAMIR PANDASAMIR PANDA
Spectroscopy is a branch of science dealing the study of interaction of electromagnetic radiation with matter.
Ultraviolet-visible spectroscopy refers to absorption spectroscopy or reflect spectroscopy in the UV-VIS spectral region.
Ultraviolet-visible spectroscopy is an analytical method that can measure the amount of light received by the analyte.
ISI 2024: Application Form (Extended), Exam Date (Out), EligibilitySciAstra
The Indian Statistical Institute (ISI) has extended its application deadline for 2024 admissions to April 2. Known for its excellence in statistics and related fields, ISI offers a range of programs from Bachelor's to Junior Research Fellowships. The admission test is scheduled for May 12, 2024. Eligibility varies by program, generally requiring a background in Mathematics and English for undergraduate courses and specific degrees for postgraduate and research positions. Application fees are ₹1500 for male general category applicants and ₹1000 for females. Applications are open to Indian and OCI candidates.
Earliest Galaxies in the JADES Origins Field: Luminosity Function and Cosmic ...Sérgio Sacani
We characterize the earliest galaxy population in the JADES Origins Field (JOF), the deepest
imaging field observed with JWST. We make use of the ancillary Hubble optical images (5 filters
spanning 0.4−0.9µm) and novel JWST images with 14 filters spanning 0.8−5µm, including 7 mediumband filters, and reaching total exposure times of up to 46 hours per filter. We combine all our data
at > 2.3µm to construct an ultradeep image, reaching as deep as ≈ 31.4 AB mag in the stack and
30.3-31.0 AB mag (5σ, r = 0.1” circular aperture) in individual filters. We measure photometric
redshifts and use robust selection criteria to identify a sample of eight galaxy candidates at redshifts
z = 11.5 − 15. These objects show compact half-light radii of R1/2 ∼ 50 − 200pc, stellar masses of
M⋆ ∼ 107−108M⊙, and star-formation rates of SFR ∼ 0.1−1 M⊙ yr−1
. Our search finds no candidates
at 15 < z < 20, placing upper limits at these redshifts. We develop a forward modeling approach to
infer the properties of the evolving luminosity function without binning in redshift or luminosity that
marginalizes over the photometric redshift uncertainty of our candidate galaxies and incorporates the
impact of non-detections. We find a z = 12 luminosity function in good agreement with prior results,
and that the luminosity function normalization and UV luminosity density decline by a factor of ∼ 2.5
from z = 12 to z = 14. We discuss the possible implications of our results in the context of theoretical
models for evolution of the dark matter halo mass function.
Nutraceutical market, scope and growth: Herbal drug technologyLokesh Patil
As consumer awareness of health and wellness rises, the nutraceutical market—which includes goods like functional meals, drinks, and dietary supplements that provide health advantages beyond basic nutrition—is growing significantly. As healthcare expenses rise, the population ages, and people want natural and preventative health solutions more and more, this industry is increasing quickly. Further driving market expansion are product formulation innovations and the use of cutting-edge technology for customized nutrition. With its worldwide reach, the nutraceutical industry is expected to keep growing and provide significant chances for research and investment in a number of categories, including vitamins, minerals, probiotics, and herbal supplements.
Travis Hills' Endeavors in Minnesota: Fostering Environmental and Economic Pr...Travis Hills MN
Travis Hills of Minnesota developed a method to convert waste into high-value dry fertilizer, significantly enriching soil quality. By providing farmers with a valuable resource derived from waste, Travis Hills helps enhance farm profitability while promoting environmental stewardship. Travis Hills' sustainable practices lead to cost savings and increased revenue for farmers by improving resource efficiency and reducing waste.
Remote Sensing and Computational, Evolutionary, Supercomputing, and Intellige...University of Maribor
Slides from talk:
Aleš Zamuda: Remote Sensing and Computational, Evolutionary, Supercomputing, and Intelligent Systems.
11th International Conference on Electrical, Electronics and Computer Engineering (IcETRAN), Niš, 3-6 June 2024
Inter-Society Networking Panel GRSS/MTT-S/CIS Panel Session: Promoting Connection and Cooperation
https://www.etran.rs/2024/en/home-english/
2. NEW AIM: How do scientists describe population
growth?
Population Ecology
- The study of changes in population size and the factors that
regulate it.
Population
- group of individuals of a single species that occupy the
same general area
1. Rely on same resources
2. Influenced by the same biotic and abiotic factors
3. High likelihood of interbreeding
3. AIM: How do scientists describe population
growth?
Let’s look at population growth of bacteria starting from a single bacterium
- binary fission every 20 minutes under ideal conditions
Q: How many will there be after 36 hours?
4. AIM: How do scientists describe population
growth?
Let’s look at population growth of bacteria starting from a single bacterium
- binary fission every 20 minutes under ideal conditions
Graph it:
Q: How many will there be after 36 hours?
A: 2108
(enough to cover the planet one foot deep)
2n
Where n = # of divisions
5. AIM: How do scientists describe population
growth?
1. Exponential Growth Model
(J-shaped curve)
What does the rate of growth depend on in this model?
The number of individuals ONLY
So why is Earth not covered in bacteria?
6. AIM: How do scientists describe population
growth?
2. Population limiting factors
- environmental factors that restrict population growth
Ex. Fur seals on St. Paul Island
7. AIM: How do scientists describe population
growth?
2. Population limiting factors
- environmental factors that restrict population growth
Ex. Fur seals on St. Paul Island
1. Uncontrolled hunting until 1925
2. Population jumped until 1935
- Almost exponential
3. Population stabilized
- Some hunting
- limited breeding grounds
8. AIM: How do scientists describe population
growth?
2. Population limiting factors
- environmental factors that restrict population growth
3. Logistic Growth Model
(S - shaped curve)
Q: How does the logistic model
differ from the exponential model?
9. AIM: How do scientists describe population
growth?
2. Population limiting factors
- environmental factors that restrict population growth
3. Logistic Growth Model
(S - shaped curve)
Q: How does the logistic model
differ from the exponential model?
A: It accounts for limiting factors
in the environment
10. AIM: How do scientists describe population
growth?
2. Population limiting factors
- environmental factors that restrict population growth
3. Logistic Growth Model
(S - shaped curve)
Carrying capacity (K)
- max. population the environment can
support without degrading the habitat
Determined by:
The species itself and the
environment (resources
available, predation, etc…)
11. AIM: How do scientists describe population
growth?
- environmental factors that restrict population growth
When is growth rate the lowest?
When is it the highest?
NO POPULATION FITS EITHER
MODEL PERFECTLY
1. When population is small or large
Limited number of individuals
and then limited resources
1. Population at intermediate level
relative to carrying capacity.
2. Plenty of resources
2. Population limiting factors
3. Logistic Growth Model
12. AIM: How do scientists describe population
growth?
Population limiting factors
- environmental factors that restrict population growth
Human Population
We have a major problem here. What is
our future? The number one problem on
this planet for humans and many, many
other species is our own overpopulation.
What is the solution?
13. AIM: How do scientists describe population
growth?
Population ecology
Exponential growth model
Logistic Growth Model
- S-shaped
- NO limiting factors
Review
- Growth rate determined by population
size and type of organism
- J-shaped
- Population limiting factors
NO POPULATION FITS EITHER
MODEL PERFECTLY
14. AIM: How do scientists describe population
growth?
Let’s look at some specific population limiting factors and examples.
15. NEW AIM: What are some of the factors that
limit population growth?
Population limiting factors
1. Biotic factors
a. Competition among members (intraspecific)
Song Sparrow Population Experiment
(small island in British Columbia)
Fig. 35.4A
- add food
- Clutch size increased
- food supply, water, space, energy
(oil), mates, etc…
16. AIM: What are some of the factors that limit
population growth?
Population limiting factors
1. Biotic factors
a. Competition among members (intraspecific)
- food supply, water, space, energy
(oil), mates, etc…
Competition for space…
17. AIM: What are some of the factors that limit
population growth?
Population limiting factors
1. Biotic factors
a. Competition among members (intraspecific)
i. food supply
ii. space (territory)
A. Dispersion patterns
1. clumped
2. uniform
3. random
18. AIM: What are some of the factors that limit
population growth?
Dispersion patterns
19. AIM: What are some of the factors that limit
population growth?
Population limiting factors
1. Biotic factors
b. Health
- increased spread of disease with increased pop. density
- accumulation of waste
20. AIM: What are some of the factors that limit
population growth?
Population limiting factors
1. Biotic factors
c. Predation
Fig. 35.5
“boom-and-bust” cycles
As the hare population increases, so
does the Lynx population, which will
cause the hare population to decrease
and in turn the lynx population
decreases, etc…
21. AIM: What are some of the factors that limit
population growth?
Population limiting factors
1. Biotic factors
d. Physiological factors
White-footed mouse experiment
1. Enclose in a small field
2. Reproduce quickly to 30 or 40
3. Reproduction declines and pop. stabilizes
around 40
4. Add more food and water
- no change
RESULT: high population induces stress syndrome (hormonal changes)
- sexual maturity delayed, reproductive organs shrink, depressed immune system
22. AIM: What are some of the factors that limit
population growth?
Population limiting factors
2. Abiotic factors
a. Climate and weather
Ex. Aphids
- insects that feed on phloem sap of plants
1. Exponential growth in spring
2. Rapid die out in hot, dry summer
3. A few individuals survive and reproduce
when conditions improve
What happens to mosquitoes and grasshoppers during winter?
- die out completely, leaving only fertilized eggs
Fig. 35.4B
23. AIM: What are some of the factors that limit
population growth?
Population limiting factors
2. Abiotic factors
b. Fire, flood, etc…
24. AIM: What are some of the factors that limit
population growth?
Population limiting factors
1. Biotic factors
a. Competition among members
- food supply
- space
b. Health
c. Predation
d. Physiological factors
2. Abiotic factors
a. Climate and weather
b. Natural disasters
Almost all populations are regulated by a mixture of these and other factors
(25-year study of the song sparrow)
Fig. 35.4C
Editor's Notes
A logistic function or logistic curve is the most common sigmoid curve. It models the &quot;S-shaped&quot; curve (abbreviated S-curve) of growth of some set[1] P, where P might be thought of as population. The initial stage of growth is approximately exponential; then, as saturation begins, the growth slows, and at maturity, growth stops.
Clutch size = # of eggs laid
Hare cycles - food shortage from overgrazing, predator-prey,
Range - North East US to SW near Mexico
Food - fruit skins, insects, insect larva