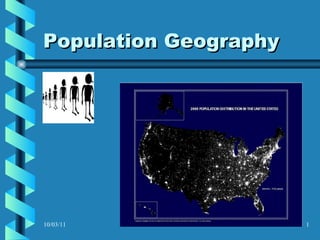
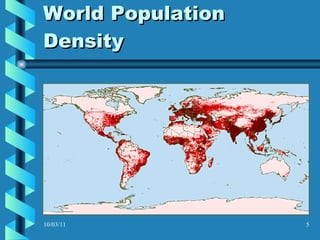
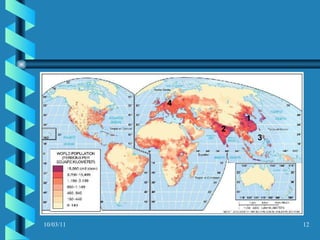
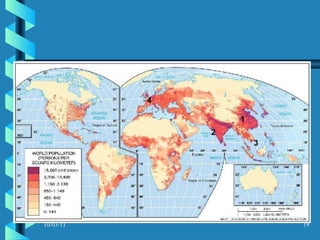
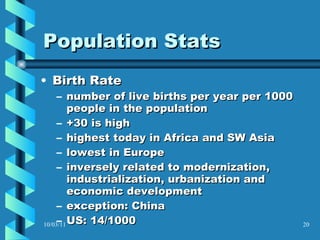
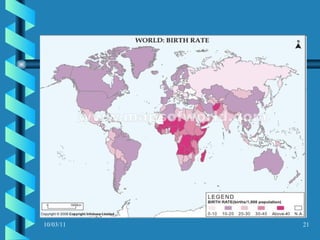
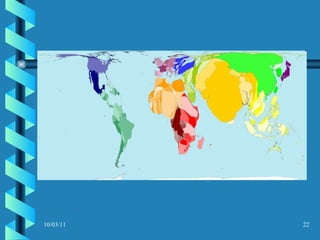
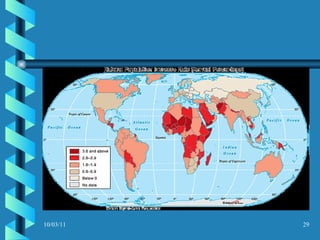
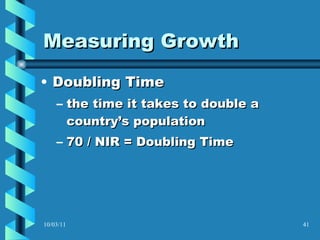
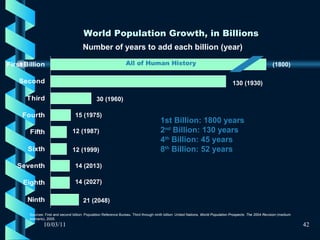
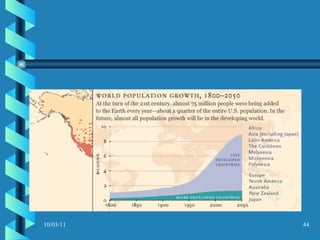
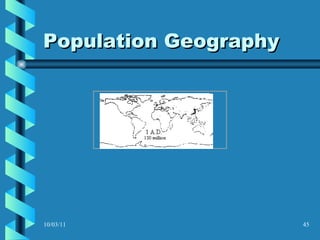
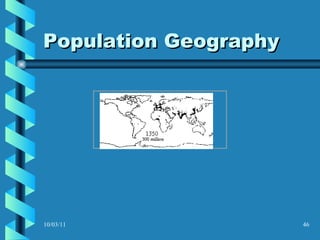
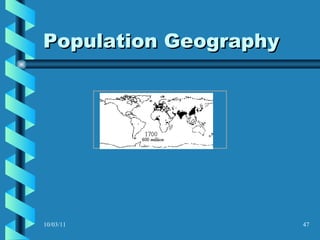
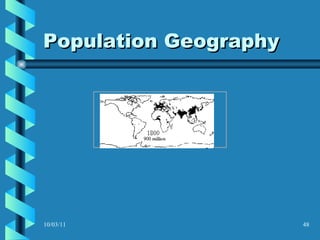
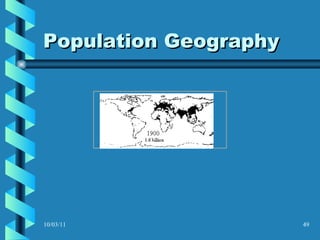
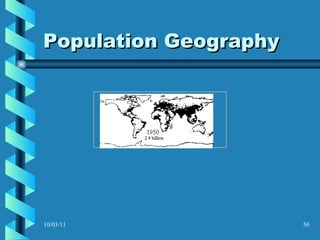
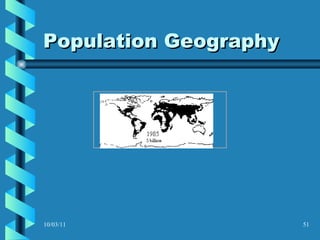
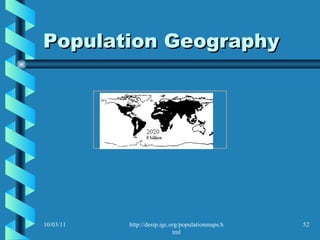
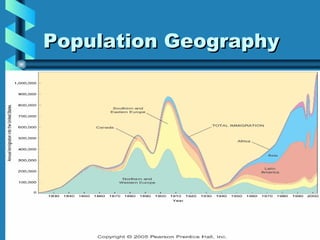
Population Geography 10/03/11
Population Geography: Essential Questions Where  is the world's population distributed?  Where  has the world's population increased?  Why  is population increasing at different rates in different countries?  Why  might the world face an overpopulation problem? 10/03/11
Population Geography Density refers to the frequency with which something occurs Distribution refers to the arrangement of a feature in space 10/03/11
Population Density a measure of the number of people per unit area of land arithmetic: people per unit area of land physiologic: people supported by  arable land agricultural: farmers to amount of arable land 10/03/11
World Population Density 10/03/11
United States Density 10/03/11
China 10/03/11
Population Distribution describes the locations on the Earth’s surface where people live  Australia Egypt Mexico Canada 10/03/11
Bangladesh Population: 144,000,000 Area: 144,000 sq miles 62% arable land (89,280 sq miles) physiologic density=1612 people per square mile of arable land 10/03/11
Montana/United States Montana Population: 145,000 Area: 902,195 square miles 18% arable land = 162,395 square miles Physiologic density = 1119 per square mile US Population: 300,000,000 Area: 3,717,810 square miles 19% arable land = 706,383 square miles Physiologic density = 424 per square mile 10/03/11
World Population Concentrations East Asia South Asia Southeast Asia Europe 10/03/11 In the three Asian clusters, more than ½ the world’s population lives on less than 10% of the world’s land.
10/03/11 4 1 3 2
East Asia China, Korea, Japan, Taiwan 1/5 the world’s total population 5/6 of the region’s population live in China, mostly river and coastal regions 2/3 of people in China live as farmers in rural areas  In Japan and Korean Peninsula, ¾+ live in urban areas and work in industry and service 10/03/11
South Asia India, Pakistan, Bangladesh, Sri Lanka  1/5 the world’s population most are rural farmers (3/4), not city dwellers  centered along Ganges and Indus river valleys, lowlands and coastal areas restrained by mountains 10/03/11
Southeast Asia Indonesia, Papua New Guinea, Philippines Island nations in the Pacific Around river valleys and deltas  10/03/11
Europe Britain, Germany, Poland, Ukraine, Belarus, France, N Italy  ¾ live in cities Less than 20% are farmers Highest concentration near coal fields 10/03/11
Subordinate Regions Eastern US Bosnywash, Chicago, Detroit, Cleveland, California  In Europe and North America, cities and towns more densely populated that rural areas Megalopolis 10/03/11
Subordinate Regions Western Africa Nigeria most populous African country 10/03/11
10/03/11 4 1 3 2
Population Stats Birth Rate number of live births per year per 1000 people in the population +30 is high highest today in Africa and SW Asia lowest in Europe inversely related to modernization, industrialization, urbanization and economic development exception: China US: 14/1000 10/03/11
10/03/11
10/03/11
Population Stats Death Rate number of deaths per thousand people in a given year highest in tropical Africa lowest in N America, S America, Europe, Japan, Australia high CDR’s tend to reflect high infant mortality US: 8/1000 10/03/11
10/03/11
10/03/11
Population Stats Natural Increase difference between number of births and deaths during a specific time period US: .88% 10/03/11 Natural  Increase
10/03/11
10/03/11
10/03/11
Population Stats Total Fertility Rate the number of children born to women of child bearing age 15-45 ?? 2.1 10/03/11 Lowest Fertility Rates Worldwide
10/03/11
10/03/11
Population Stats Infant Mortality Rate the number of children who die before they reach one year US: 6.3/1000 10/03/11
10/03/11
10/03/11
10/03/11
Population Pyramids Show age and sex distribution for a given region County, city, country, state Y axis shows age cohorts Usually in intervals of 5 Ranging from 0-85 X axis shows females and males Males on the left Females always right 10/03/11
Population Geography 10/03/11
Measuring Growth Linear Growth increases in a uniform amount during a series of equal time periods  10/03/11
Measuring Growth Exponential Growth increases in a compounding amount over a series of equal time periods  10/03/11
Measuring Growth Doubling Time the time it takes to double a country’s population  70 / NIR = Doubling Time 10/03/11
World Population Growth, in Billions 10/03/11 Number of years to add each billion (year) All of Human History (1800) 130 (1930) 30 (1960) 15 (1975) 12 (1987) 12 (1999) 14 (2013) 14 (2027) 21 (2048) Sources: First and second billion: Population Reference Bureau. Third through ninth billion: United Nations,  World Population Prospects: The 2004 Revision  (medium scenario), 2005. 1st Billion: 1800 years 2 nd  Billion: 130 years 4 th  Billion: 45 years 8 th  Billion: 52 years
Measuring Growth Population Explosion refers to the rapid growth of the world’s population during the last century accompanied by ever shorter doubling times and accelerating rates of increase  10/03/11
10/03/11
Population Geography 10/03/11                                               
Population Geography 10/03/11 http://desip.igc.org/populationmaps.html                                               
Population Geography 10/03/11
Population Center of the US 10/03/11

Population geography

  • 1.
  • 2.
    Population Geography: EssentialQuestions Where is the world's population distributed? Where has the world's population increased? Why is population increasing at different rates in different countries? Why might the world face an overpopulation problem? 10/03/11
  • 3.
    Population Geography Densityrefers to the frequency with which something occurs Distribution refers to the arrangement of a feature in space 10/03/11
  • 4.
    Population Density ameasure of the number of people per unit area of land arithmetic: people per unit area of land physiologic: people supported by arable land agricultural: farmers to amount of arable land 10/03/11
  • 5.
  • 6.
  • 7.
  • 8.
    Population Distribution describesthe locations on the Earth’s surface where people live Australia Egypt Mexico Canada 10/03/11
  • 9.
    Bangladesh Population: 144,000,000Area: 144,000 sq miles 62% arable land (89,280 sq miles) physiologic density=1612 people per square mile of arable land 10/03/11
  • 10.
    Montana/United States MontanaPopulation: 145,000 Area: 902,195 square miles 18% arable land = 162,395 square miles Physiologic density = 1119 per square mile US Population: 300,000,000 Area: 3,717,810 square miles 19% arable land = 706,383 square miles Physiologic density = 424 per square mile 10/03/11
  • 11.
    World Population ConcentrationsEast Asia South Asia Southeast Asia Europe 10/03/11 In the three Asian clusters, more than ½ the world’s population lives on less than 10% of the world’s land.
  • 12.
  • 13.
    East Asia China,Korea, Japan, Taiwan 1/5 the world’s total population 5/6 of the region’s population live in China, mostly river and coastal regions 2/3 of people in China live as farmers in rural areas In Japan and Korean Peninsula, ¾+ live in urban areas and work in industry and service 10/03/11
  • 14.
    South Asia India,Pakistan, Bangladesh, Sri Lanka 1/5 the world’s population most are rural farmers (3/4), not city dwellers centered along Ganges and Indus river valleys, lowlands and coastal areas restrained by mountains 10/03/11
  • 15.
    Southeast Asia Indonesia,Papua New Guinea, Philippines Island nations in the Pacific Around river valleys and deltas 10/03/11
  • 16.
    Europe Britain, Germany,Poland, Ukraine, Belarus, France, N Italy ¾ live in cities Less than 20% are farmers Highest concentration near coal fields 10/03/11
  • 17.
    Subordinate Regions EasternUS Bosnywash, Chicago, Detroit, Cleveland, California In Europe and North America, cities and towns more densely populated that rural areas Megalopolis 10/03/11
  • 18.
    Subordinate Regions WesternAfrica Nigeria most populous African country 10/03/11
  • 19.
  • 20.
    Population Stats BirthRate number of live births per year per 1000 people in the population +30 is high highest today in Africa and SW Asia lowest in Europe inversely related to modernization, industrialization, urbanization and economic development exception: China US: 14/1000 10/03/11
  • 21.
  • 22.
  • 23.
    Population Stats DeathRate number of deaths per thousand people in a given year highest in tropical Africa lowest in N America, S America, Europe, Japan, Australia high CDR’s tend to reflect high infant mortality US: 8/1000 10/03/11
  • 24.
  • 25.
  • 26.
    Population Stats NaturalIncrease difference between number of births and deaths during a specific time period US: .88% 10/03/11 Natural Increase
  • 27.
  • 28.
  • 29.
  • 30.
    Population Stats TotalFertility Rate the number of children born to women of child bearing age 15-45 ?? 2.1 10/03/11 Lowest Fertility Rates Worldwide
  • 31.
  • 32.
  • 33.
    Population Stats InfantMortality Rate the number of children who die before they reach one year US: 6.3/1000 10/03/11
  • 34.
  • 35.
  • 36.
  • 37.
    Population Pyramids Showage and sex distribution for a given region County, city, country, state Y axis shows age cohorts Usually in intervals of 5 Ranging from 0-85 X axis shows females and males Males on the left Females always right 10/03/11
  • 38.
  • 39.
    Measuring Growth LinearGrowth increases in a uniform amount during a series of equal time periods 10/03/11
  • 40.
    Measuring Growth ExponentialGrowth increases in a compounding amount over a series of equal time periods 10/03/11
  • 41.
    Measuring Growth DoublingTime the time it takes to double a country’s population 70 / NIR = Doubling Time 10/03/11
  • 42.
    World Population Growth,in Billions 10/03/11 Number of years to add each billion (year) All of Human History (1800) 130 (1930) 30 (1960) 15 (1975) 12 (1987) 12 (1999) 14 (2013) 14 (2027) 21 (2048) Sources: First and second billion: Population Reference Bureau. Third through ninth billion: United Nations, World Population Prospects: The 2004 Revision (medium scenario), 2005. 1st Billion: 1800 years 2 nd Billion: 130 years 4 th Billion: 45 years 8 th Billion: 52 years
  • 43.
    Measuring Growth PopulationExplosion refers to the rapid growth of the world’s population during the last century accompanied by ever shorter doubling times and accelerating rates of increase 10/03/11
  • 44.
  • 45.
    Population Geography 10/03/11                                            
  • 46.
    Population Geography 10/03/11                                            
  • 47.
    Population Geography 10/03/11                                            
  • 48.
    Population Geography 10/03/11                                            
  • 49.
    Population Geography 10/03/11                                            
  • 50.
    Population Geography 10/03/11                                            
  • 51.
    Population Geography 10/03/11                                            
  • 52.
    Population Geography 10/03/11http://desip.igc.org/populationmaps.html                                            
  • 53.
  • 54.
    Population Center ofthe US 10/03/11