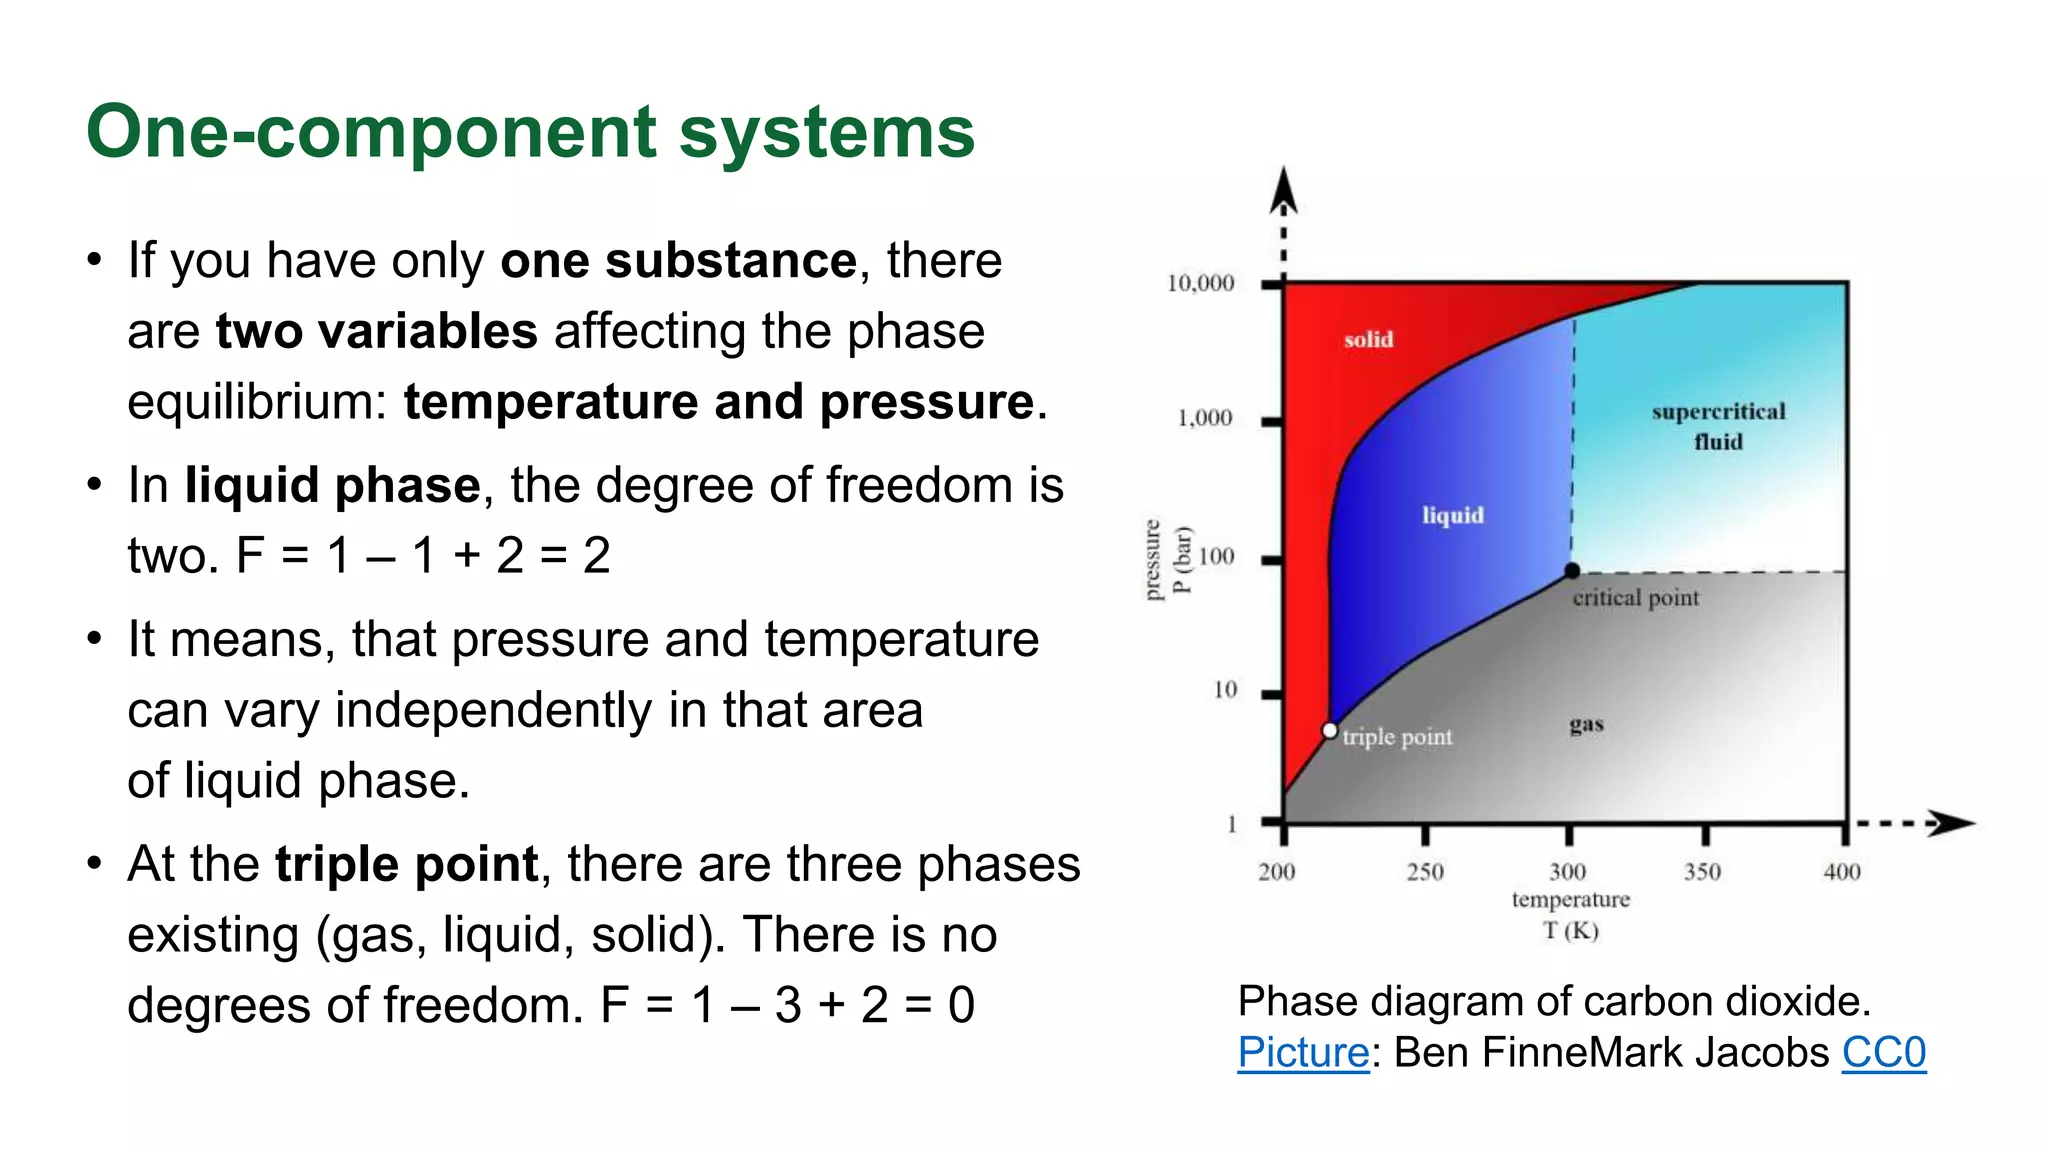
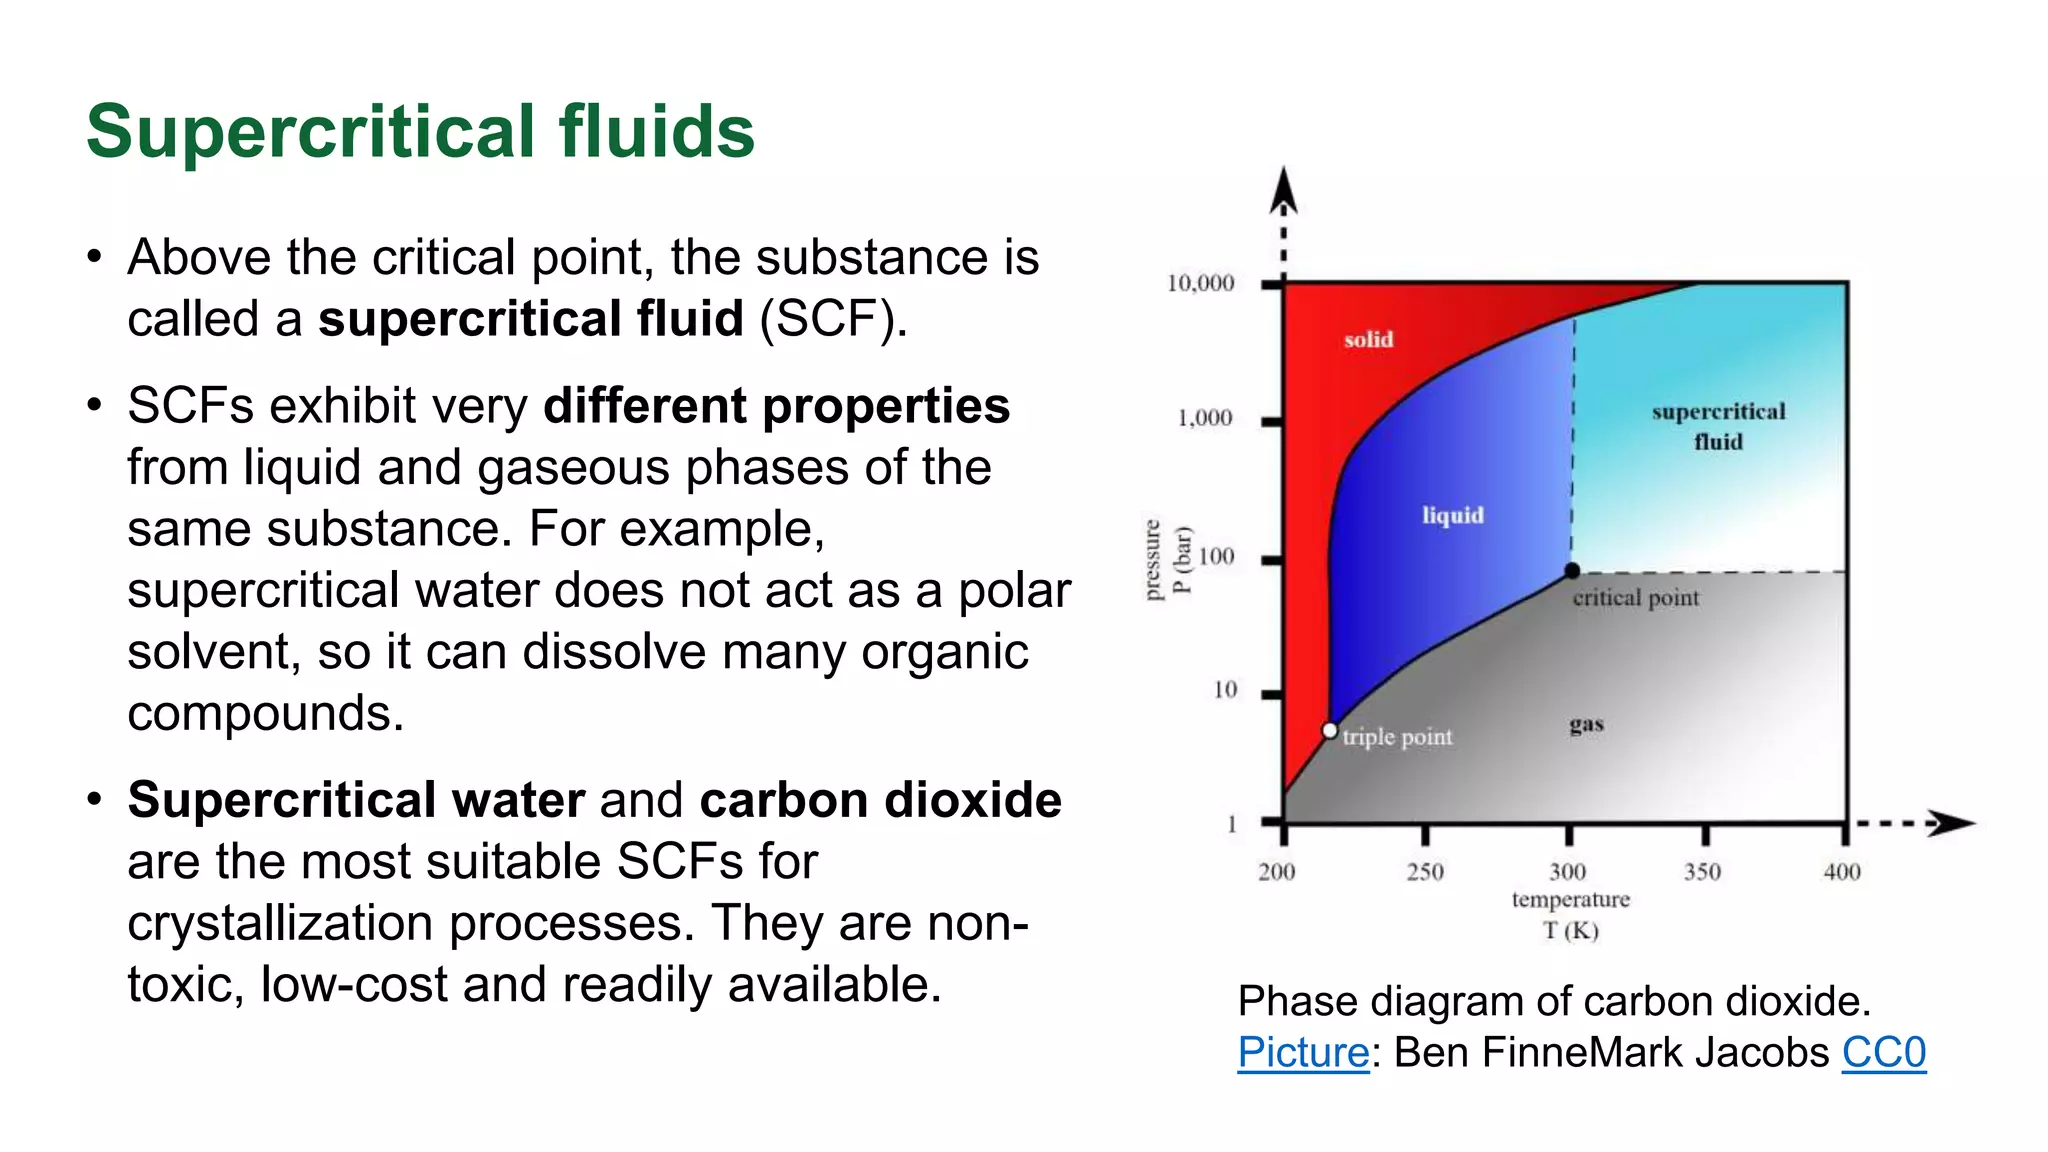
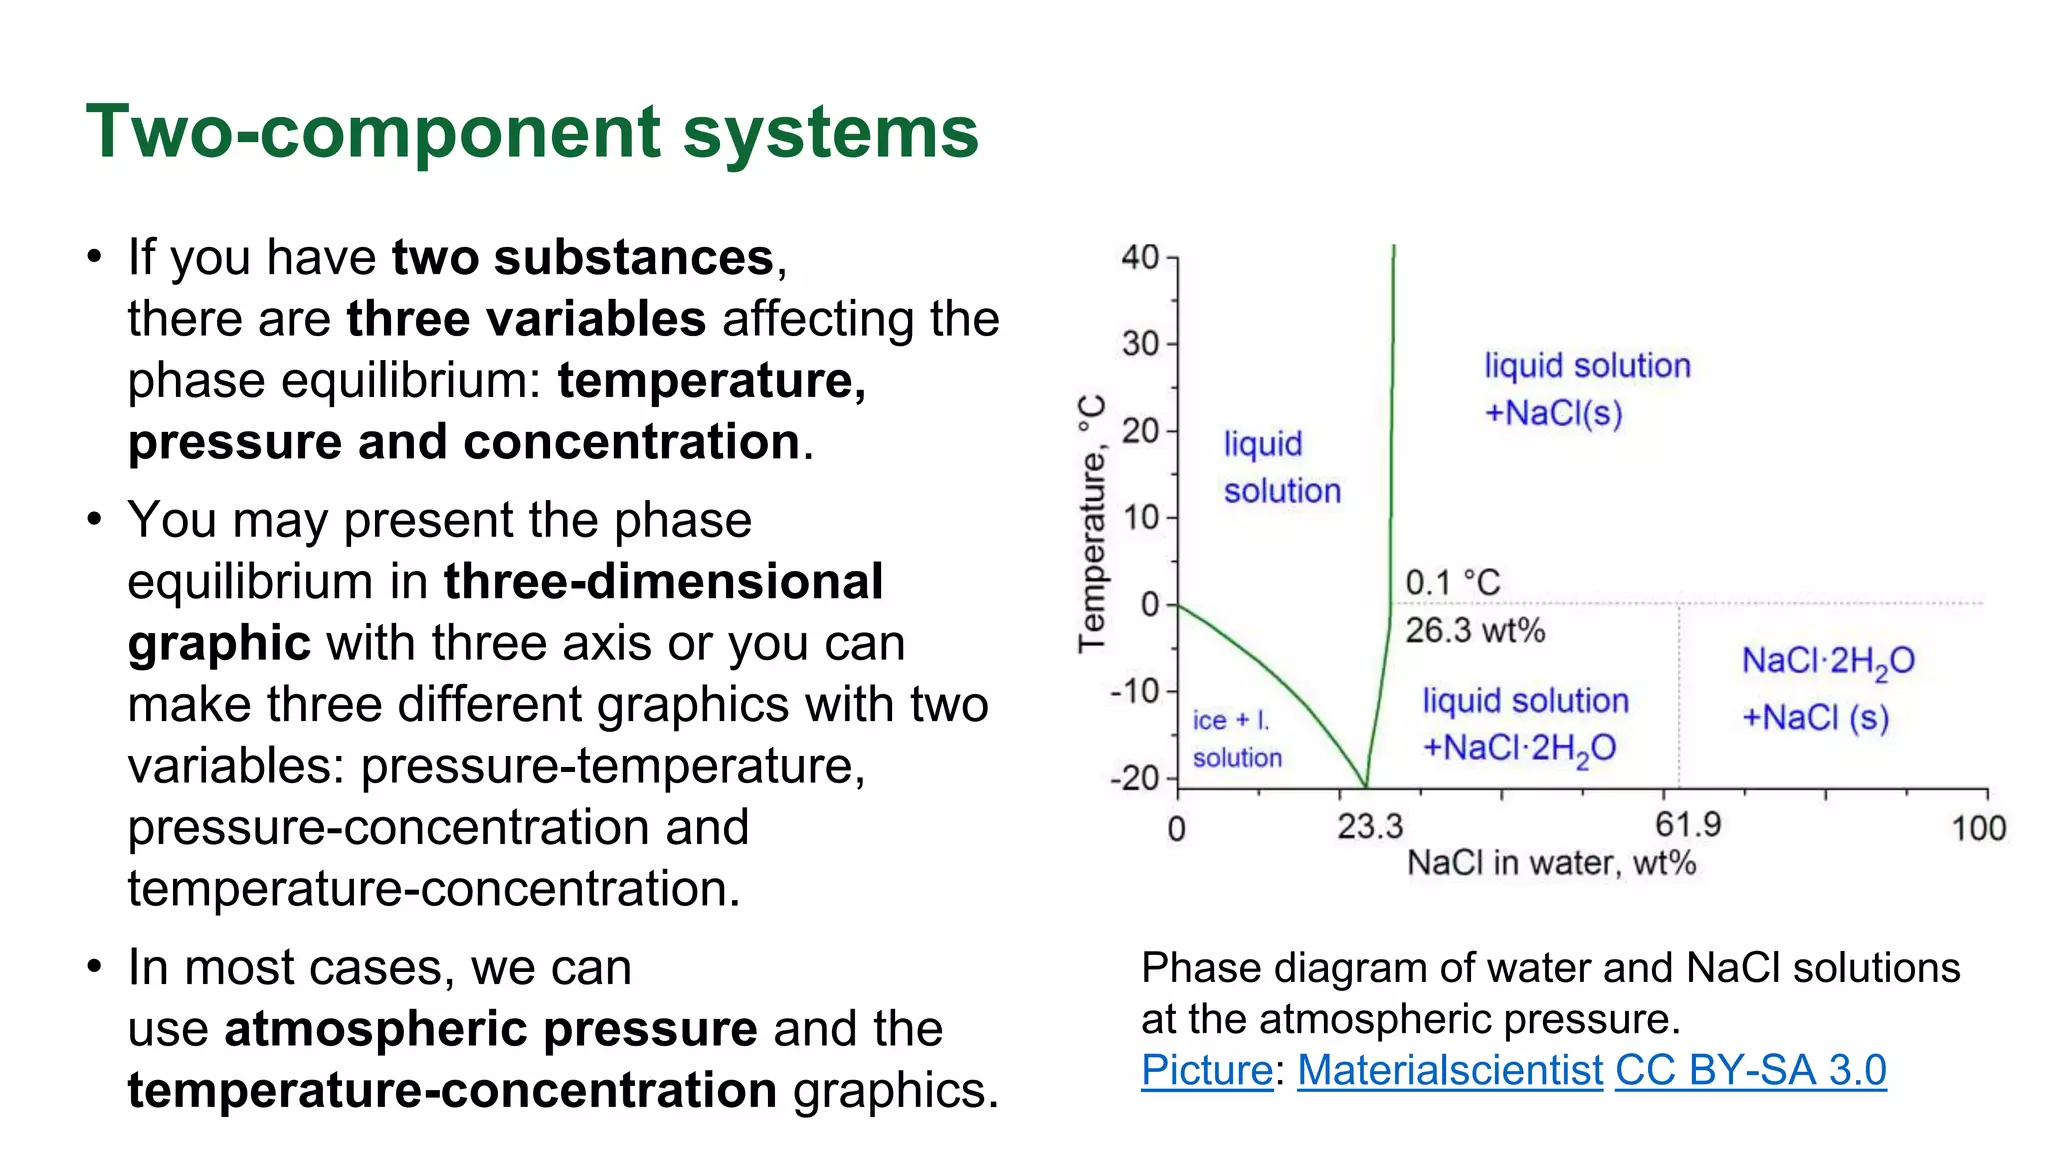
Slides for the eLearning course Separation and purification processes in biorefineries (https://open-learn.xamk.fi) in IMPRESS project (https://www.spire2030.eu/impress).
Section: Crystallization
Subject: 1.5 Phase equilibrium
1. This project has received funding from the European Union’s Horizon 2020
research and innovation programme under grant agreement No 869993.
Phase
equilibrium
2. Gibbs phase rule
• J. Willard Gibbs (1839-1903) formulated a
phase rule:
F = C – P + 2
F = degrees of freedom
C = components of a system
P = phase (homogeneous parts of a system)
• The phase rule determines how many
independent intensive variables can exist
in a specific state of equilibrium.
• Intensive variables are variables, which do
not vary with the amount of the substance.
E.g. temperature, density and pressure
are intensive variables.
• Variables that vary with the amount are called
extensive variables, e.g. mass and volume.
3. One-component systems
• If you have only one substance, there
are two variables affecting the phase
equilibrium: temperature and pressure.
• In liquid phase, the degree of freedom is
two. F = 1 – 1 + 2 = 2
• It means, that pressure and temperature
can vary independently in that area
of liquid phase.
• At the triple point, there are three phases
existing (gas, liquid, solid). There is no
degrees of freedom. F = 1 – 3 + 2 = 0 Phase diagram of carbon dioxide.
Picture: Ben FinneMark Jacobs CC0
4. Supercritical fluids
• Above the critical point, the substance is
called a supercritical fluid (SCF).
• SCFs exhibit very different properties
from liquid and gaseous phases of the
same substance. For example,
supercritical water does not act as a polar
solvent, so it can dissolve many organic
compounds.
• Supercritical water and carbon dioxide
are the most suitable SCFs for
crystallization processes. They are non-
toxic, low-cost and readily available. Phase diagram of carbon dioxide.
Picture: Ben FinneMark Jacobs CC0
5. Two-component systems
• If you have two substances,
there are three variables affecting the
phase equilibrium: temperature,
pressure and concentration.
• You may present the phase
equilibrium in three-dimensional
graphic with three axis or you can
make three different graphics with two
variables: pressure-temperature,
pressure-concentration and
temperature-concentration.
• In most cases, we can
use atmospheric pressure and the
temperature-concentration graphics.
Phase diagram of water and NaCl solutions
at the atmospheric pressure.
Picture: Materialscientist CC BY-SA 3.0
6. Lines in phase diagrams
• Let’s take a closer look at the phase
diagram of NaCl and water.
• Line AB is a melting curve.
• Line BD is the solubility curve.
• Together they form a liquidus line
ABD.
• Above the line ABD, there is only a
liquid phase: an unsaturated liquid
solution of NaCl and water.
• There are three different types of
solids in the system: ice, solid NaCl
and hydrous salt NaCl∙2H2O.
Phase diagram of water and NaCl solutions.
Picture: Materialscientist CC BY-SA 3.0
Remixed by Kati Jordan
7. Eutectic system
• Mixture of water and NaCl is an
eutectic system. They have an
eutectic point where the liquid phase
decomposes directly to solids. Eutectic
temperature is the lowest melting point
of the system. Eutectic composition
expresses the concentration of the
solution at the eutectic point.
• The eutectic point of NaCl-water
solution is at the point B: mass fraction
23.3 %, temperature -21.1 °C. At the
eutectis point, the system is at
equilibrium and the degrees of
freedom equals zero.
Phase diagram of water and NaCl solutions.
Picture: Materialscientist CC BY-SA 3.0
Remixed by Kati Jordan
8. Eutectic system
• Point C (26.3 %, 0.1 °C) is a transition
point of NaCl∙2H2O. Dihydrates
decompose into anhydrous salt and water.
• Below the line FG, there occur only solids:
ice and hydrous salt NaCl∙2H2O. The line
is called a solidus line.
• In the area BCEF, we have a mixture of
saturated solution and solids of hydrous
salt (NaCl∙2H2O).
• The vertical line IE at mass fraction of 61.9
% presents the composition of hydrous
salt. On the right side, there are only
solids of salt and hydrous salt.
Phase diagram of water and NaCl solutions.
Picture: Materialscientist CC BY-SA 3.0
Remixed by Kati Jordan
9. This project has received funding from the European Union’s Horizon 2020
research and innovation programme under grant agreement No 869993.
References
Mullin, J. W. 2001. Crystallization. Oxford: Elsevier Science & Technology. pp. 140-146, 302-303.
Myerson, A. S. (ed.) 2002. Handbook of Industrial Crystallization. Elsevier Inc. pp. 14-18.
Swenne, D. A. 1983. The Eutectic crystallization of NaCl.2H2O and ice. Available at:
https://pure.tue.nl/ws/files/1708990/50645.pdf (Accessed: 20 July 2020)
Wikipedia. 2020. Joshian Willard Gibbs. Available at:
https://en.wikipedia.org/wiki/Josiah_Willard_Gibbs (Accessed: 10 August 2020)
Videos:
• Gibbs phase rule: https://youtu.be/CceXmKio_DE
• Phase equilibrium: https://youtu.be/o6LvdHU8hKI
• Condenced phase equilibrium: https://youtu.be/KHJnurhRML8