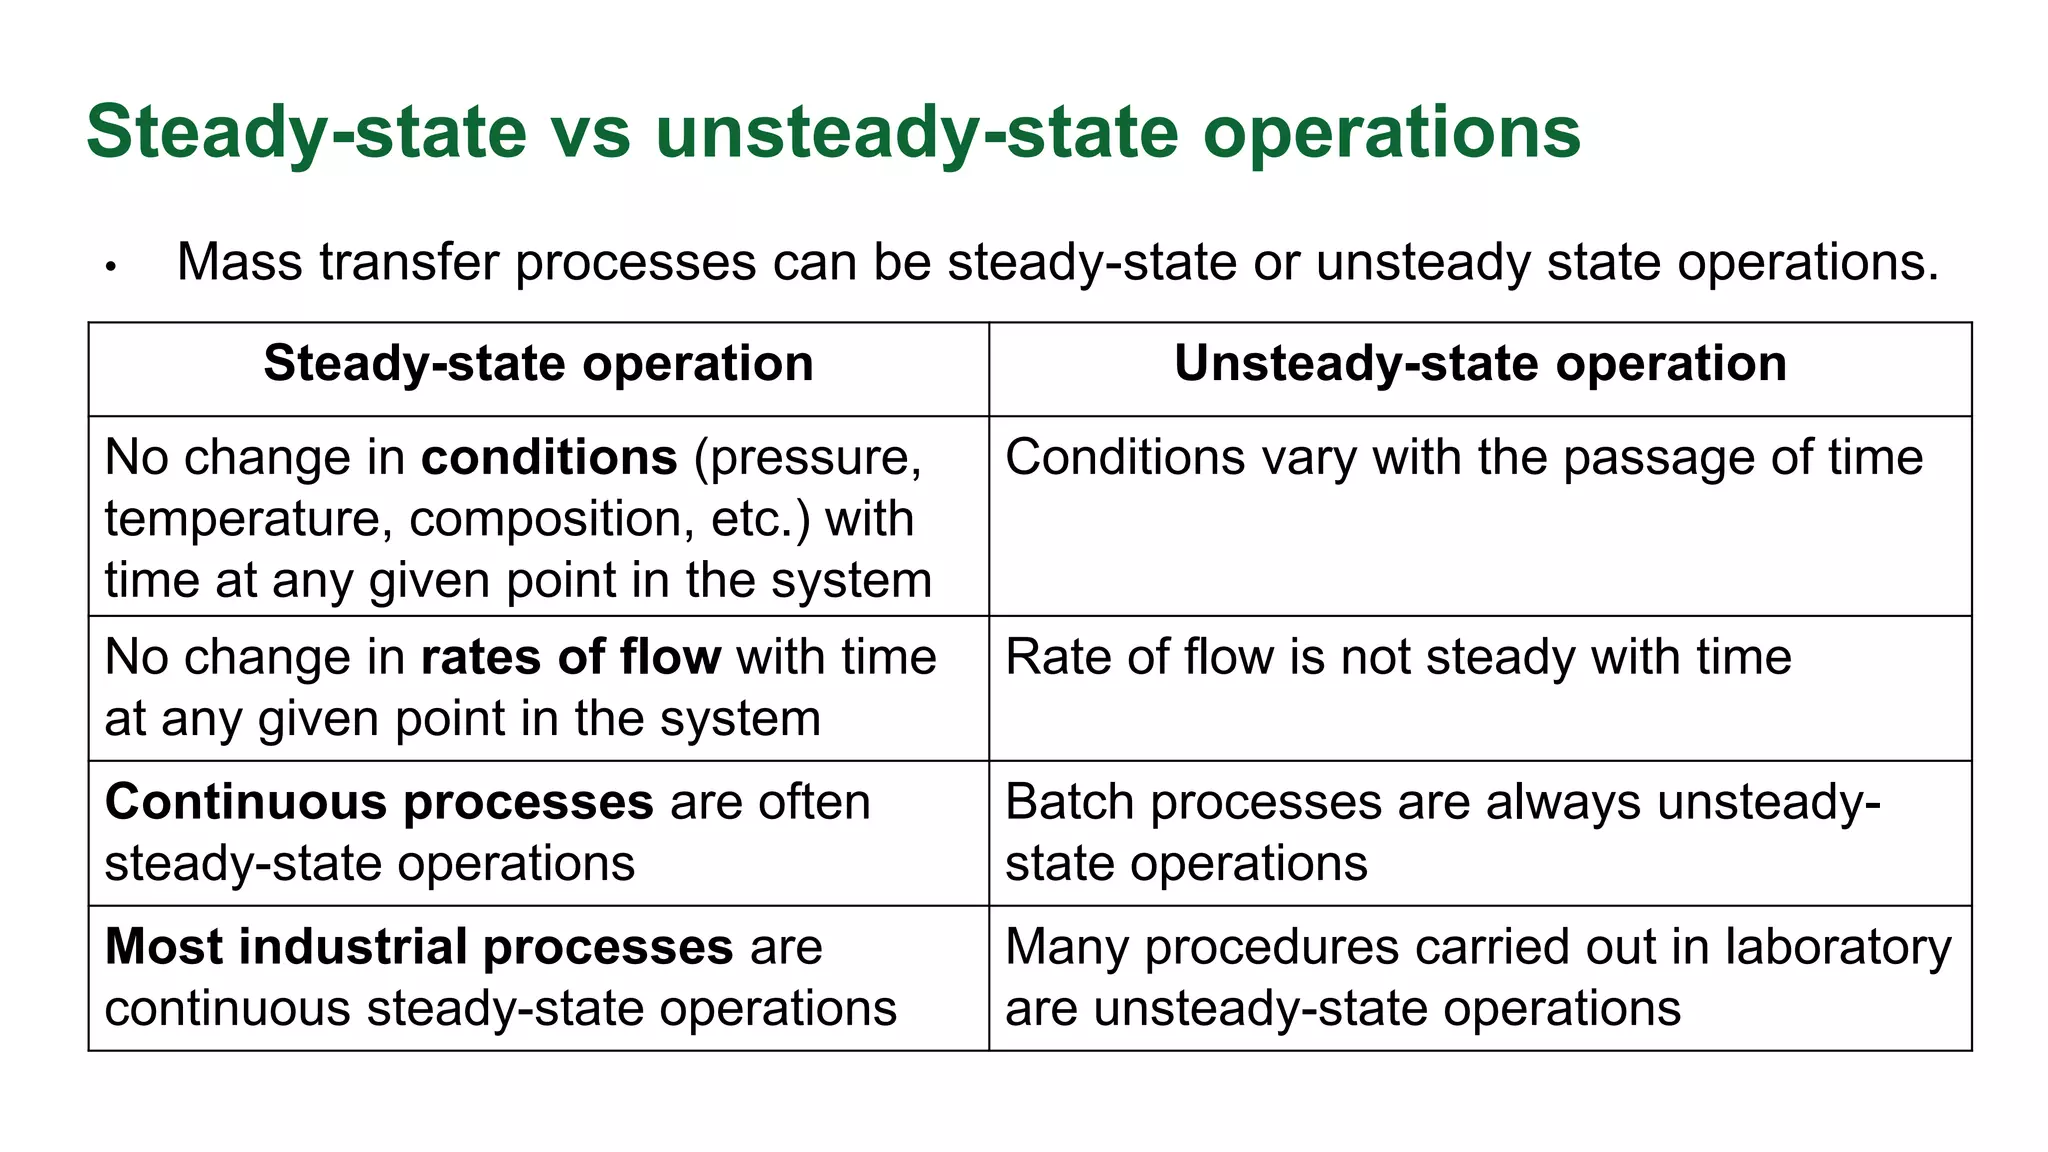
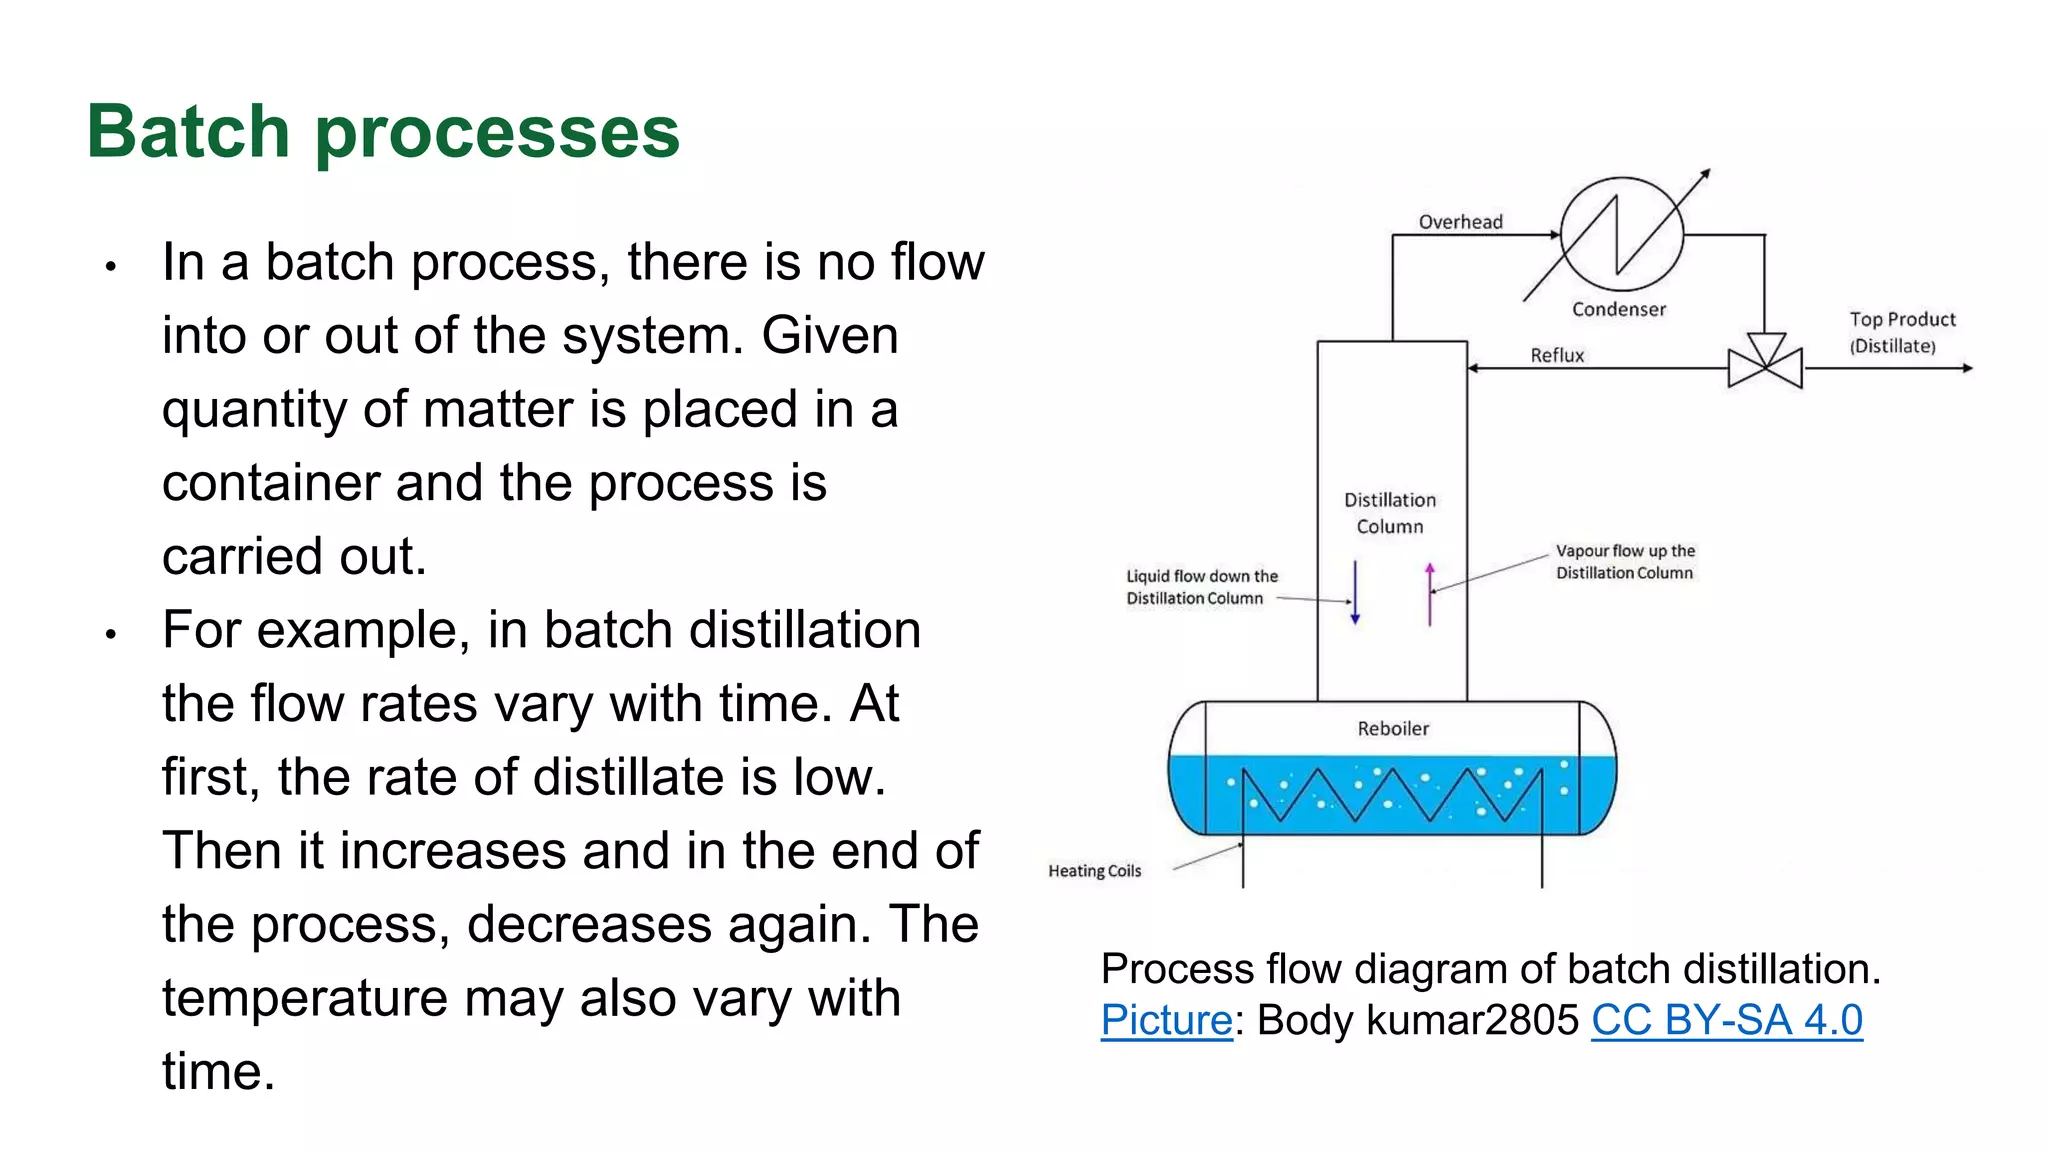
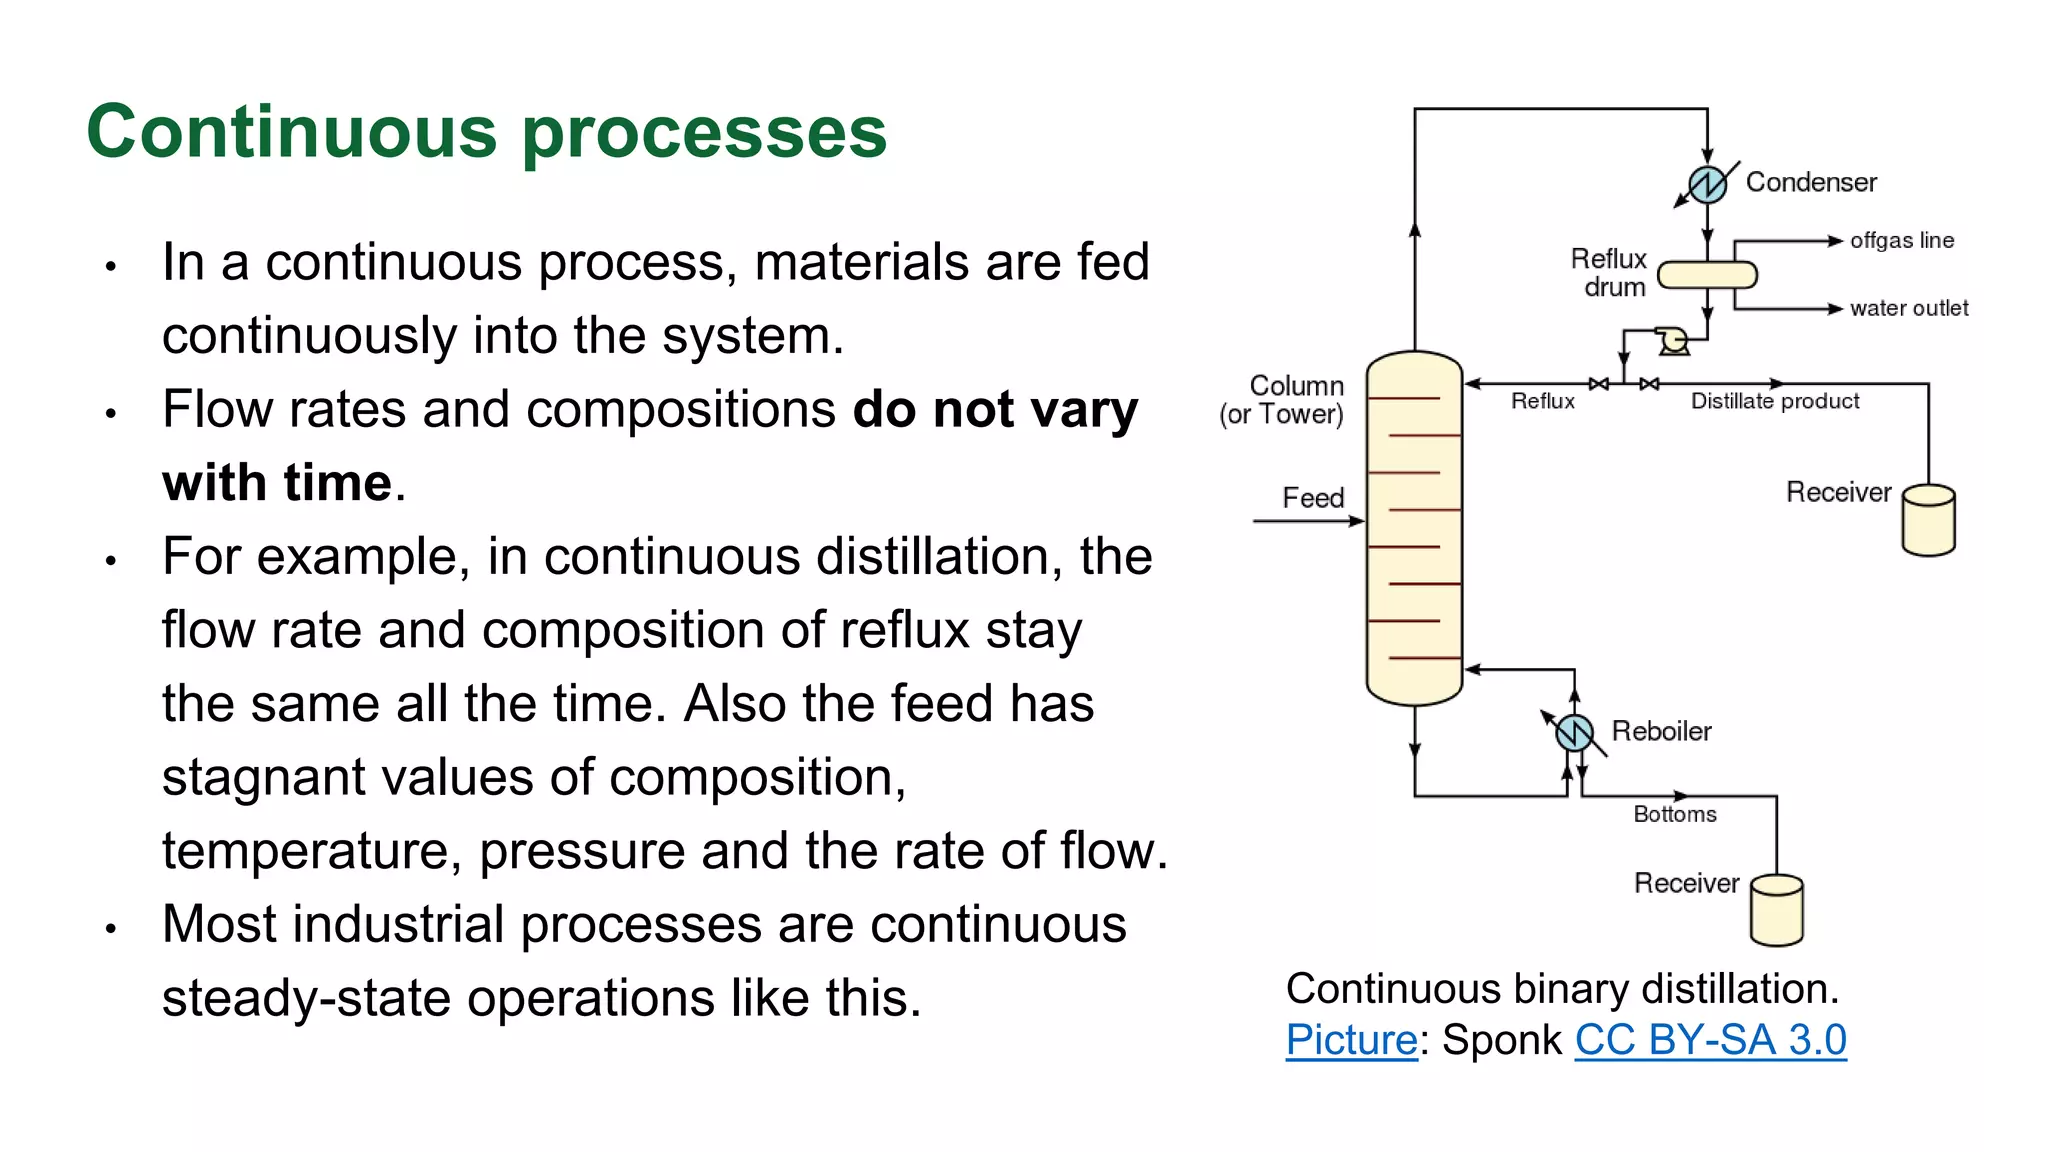
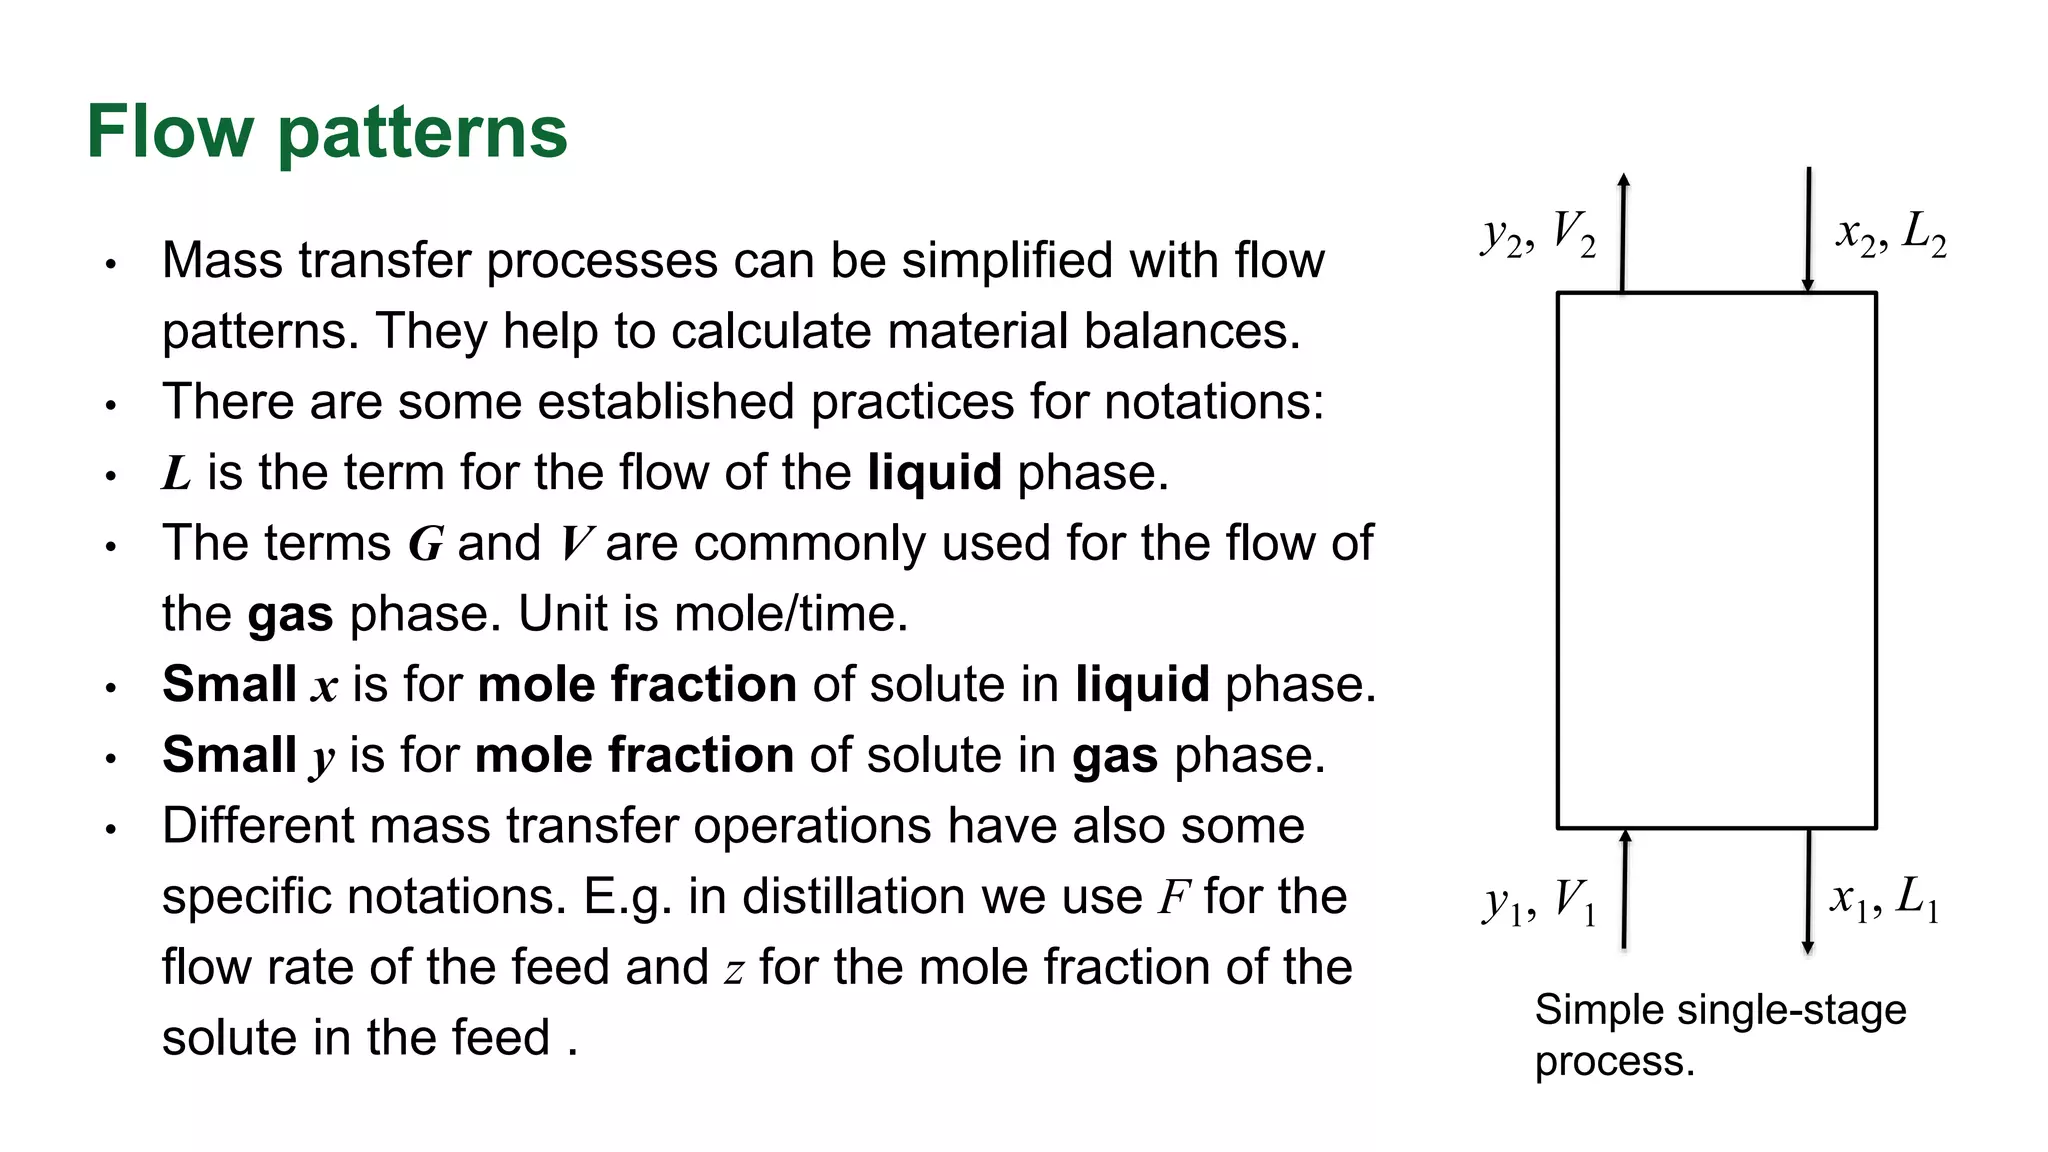
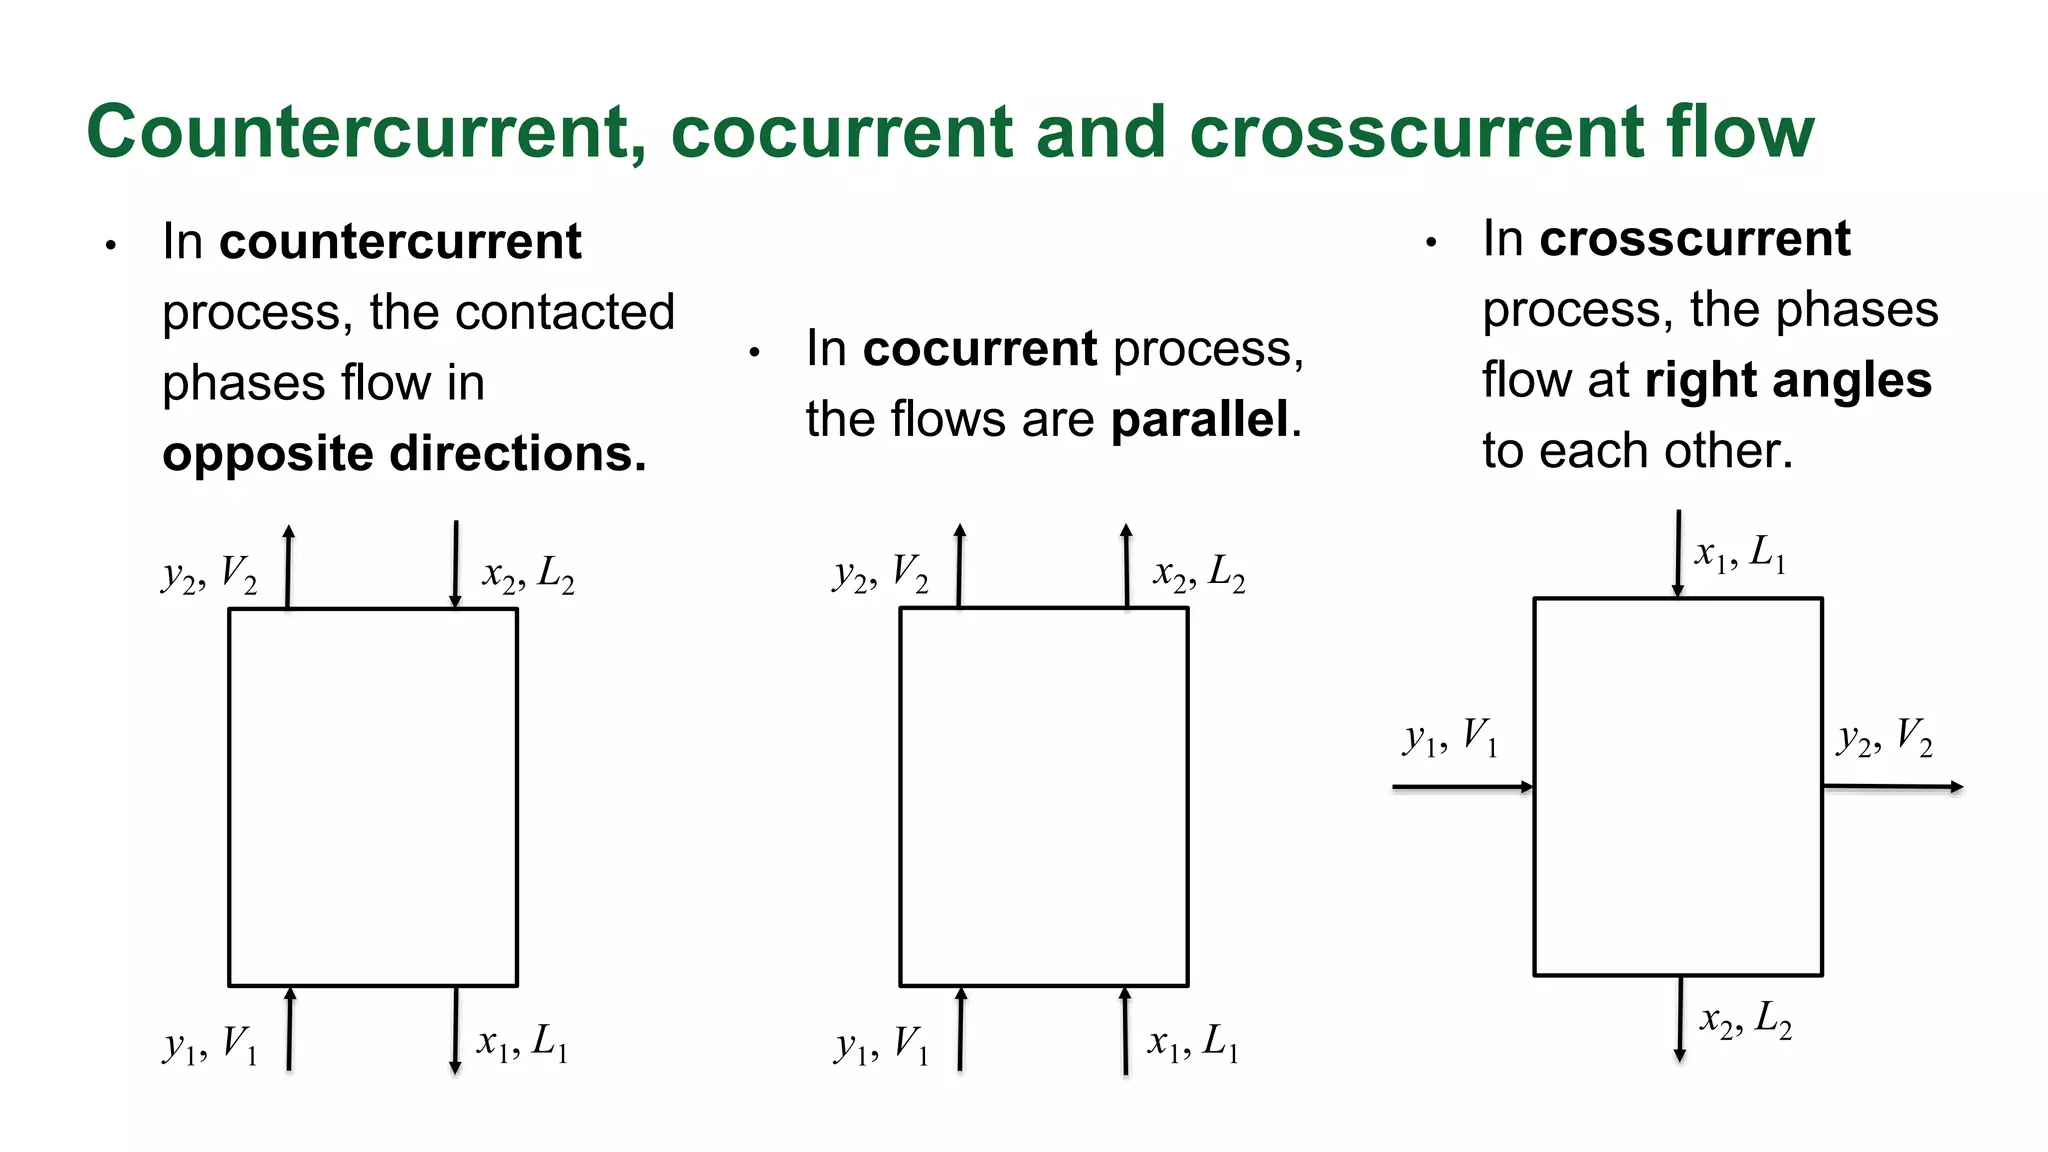
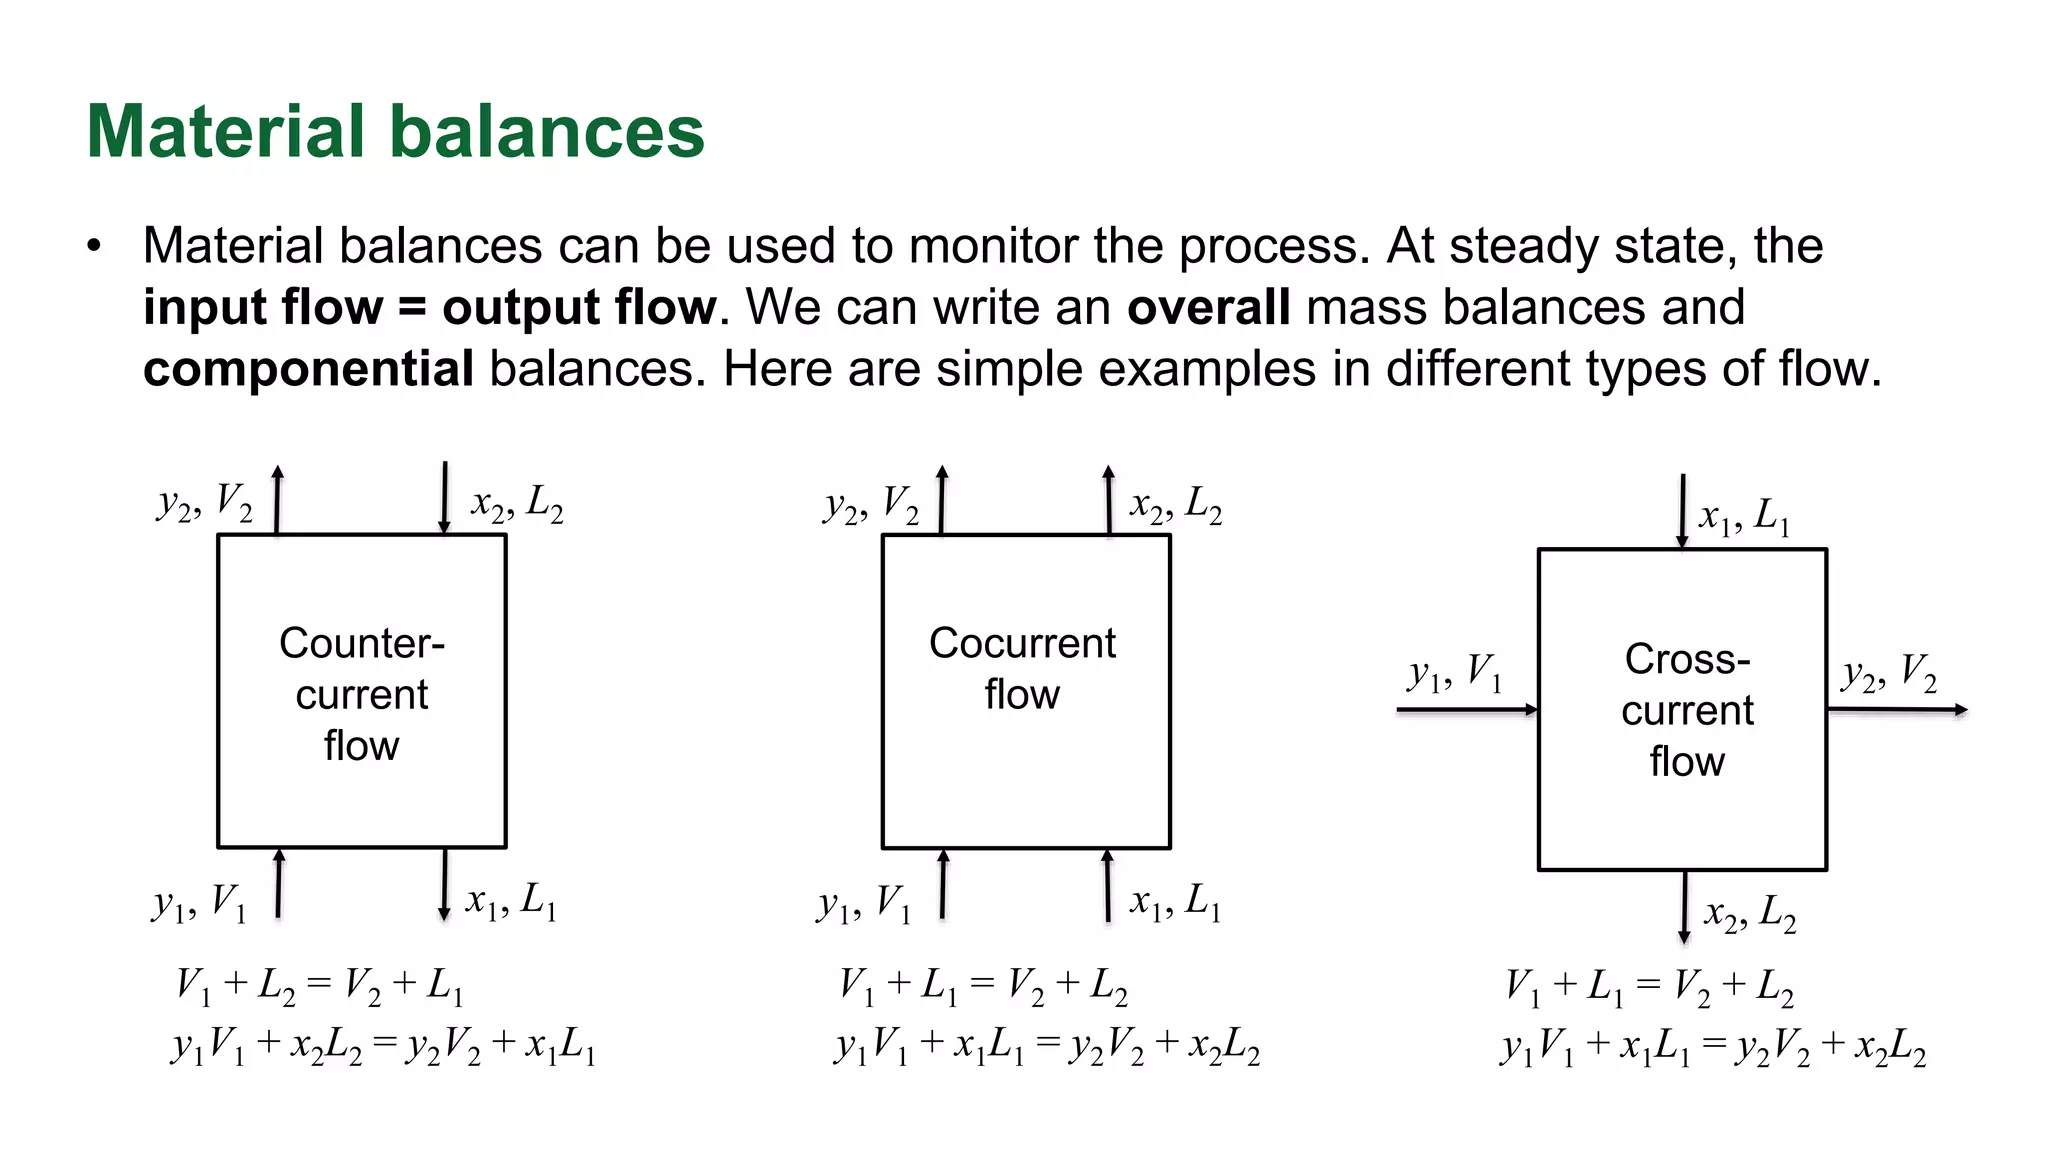
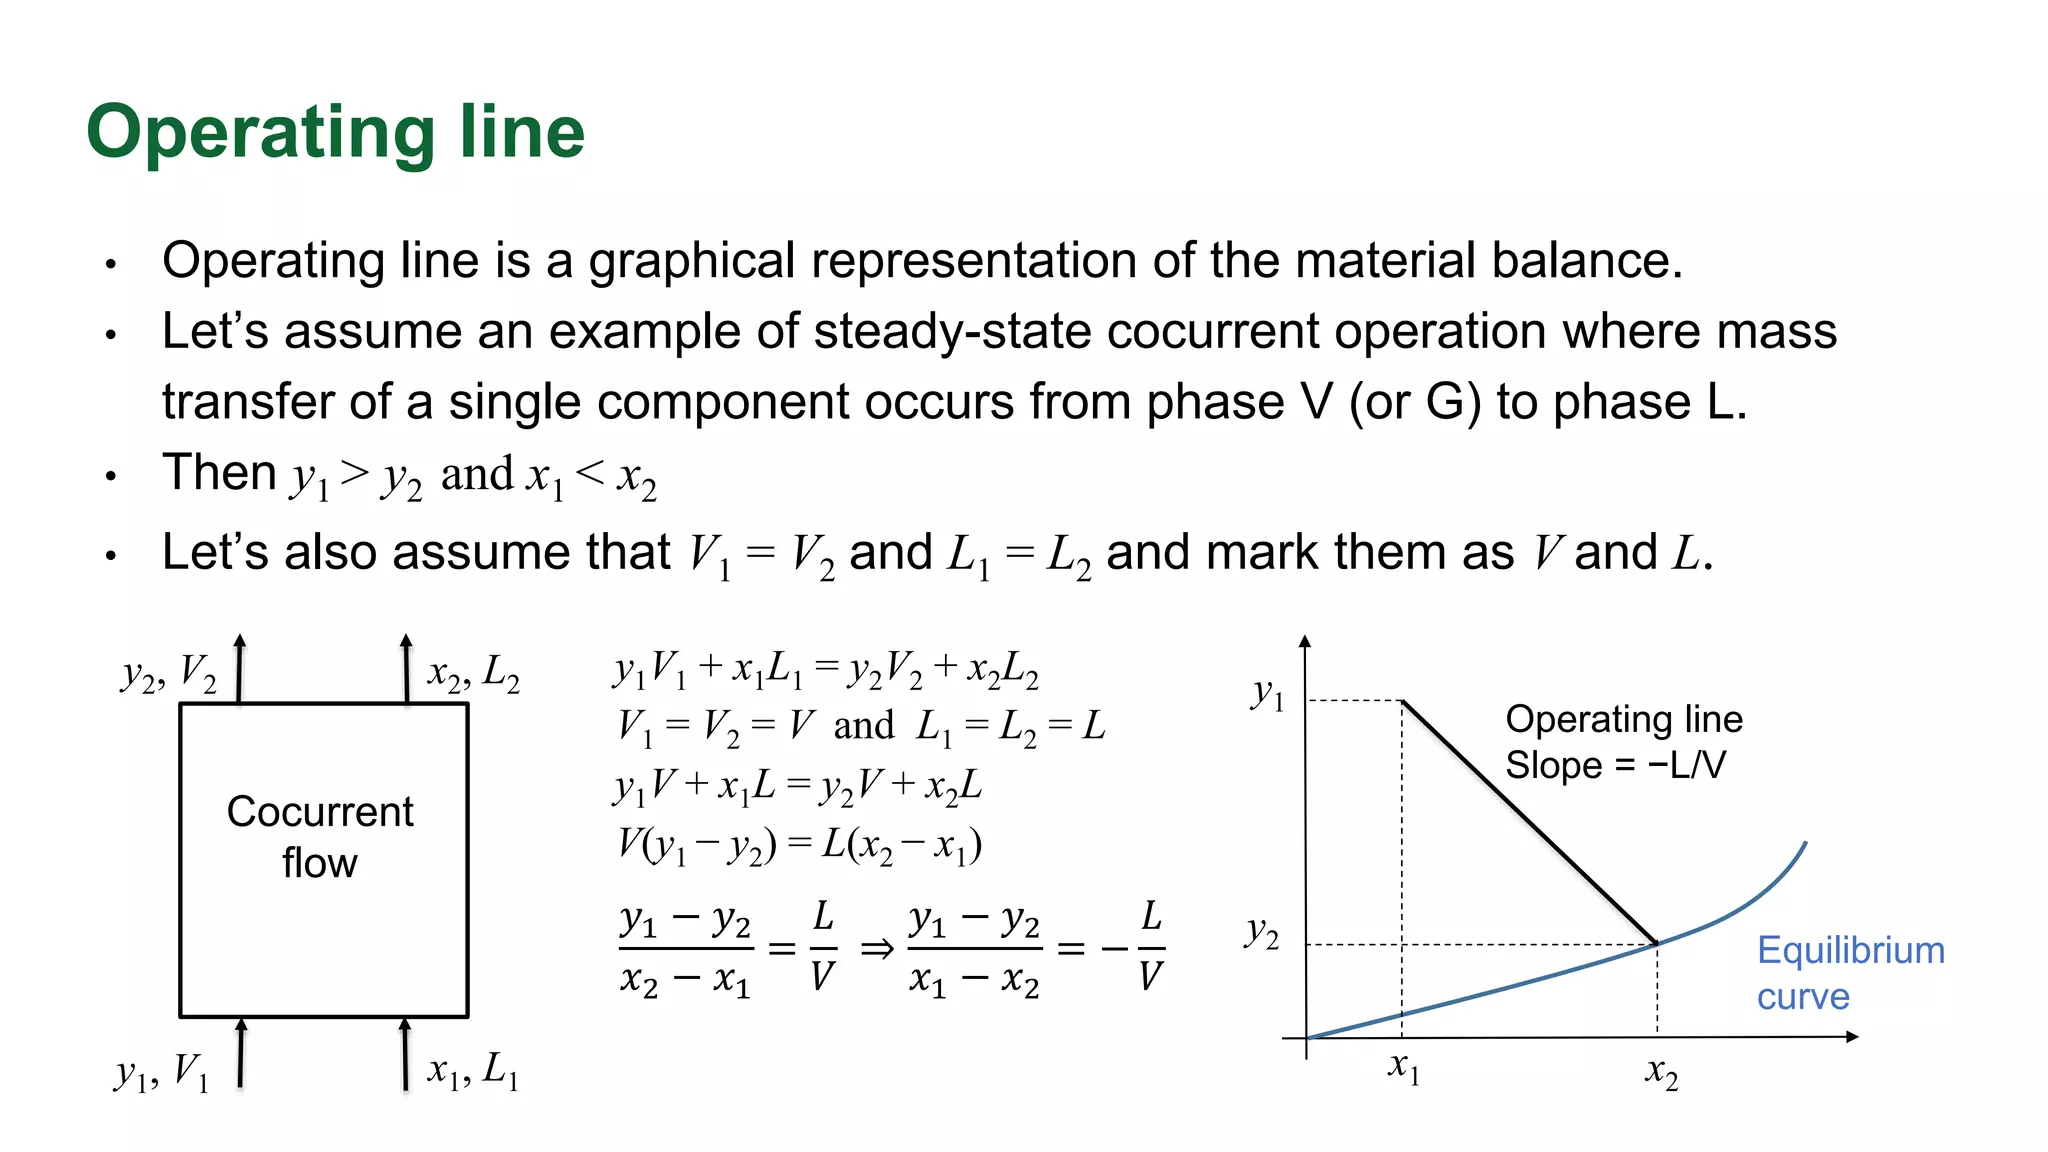
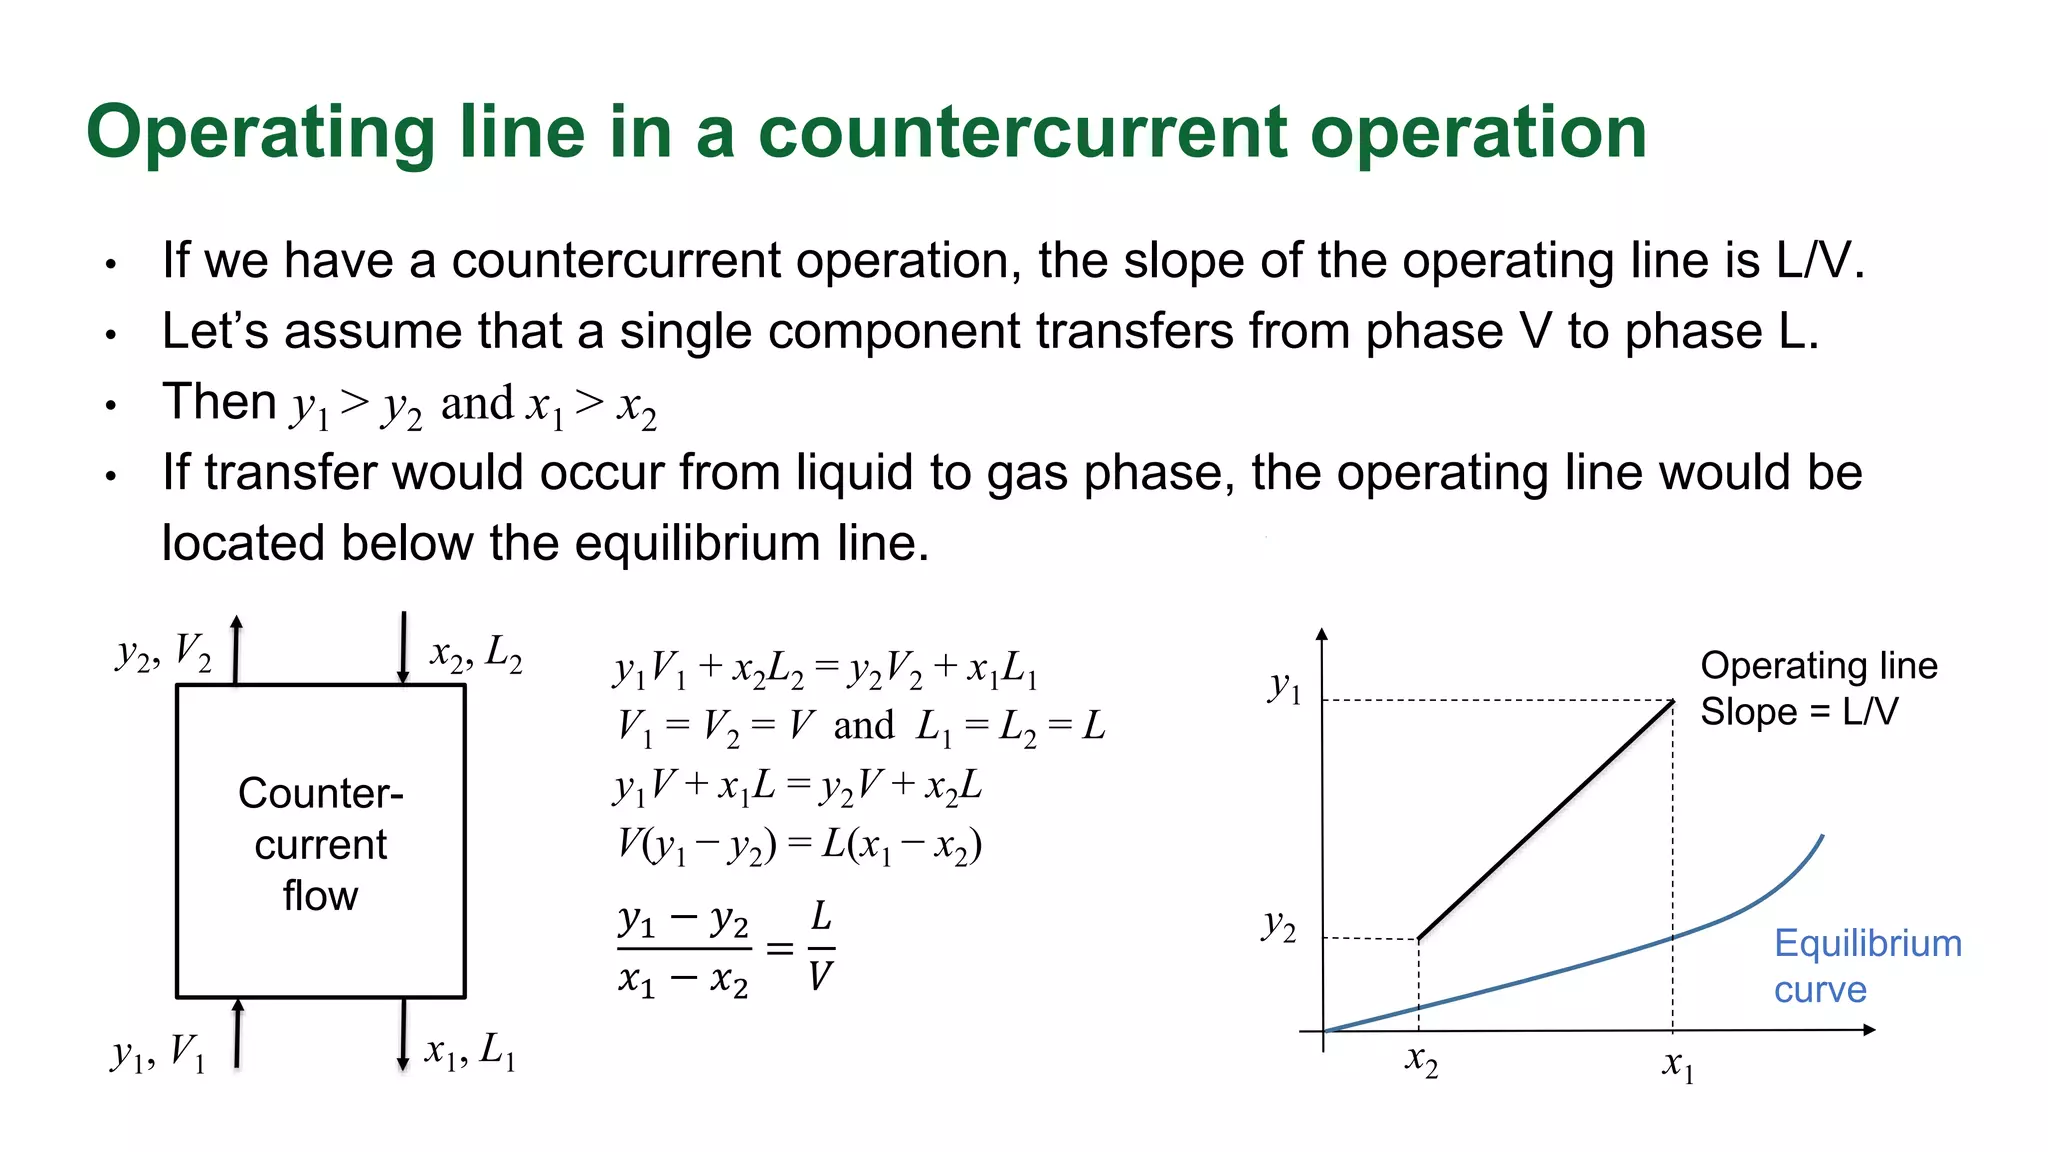
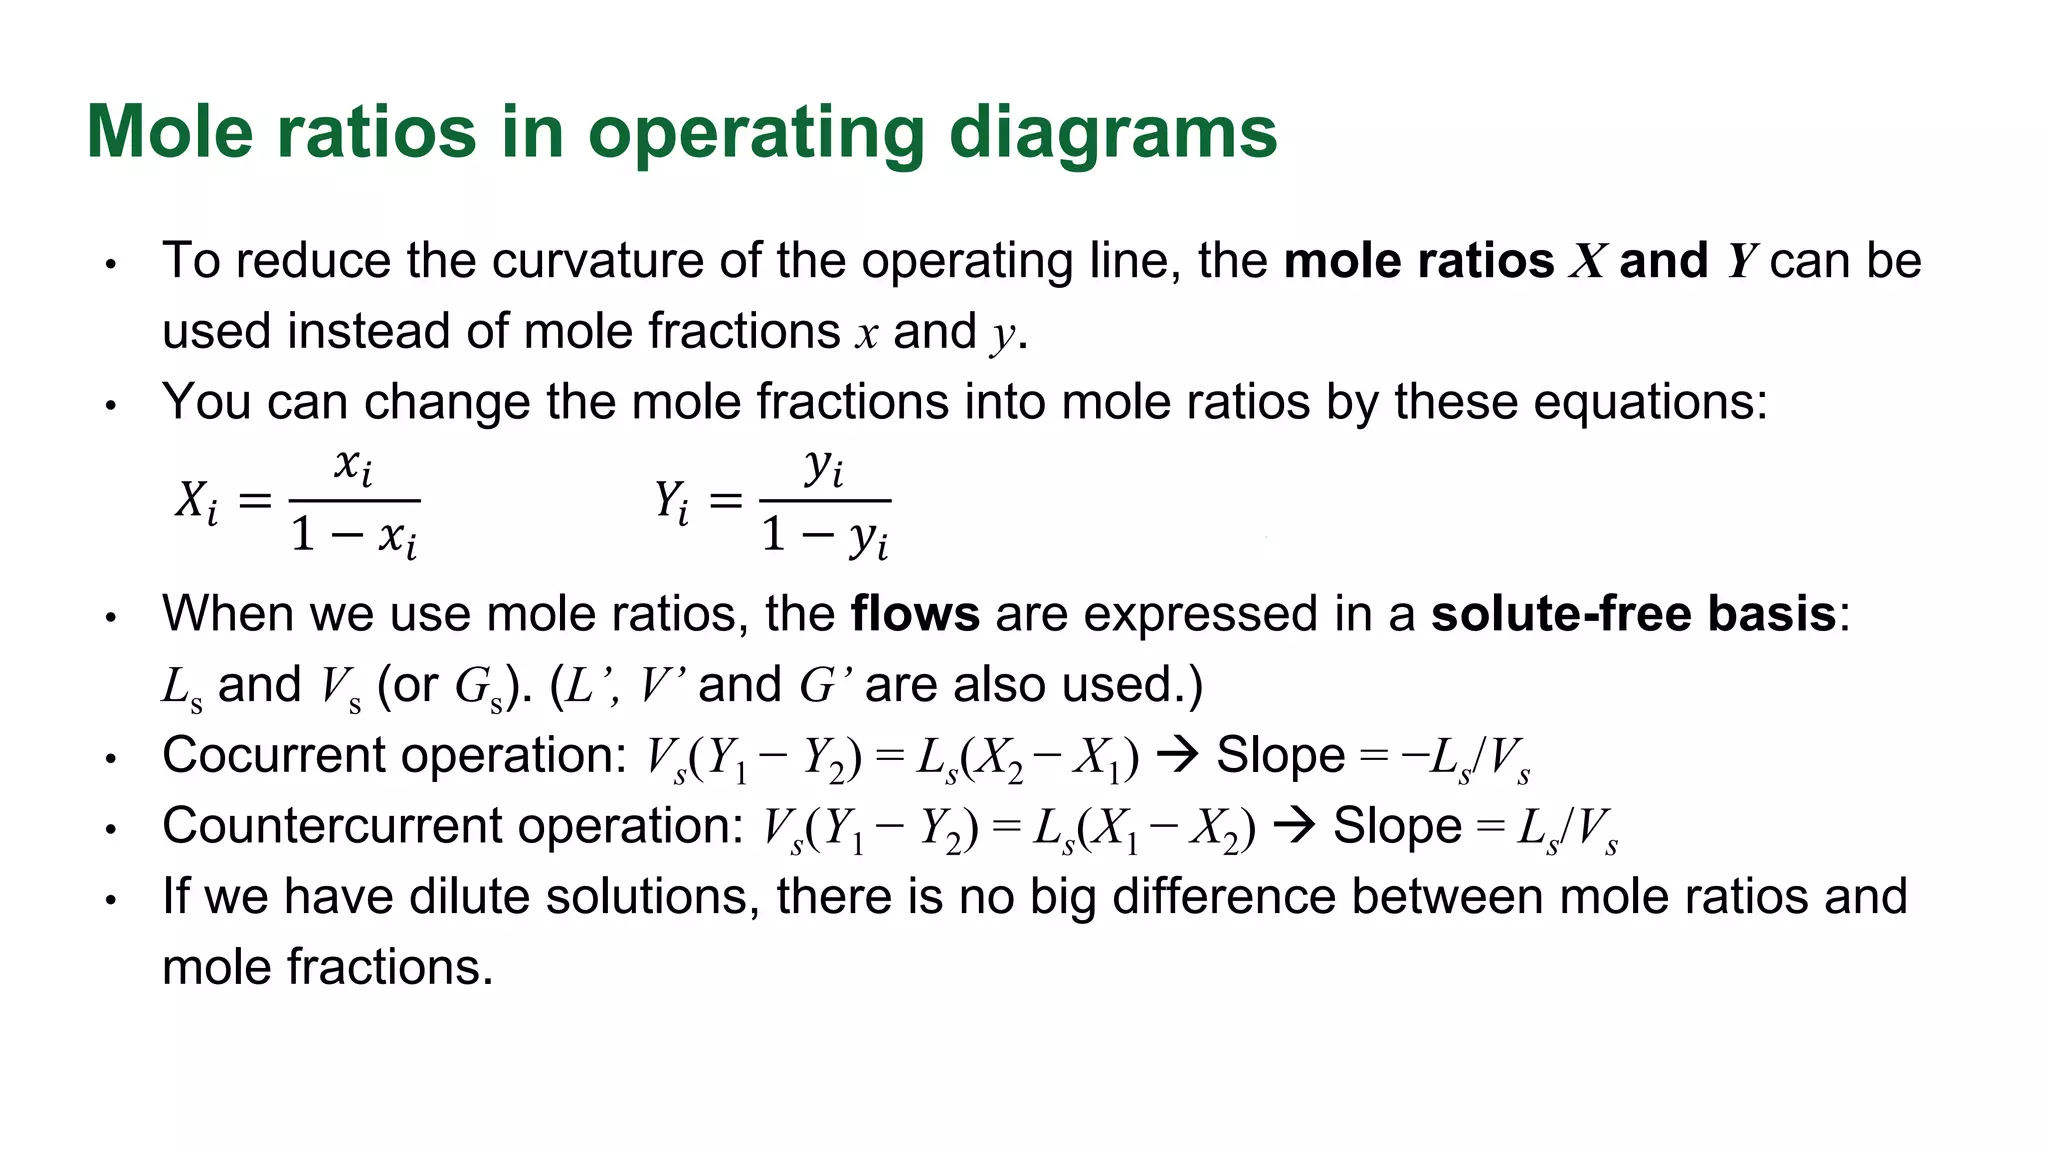
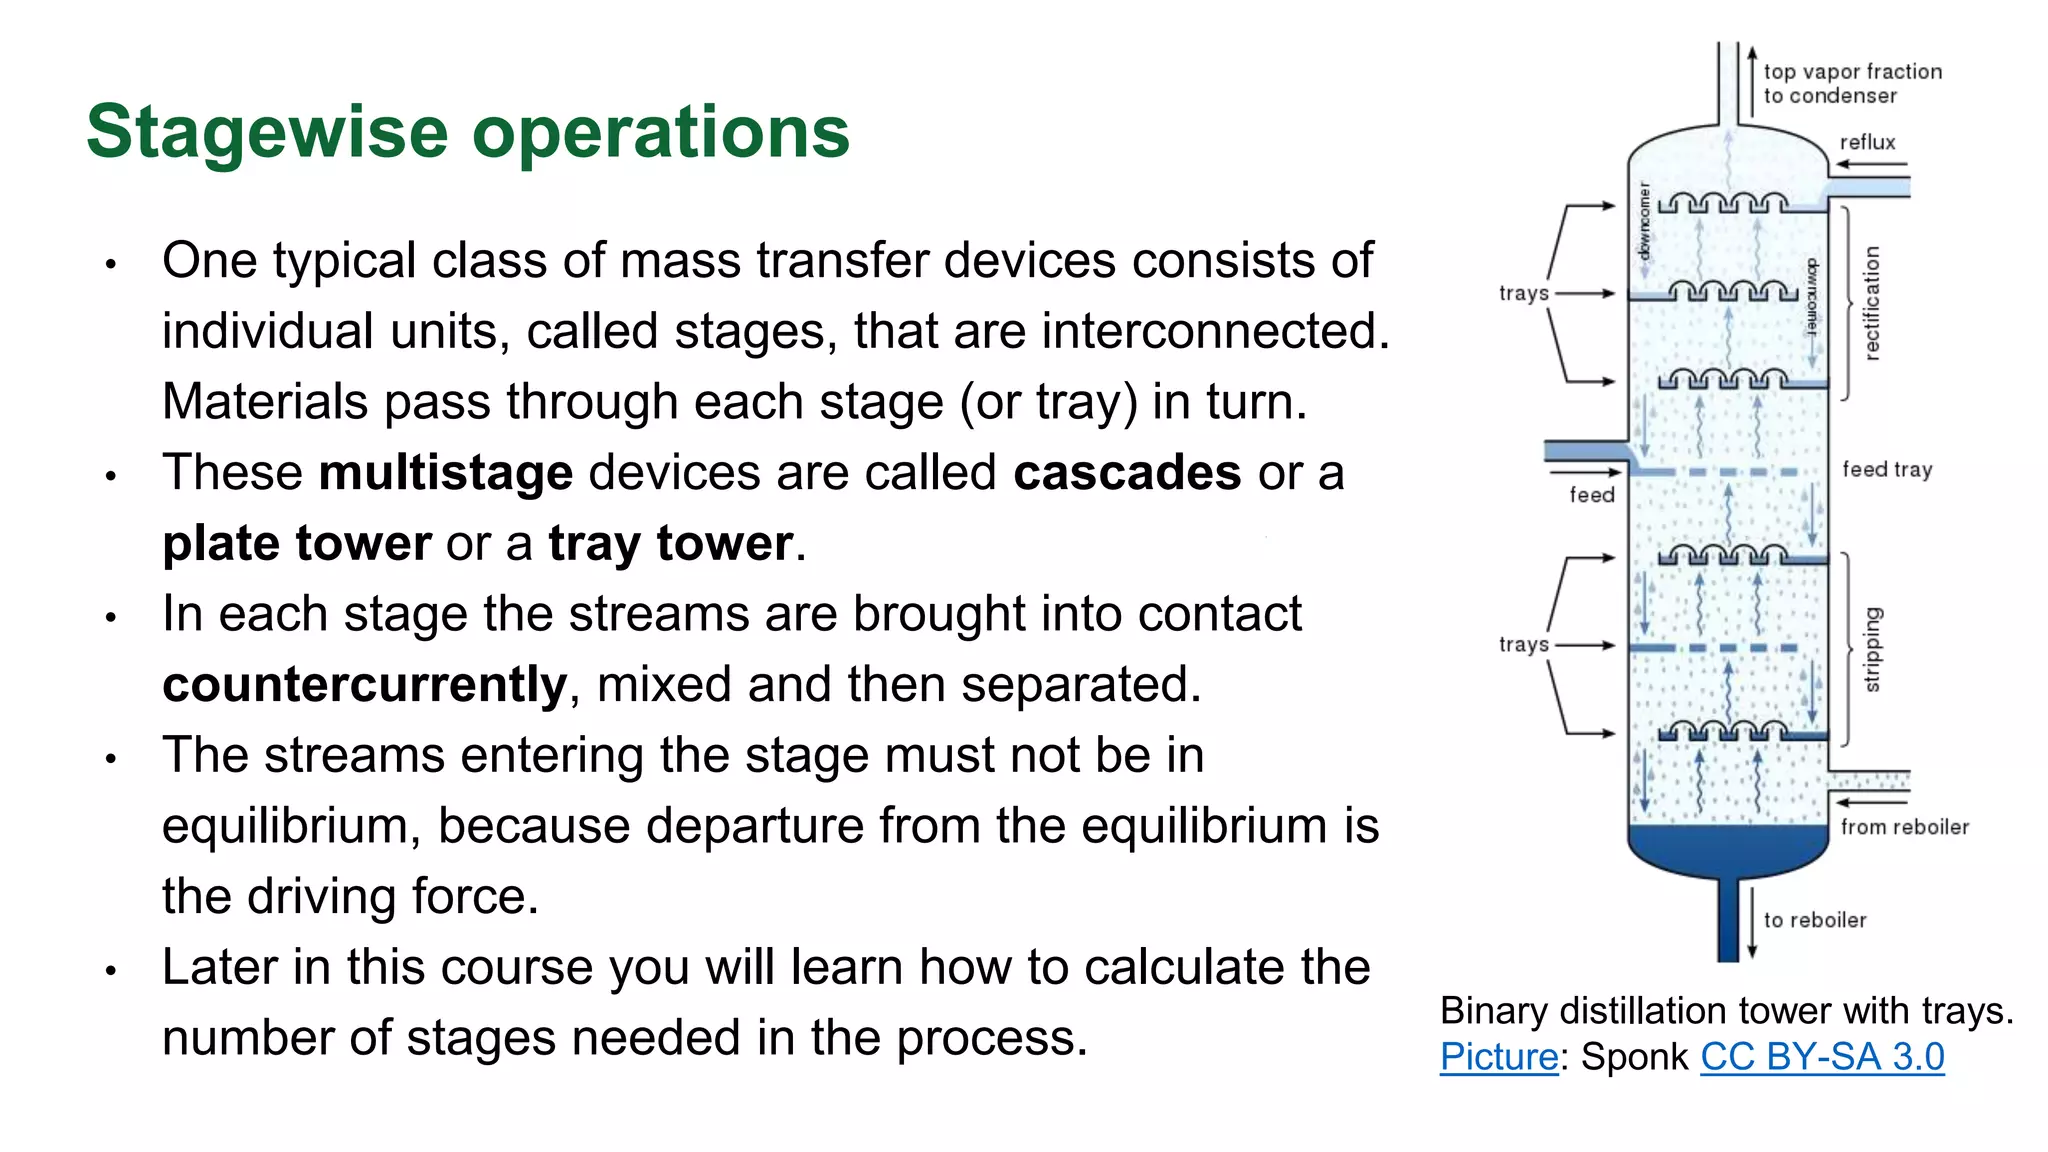
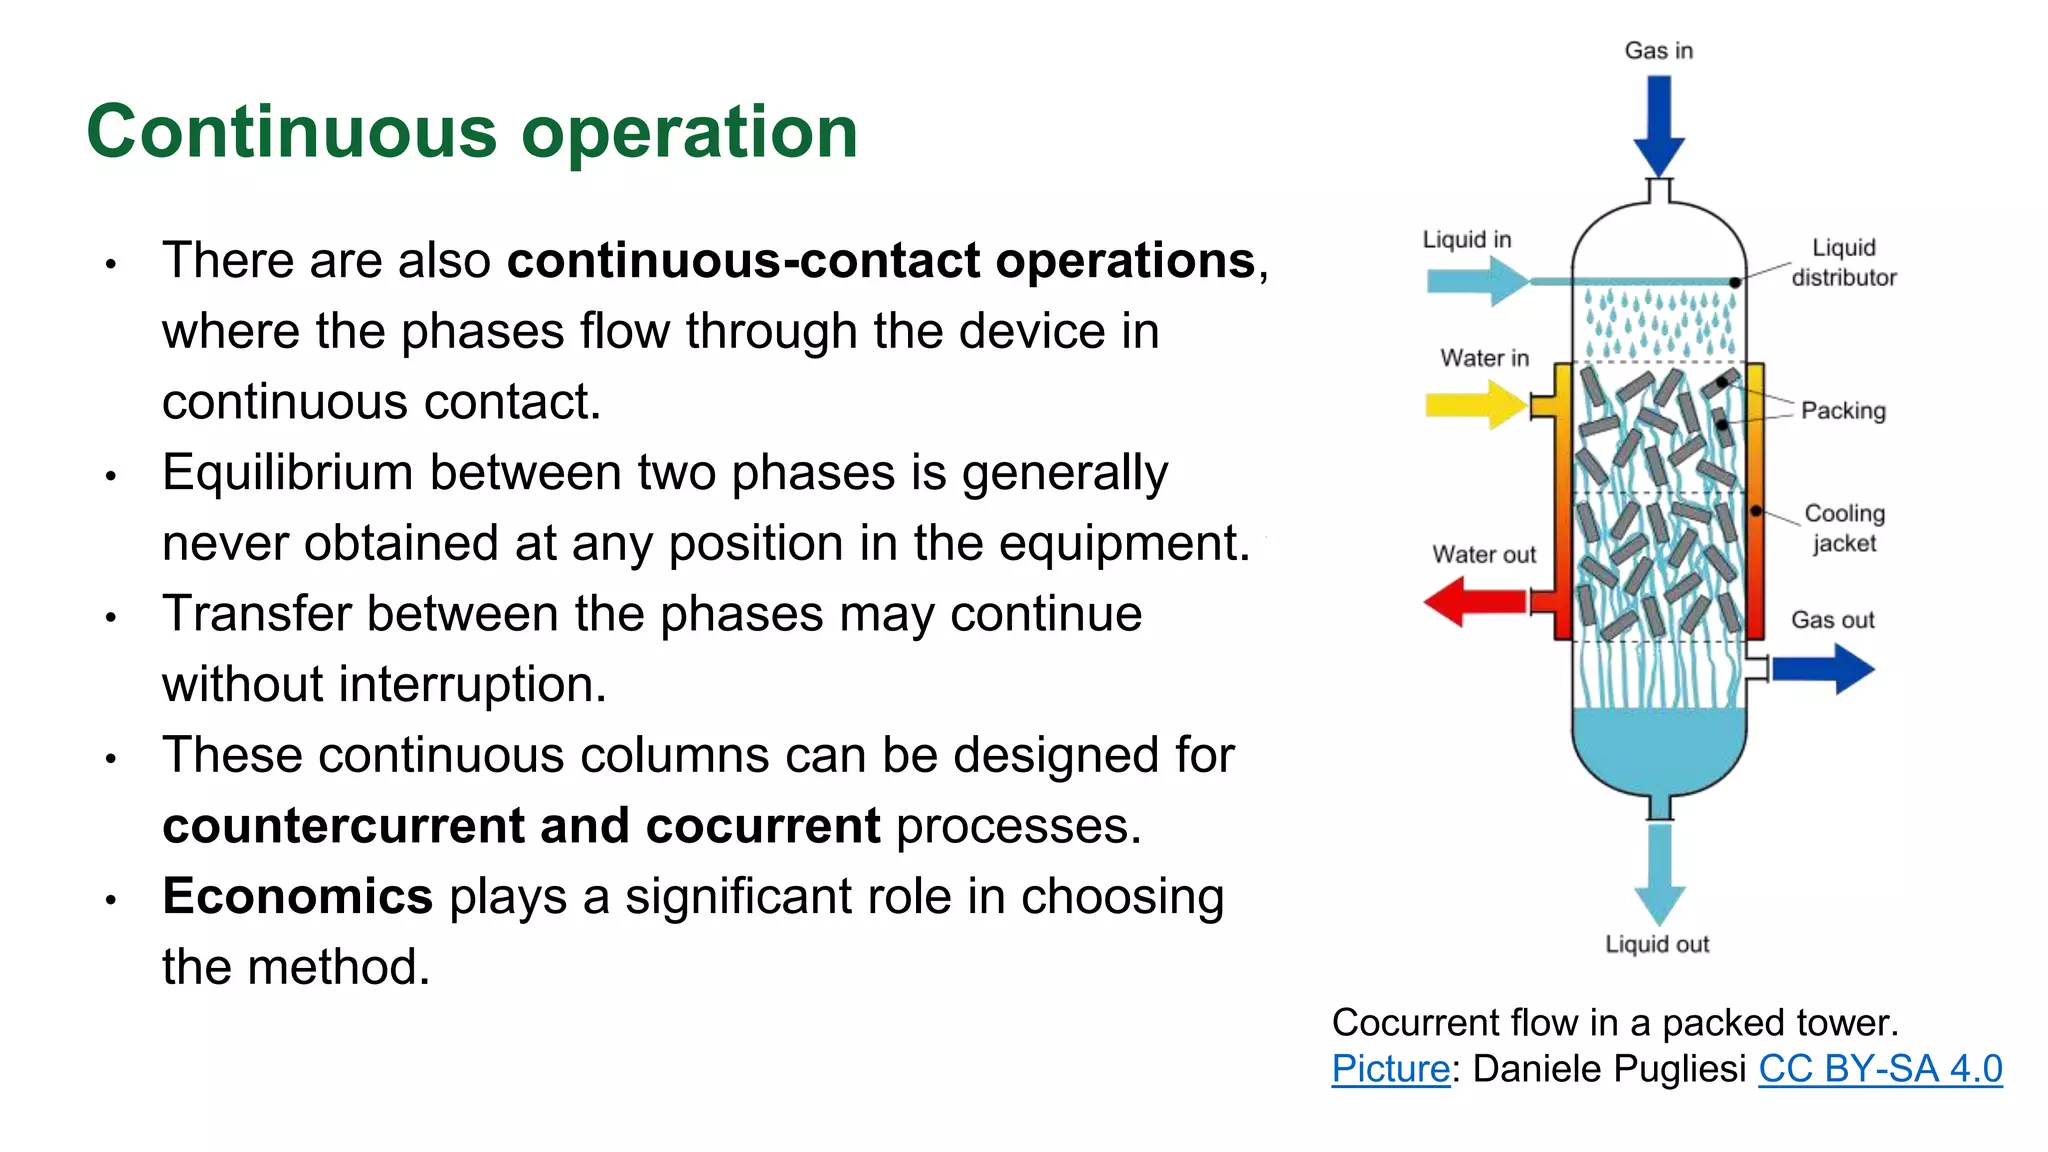
This project has received funding from the European Union’s Horizon 2020
research and innovation programme under grant agreement No 869993.
Mass transfer
design
principles
Steady-state vs unsteady-state operations
• Mass transfer processes can be steady-state or unsteady state operations.
Steady-state operation Unsteady-state operation
No change in conditions (pressure,
temperature, composition, etc.) with
time at any given point in the system
Conditions vary with the passage of time
No change in rates of flow with time
at any given point in the system
Rate of flow is not steady with time
Continuous processes are often
steady-state operations
Batch processes are always unsteady-
state operations
Most industrial processes are
continuous steady-state operations
Many procedures carried out in laboratory
are unsteady-state operations
Batch processes
• In a batch process, there is no flow
into or out of the system. Given
quantity of matter is placed in a
container and the process is
carried out.
• For example, in batch distillation
the flow rates vary with time. At
first, the rate of distillate is low.
Then it increases and in the end of
the process, decreases again. The
temperature may also vary with
time.
Process flow diagram of batch distillation.
Picture: Body kumar2805 CC BY-SA 4.0
Continuous processes
• In a continuous process, materials are fed
continuously into the system.
• Flow rates and compositions do not vary
with time.
• For example, in continuous distillation, the
flow rate and composition of reflux stay
the same all the time. Also the feed has
stagnant values of composition,
temperature, pressure and the rate of flow.
• Most industrial processes are continuous
steady-state operations like this. Continuous binary distillation.
Picture: Sponk CC BY-SA 3.0
Flow patterns
• Mass transfer processes can be simplified with flow
patterns. They help to calculate material balances.
• There are some established practices for notations:
• L is the term for the flow of the liquid phase.
• The terms G and V are commonly used for the flow of
the gas phase. Unit is mole/time.
• Small x is for mole fraction of solute in liquid phase.
• Small y is for mole fraction of solute in gas phase.
• Different mass transfer operations have also some
specific notations. E.g. in distillation we use F for the
flow rate of the feed and z for the mole fraction of the
solute in the feed .
Simple single-stage
process.
y1, V1 x1, L1
y2, V2 x2, L2
Countercurrent, cocurrent and crosscurrent flow
• In countercurrent
process, the contacted
phases flow in
opposite directions.
y1, V1 x1, L1
y2, V2 x2, L2
y1, V1 x1, L1
y2, V2 x2, L2
• In cocurrent process,
the flows are parallel.
• In crosscurrent
process, the phases
flow at right angles
to each other.
y1, V1
x1, L1
y2, V2
x2, L2
Material balances
V1 + L2 = V2 + L1
y1V1 + x2L2 = y2V2 + x1L1
y1, V1 x1, L1
y2, V2 x2, L2
y1, V1
x1, L1
y2, V2
x2, L2
V1 + L1 = V2 + L2
y1V1 + x1L1 = y2V2 + x2L2
V1 + L1 = V2 + L2
y1V1 + x1L1 = y2V2 + x2L2
• Material balances can be used to monitor the process. At steady state, the
input flow = output flow. We can write an overall mass balances and
componential balances. Here are simple examples in different types of flow.
y1, V1 x1, L1
y2, V2 x2, L2
Counter-
current
flow
Cocurrent
flow
Cross-
current
flow
Operating line
• Operating line is a graphical representation of the material balance.
• Let’s assume an example of steady-state cocurrent operation where mass
transfer of a single component occurs from phase V (or G) to phase L.
• Then y1 > y2 and x1 < x2
• Let’s also assume that V1 = V2 and L1 = L2 and mark them as V and L.
y1
y2
x1 x2
Operating line
Slope = −L/V
Equilibrium
curve
y1, V1 x1, L1
y2, V2 x2, L2
Cocurrent
flow
y1V1 + x1L1 = y2V2 + x2L2
V1 = V2 = V and L1 = L2 = L
y1V + x1L = y2V + x2L
V(y1 − y2) = L(x2 − x1)
𝑦1 − 𝑦2
𝑥2 − 𝑥1
=
𝐿
𝑉
⇒
𝑦1 − 𝑦2
𝑥1 − 𝑥2
= −
𝐿
𝑉
Operating line in a countercurrent operation
• If we have a countercurrent operation, the slope of the operating line is L/V.
• Let’s assume that a single component transfers from phase V to phase L.
• Then y1 > y2 and x1 > x2
• If transfer would occur from liquid to gas phase, the operating line would be
located below the equilibrium line.
y1
y2
x2 x1
Operating line
Slope = L/V
Equilibrium
curve
y1V1 + x2L2 = y2V2 + x1L1
V1 = V2 = V and L1 = L2 = L
y1V + x1L = y2V + x2L
V(y1 − y2) = L(x1 − x2)
𝑦1 − 𝑦2
𝑥1 − 𝑥2
=
𝐿
𝑉
y1, V1 x1, L1
y2, V2 x2, L2
Counter-
current
flow
Mole ratios in operating diagrams
• To reduce the curvature of the operating line, the mole ratios X and Y can be
used instead of mole fractions x and y.
• You can change the mole fractions into mole ratios by these equations:
• When we use mole ratios, the flows are expressed in a solute-free basis:
Ls and Vs (or Gs). (L’, V’ and G’ are also used.)
• Cocurrent operation: Vs(Y1 − Y2) = Ls(X2 − X1)  Slope = −Ls/Vs
• Countercurrent operation: Vs(Y1 − Y2) = Ls(X1 − X2)  Slope = Ls/Vs
• If we have dilute solutions, there is no big difference between mole ratios and
mole fractions.
𝑋𝑖 =
𝑥𝑖
1 − 𝑥𝑖
𝑌𝑖 =
𝑦𝑖
1 − 𝑦𝑖
Stagewise operations
• One typical class of mass transfer devices consists of
individual units, called stages, that are interconnected.
Materials pass through each stage (or tray) in turn.
• These multistage devices are called cascades or a
plate tower or a tray tower.
• In each stage the streams are brought into contact
countercurrently, mixed and then separated.
• The streams entering the stage must not be in
equilibrium, because departure from the equilibrium is
the driving force.
• Later in this course you will learn how to calculate the
number of stages needed in the process.
Binary distillation tower with trays.
Picture: Sponk CC BY-SA 3.0
Continuous operation
• There are also continuous-contact operations,
where the phases flow through the device in
continuous contact.
• Equilibrium between two phases is generally
never obtained at any position in the equipment.
• Transfer between the phases may continue
without interruption.
• These continuous columns can be designed for
countercurrent and cocurrent processes.
• Economics plays a significant role in choosing
the method.
Cocurrent flow in a packed tower.
Picture: Daniele Pugliesi CC BY-SA 4.0
Summary
• Most industrial mass transfer processes
are steady-state, continuous operations.
• Mass transfer operations can be
simplified by flow diagrams.They also
help in calculations of material balances.
• Operating line is a graphical
representation for material balance.
• There are two types of how the phases
are brought into contact in the column:
stagewise contact or continuous-contact.
Common notations in
calculations and diagrams:
L = liquid flow (mole/time)
G or V = gas flow (mole/time)
x = mole fraction of the solute
in liquid phase
y = mole fraction of the solute
in gas phase
X = mole ratio of the solute in
liquid phase
Y = mole ratio of the solute in
liquid phase
Ls and Vs or L’ and V’ for
flows in solute-free basis
This project has received funding from the European Union’s Horizon 2020
research and innovation programme under grant agreement No 869993.
References
Benitez, J. 2016. Principles and Modern Applications of Mass Transfer Operations. Wiley, pp. 179-
206.
Dutta, B. K. 2007. Principles of mass transfer and separation processes. New Delhi: Prentice-Hall,
pp. 143.
Theodore, L. & Ricci, F. 2010. Mass Transfer Operations for the Practicing Engineer. John Wiley &
Sons, Inc, pp. 107-117.
Videos:
• Binary flash distillation example: https://youtu.be/_fsFG3NspsE
• Operation of an absorption column: https://youtu.be/NhPqSWUrGsg

Design principles in mass transfer processes

  • 1.
    This project hasreceived funding from the European Union’s Horizon 2020 research and innovation programme under grant agreement No 869993. Mass transfer design principles
  • 2.
    Steady-state vs unsteady-stateoperations • Mass transfer processes can be steady-state or unsteady state operations. Steady-state operation Unsteady-state operation No change in conditions (pressure, temperature, composition, etc.) with time at any given point in the system Conditions vary with the passage of time No change in rates of flow with time at any given point in the system Rate of flow is not steady with time Continuous processes are often steady-state operations Batch processes are always unsteady- state operations Most industrial processes are continuous steady-state operations Many procedures carried out in laboratory are unsteady-state operations
  • 3.
    Batch processes • Ina batch process, there is no flow into or out of the system. Given quantity of matter is placed in a container and the process is carried out. • For example, in batch distillation the flow rates vary with time. At first, the rate of distillate is low. Then it increases and in the end of the process, decreases again. The temperature may also vary with time. Process flow diagram of batch distillation. Picture: Body kumar2805 CC BY-SA 4.0
  • 4.
    Continuous processes • Ina continuous process, materials are fed continuously into the system. • Flow rates and compositions do not vary with time. • For example, in continuous distillation, the flow rate and composition of reflux stay the same all the time. Also the feed has stagnant values of composition, temperature, pressure and the rate of flow. • Most industrial processes are continuous steady-state operations like this. Continuous binary distillation. Picture: Sponk CC BY-SA 3.0
  • 5.
    Flow patterns • Masstransfer processes can be simplified with flow patterns. They help to calculate material balances. • There are some established practices for notations: • L is the term for the flow of the liquid phase. • The terms G and V are commonly used for the flow of the gas phase. Unit is mole/time. • Small x is for mole fraction of solute in liquid phase. • Small y is for mole fraction of solute in gas phase. • Different mass transfer operations have also some specific notations. E.g. in distillation we use F for the flow rate of the feed and z for the mole fraction of the solute in the feed . Simple single-stage process. y1, V1 x1, L1 y2, V2 x2, L2
  • 6.
    Countercurrent, cocurrent andcrosscurrent flow • In countercurrent process, the contacted phases flow in opposite directions. y1, V1 x1, L1 y2, V2 x2, L2 y1, V1 x1, L1 y2, V2 x2, L2 • In cocurrent process, the flows are parallel. • In crosscurrent process, the phases flow at right angles to each other. y1, V1 x1, L1 y2, V2 x2, L2
  • 7.
    Material balances V1 +L2 = V2 + L1 y1V1 + x2L2 = y2V2 + x1L1 y1, V1 x1, L1 y2, V2 x2, L2 y1, V1 x1, L1 y2, V2 x2, L2 V1 + L1 = V2 + L2 y1V1 + x1L1 = y2V2 + x2L2 V1 + L1 = V2 + L2 y1V1 + x1L1 = y2V2 + x2L2 • Material balances can be used to monitor the process. At steady state, the input flow = output flow. We can write an overall mass balances and componential balances. Here are simple examples in different types of flow. y1, V1 x1, L1 y2, V2 x2, L2 Counter- current flow Cocurrent flow Cross- current flow
  • 8.
    Operating line • Operatingline is a graphical representation of the material balance. • Let’s assume an example of steady-state cocurrent operation where mass transfer of a single component occurs from phase V (or G) to phase L. • Then y1 > y2 and x1 < x2 • Let’s also assume that V1 = V2 and L1 = L2 and mark them as V and L. y1 y2 x1 x2 Operating line Slope = −L/V Equilibrium curve y1, V1 x1, L1 y2, V2 x2, L2 Cocurrent flow y1V1 + x1L1 = y2V2 + x2L2 V1 = V2 = V and L1 = L2 = L y1V + x1L = y2V + x2L V(y1 − y2) = L(x2 − x1) 𝑦1 − 𝑦2 𝑥2 − 𝑥1 = 𝐿 𝑉 ⇒ 𝑦1 − 𝑦2 𝑥1 − 𝑥2 = − 𝐿 𝑉
  • 9.
    Operating line ina countercurrent operation • If we have a countercurrent operation, the slope of the operating line is L/V. • Let’s assume that a single component transfers from phase V to phase L. • Then y1 > y2 and x1 > x2 • If transfer would occur from liquid to gas phase, the operating line would be located below the equilibrium line. y1 y2 x2 x1 Operating line Slope = L/V Equilibrium curve y1V1 + x2L2 = y2V2 + x1L1 V1 = V2 = V and L1 = L2 = L y1V + x1L = y2V + x2L V(y1 − y2) = L(x1 − x2) 𝑦1 − 𝑦2 𝑥1 − 𝑥2 = 𝐿 𝑉 y1, V1 x1, L1 y2, V2 x2, L2 Counter- current flow
  • 10.
    Mole ratios inoperating diagrams • To reduce the curvature of the operating line, the mole ratios X and Y can be used instead of mole fractions x and y. • You can change the mole fractions into mole ratios by these equations: • When we use mole ratios, the flows are expressed in a solute-free basis: Ls and Vs (or Gs). (L’, V’ and G’ are also used.) • Cocurrent operation: Vs(Y1 − Y2) = Ls(X2 − X1)  Slope = −Ls/Vs • Countercurrent operation: Vs(Y1 − Y2) = Ls(X1 − X2)  Slope = Ls/Vs • If we have dilute solutions, there is no big difference between mole ratios and mole fractions. 𝑋𝑖 = 𝑥𝑖 1 − 𝑥𝑖 𝑌𝑖 = 𝑦𝑖 1 − 𝑦𝑖
  • 11.
    Stagewise operations • Onetypical class of mass transfer devices consists of individual units, called stages, that are interconnected. Materials pass through each stage (or tray) in turn. • These multistage devices are called cascades or a plate tower or a tray tower. • In each stage the streams are brought into contact countercurrently, mixed and then separated. • The streams entering the stage must not be in equilibrium, because departure from the equilibrium is the driving force. • Later in this course you will learn how to calculate the number of stages needed in the process. Binary distillation tower with trays. Picture: Sponk CC BY-SA 3.0
  • 12.
    Continuous operation • Thereare also continuous-contact operations, where the phases flow through the device in continuous contact. • Equilibrium between two phases is generally never obtained at any position in the equipment. • Transfer between the phases may continue without interruption. • These continuous columns can be designed for countercurrent and cocurrent processes. • Economics plays a significant role in choosing the method. Cocurrent flow in a packed tower. Picture: Daniele Pugliesi CC BY-SA 4.0
  • 13.
    Summary • Most industrialmass transfer processes are steady-state, continuous operations. • Mass transfer operations can be simplified by flow diagrams.They also help in calculations of material balances. • Operating line is a graphical representation for material balance. • There are two types of how the phases are brought into contact in the column: stagewise contact or continuous-contact. Common notations in calculations and diagrams: L = liquid flow (mole/time) G or V = gas flow (mole/time) x = mole fraction of the solute in liquid phase y = mole fraction of the solute in gas phase X = mole ratio of the solute in liquid phase Y = mole ratio of the solute in liquid phase Ls and Vs or L’ and V’ for flows in solute-free basis
  • 14.
    This project hasreceived funding from the European Union’s Horizon 2020 research and innovation programme under grant agreement No 869993. References Benitez, J. 2016. Principles and Modern Applications of Mass Transfer Operations. Wiley, pp. 179- 206. Dutta, B. K. 2007. Principles of mass transfer and separation processes. New Delhi: Prentice-Hall, pp. 143. Theodore, L. & Ricci, F. 2010. Mass Transfer Operations for the Practicing Engineer. John Wiley & Sons, Inc, pp. 107-117. Videos: • Binary flash distillation example: https://youtu.be/_fsFG3NspsE • Operation of an absorption column: https://youtu.be/NhPqSWUrGsg