


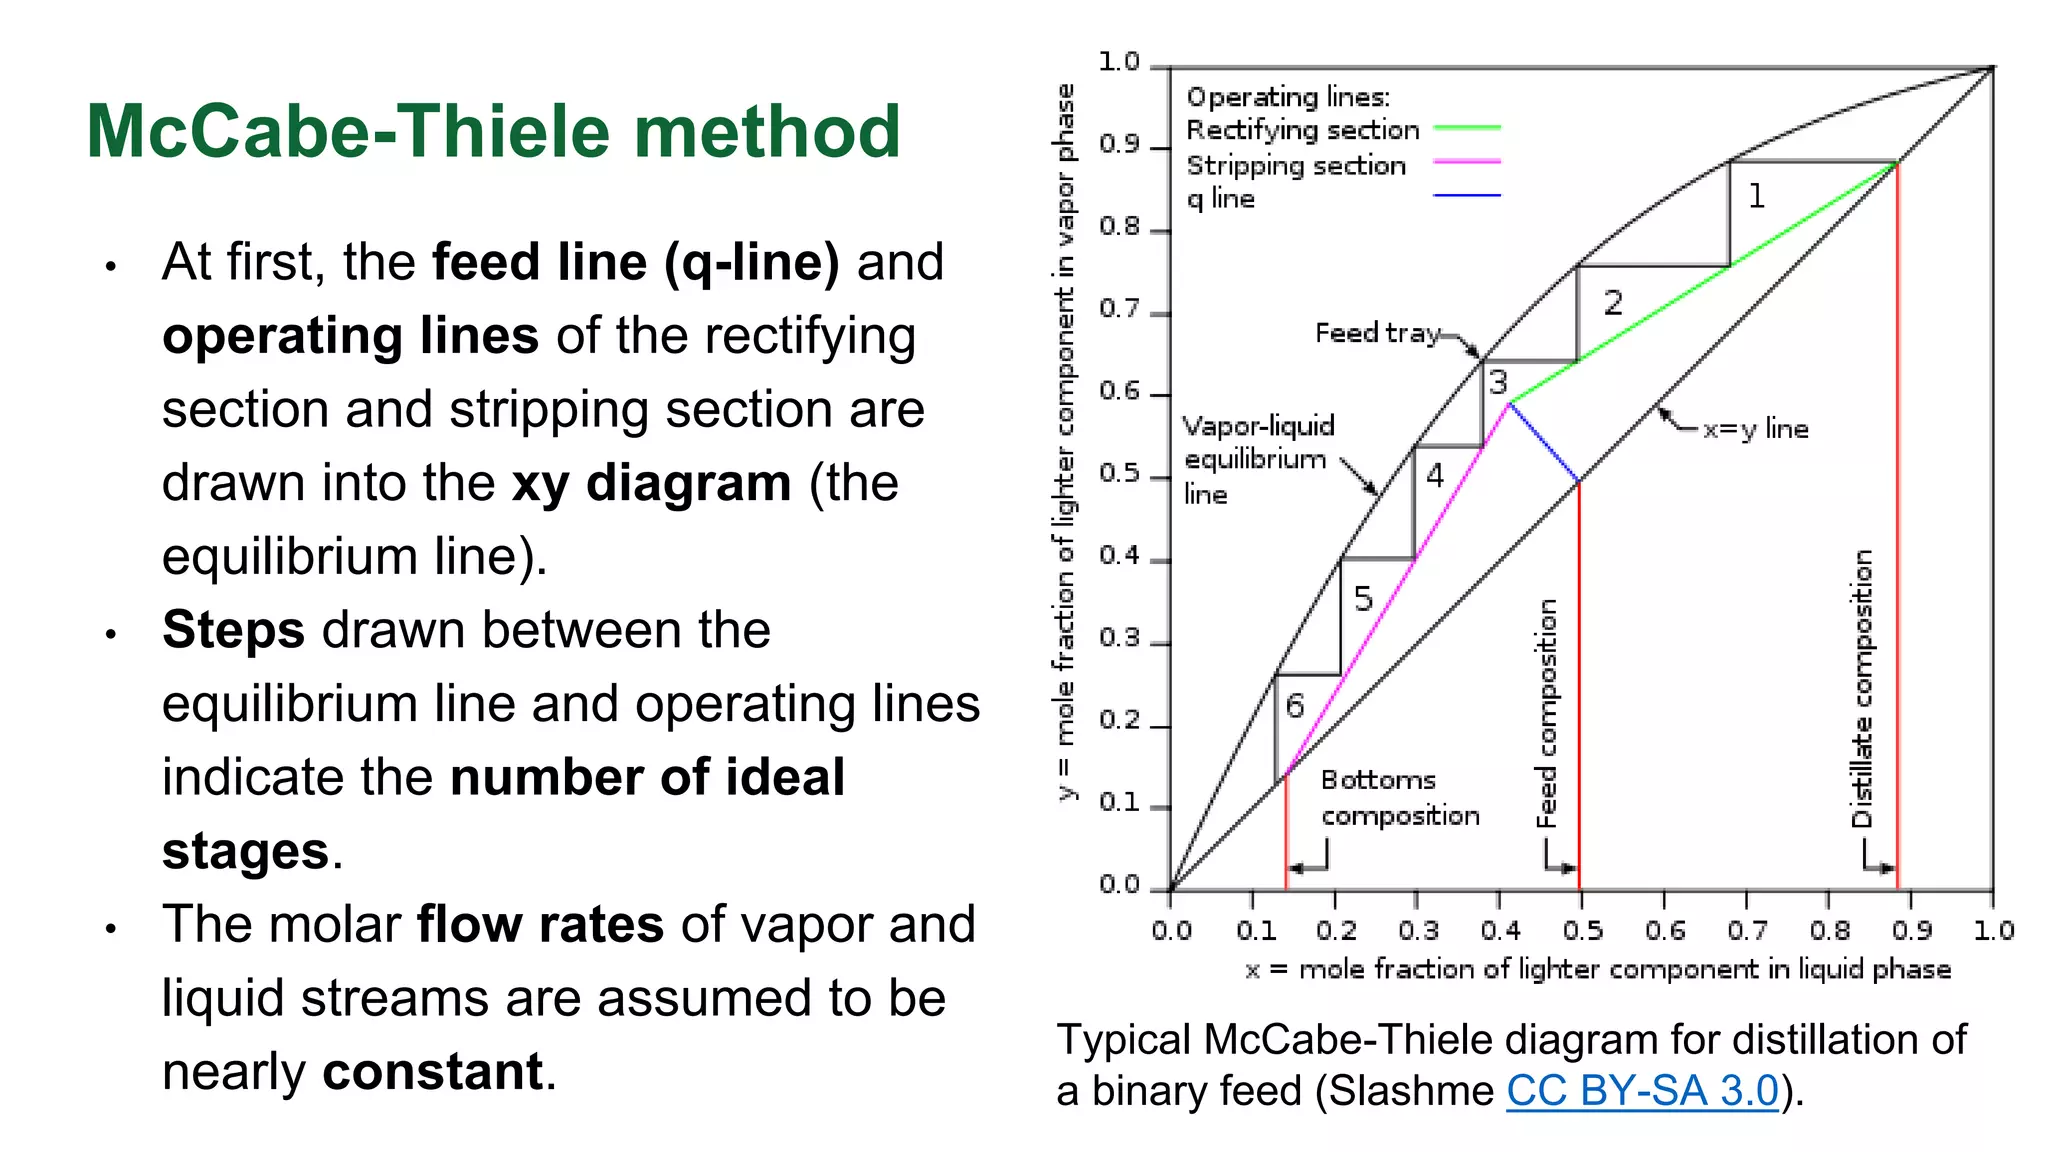


The McCabe-Thiele method is a graphical technique for determining the minimum number of stages required for distillation. It involves plotting the equilibrium relationship between liquid and vapor phases on a diagram and constructing operating lines to represent the mass balances in the rectifying and stripping sections. Intersections between the lines indicate the number of ideal stages. The method was developed in 1925 and remains useful for preliminary column design. Key considerations include the feed composition and enthalpy, reflux ratio, and use of partial condensers or reboilers.


