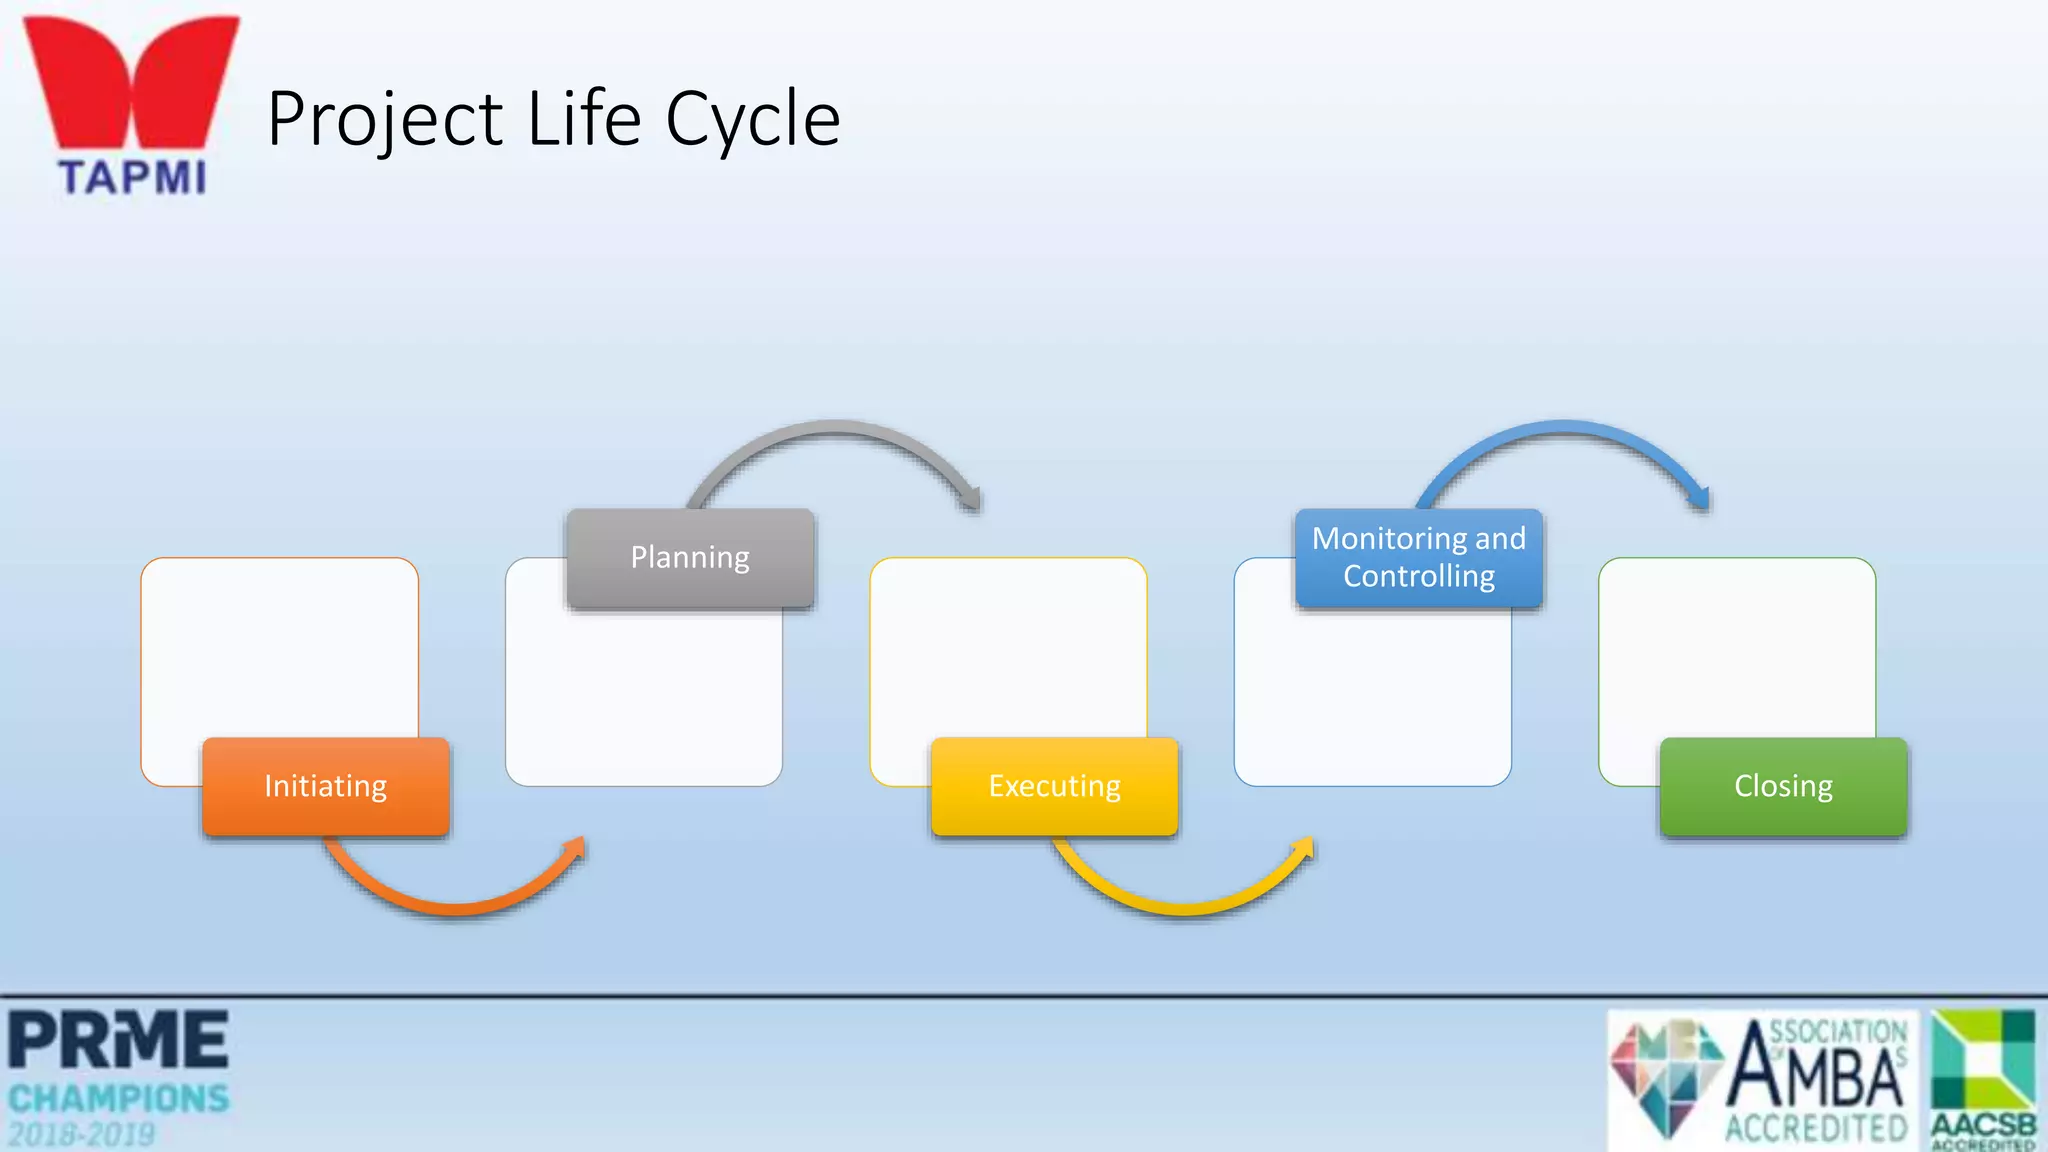
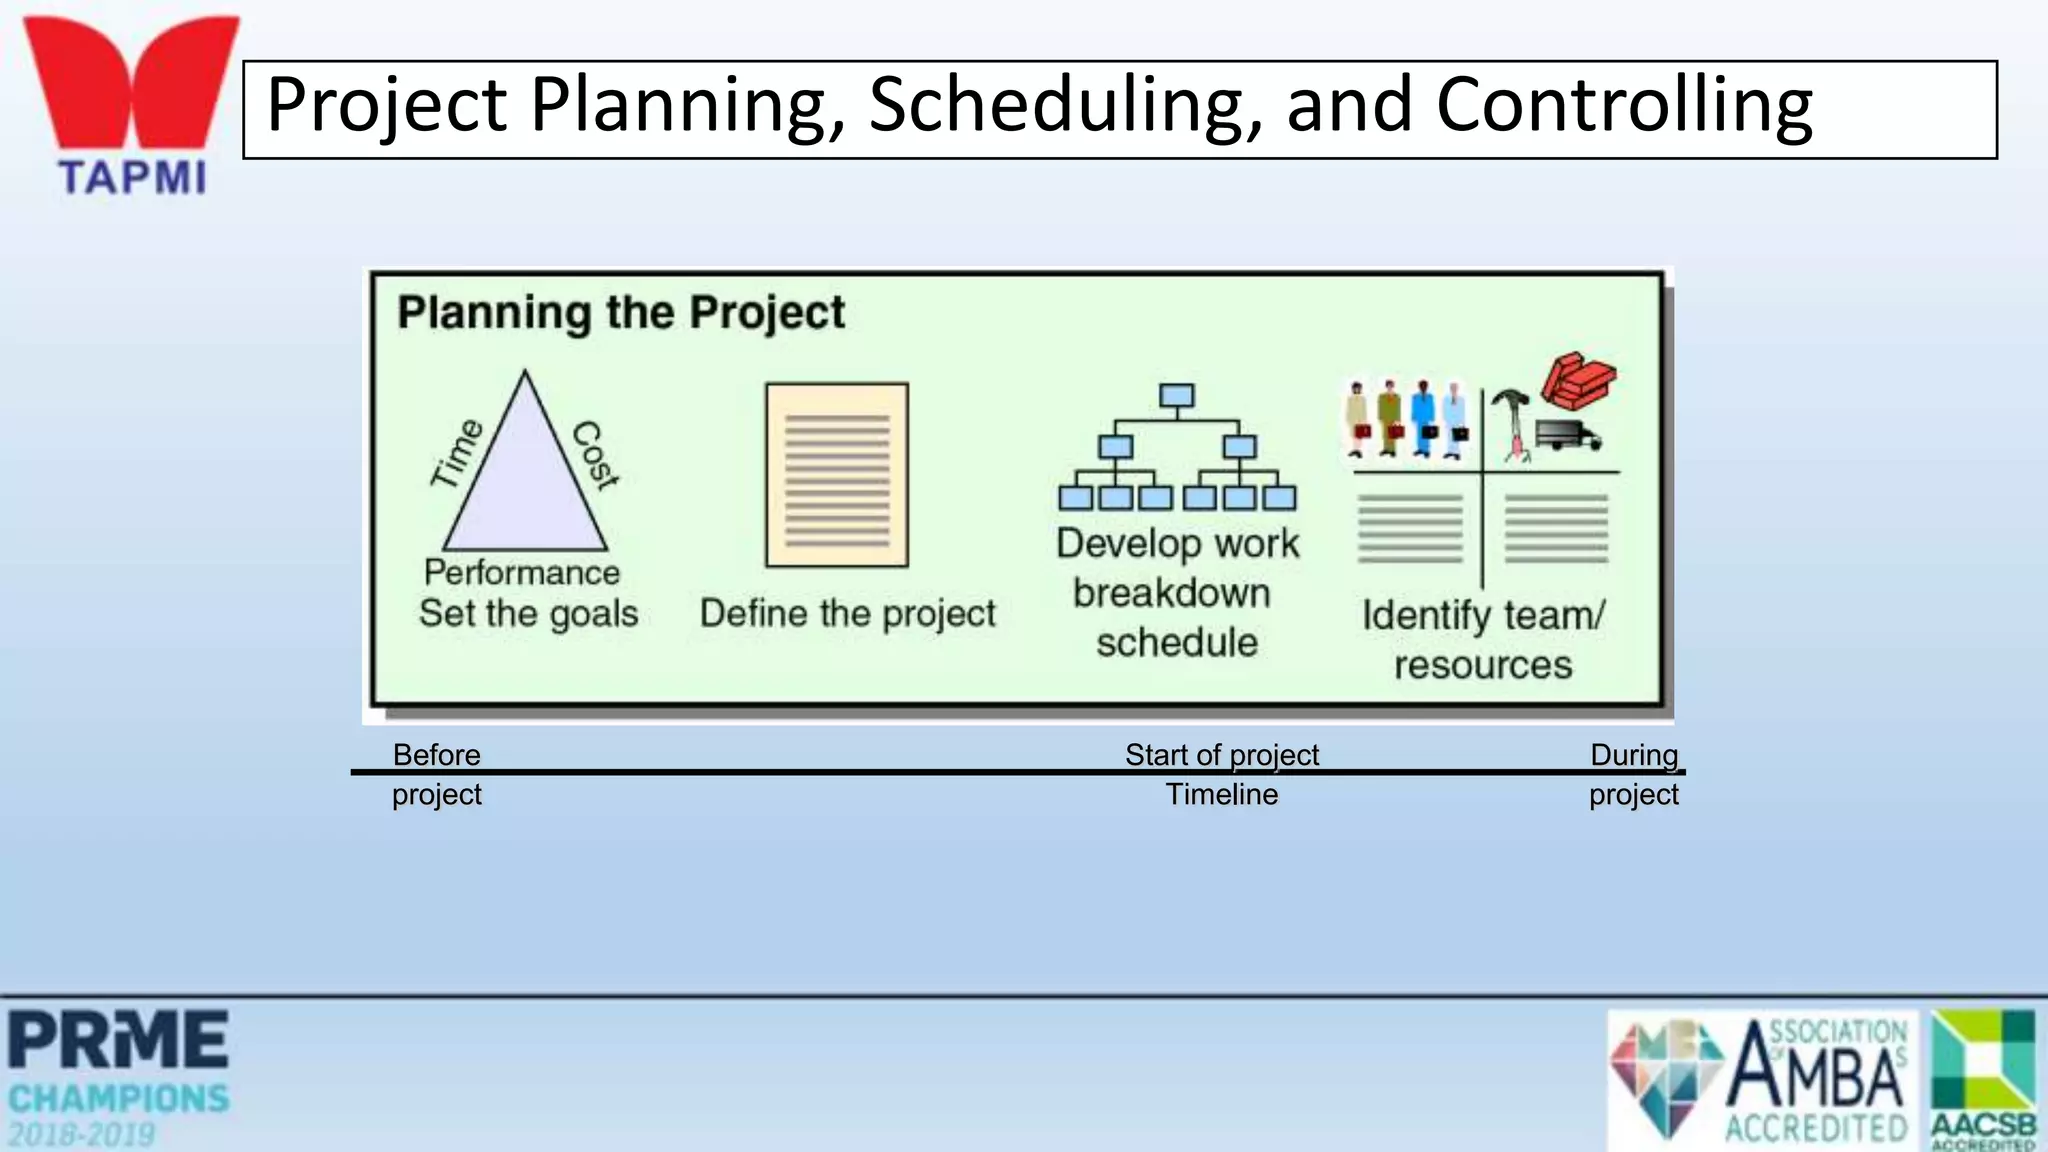
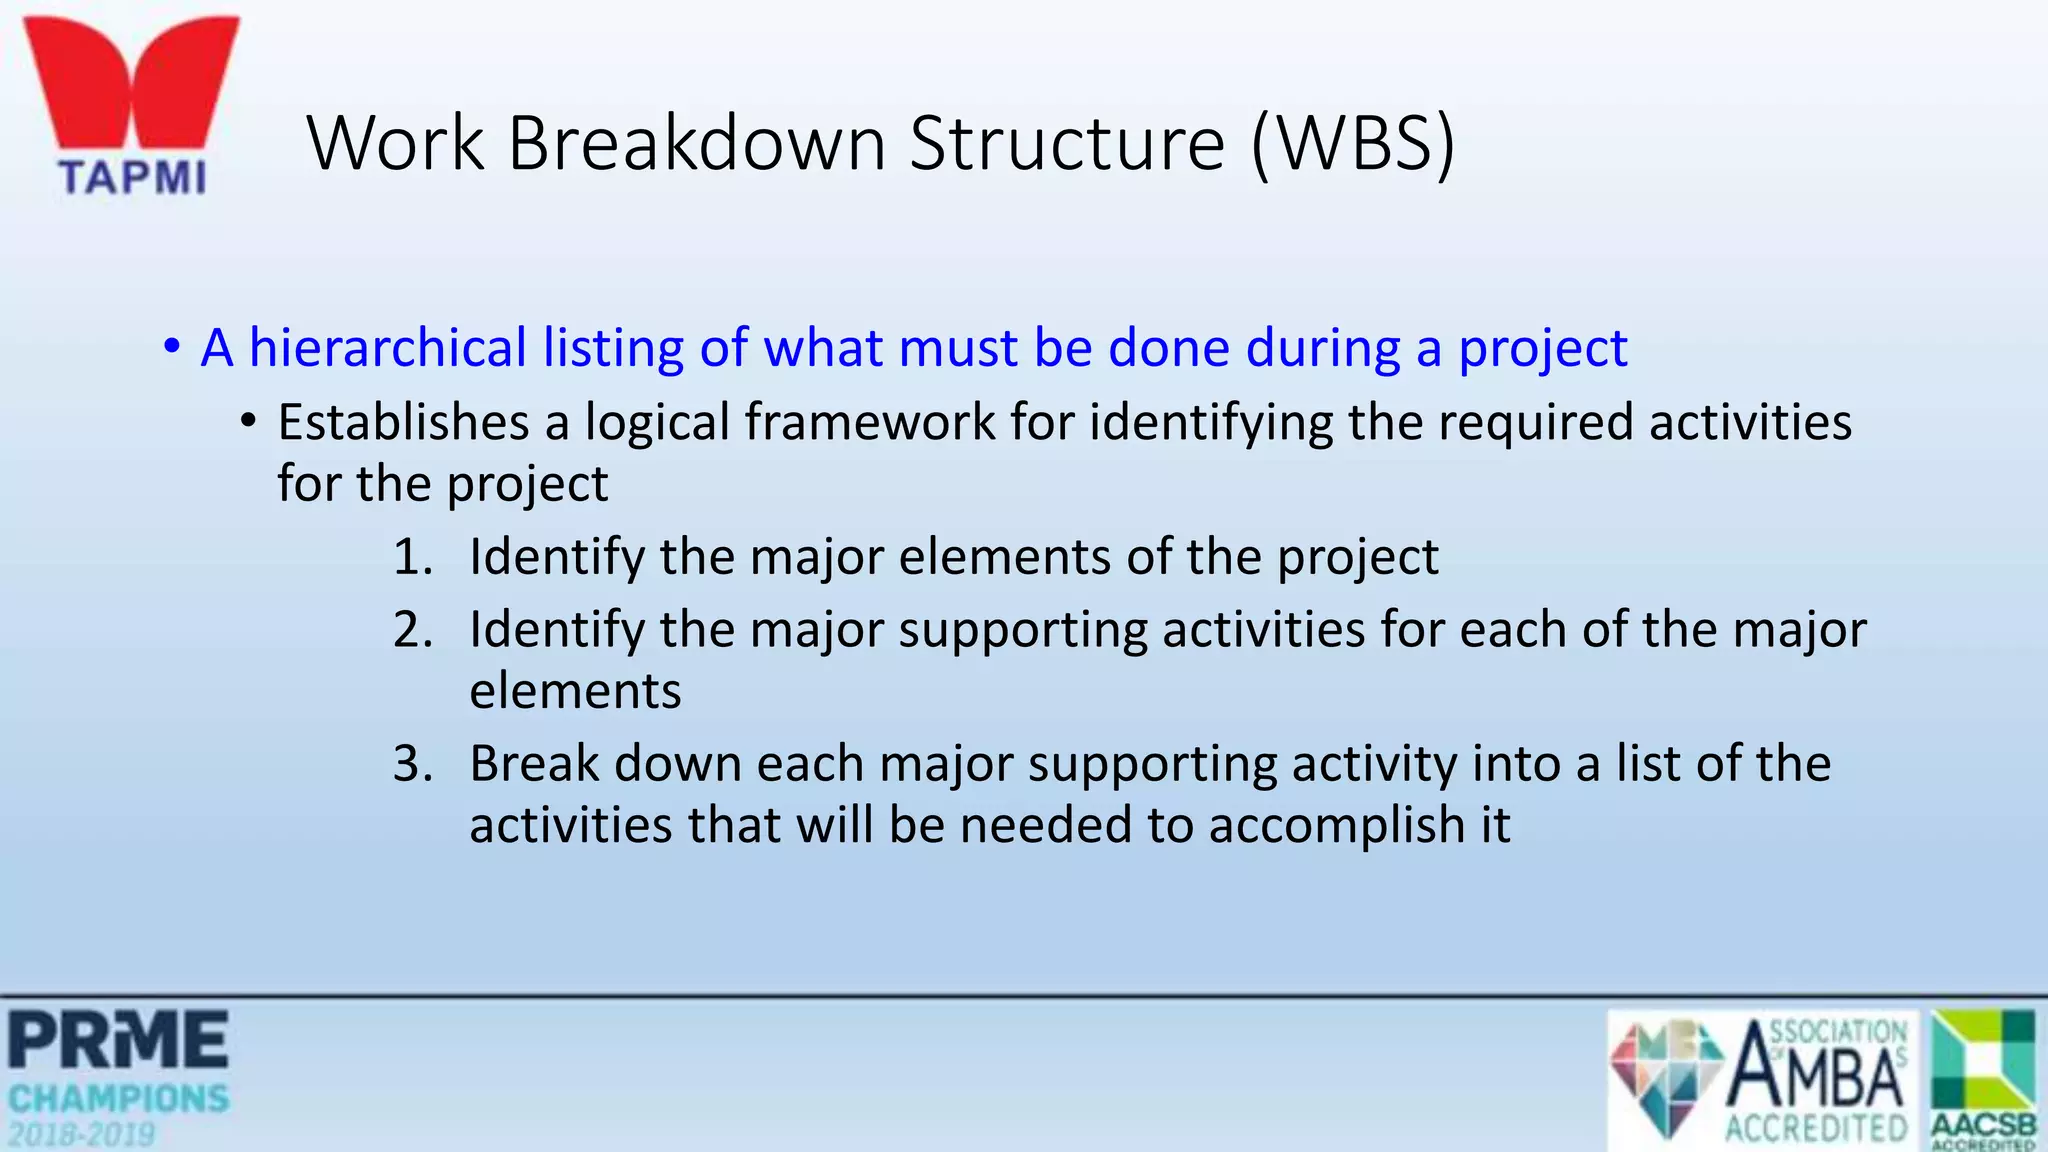
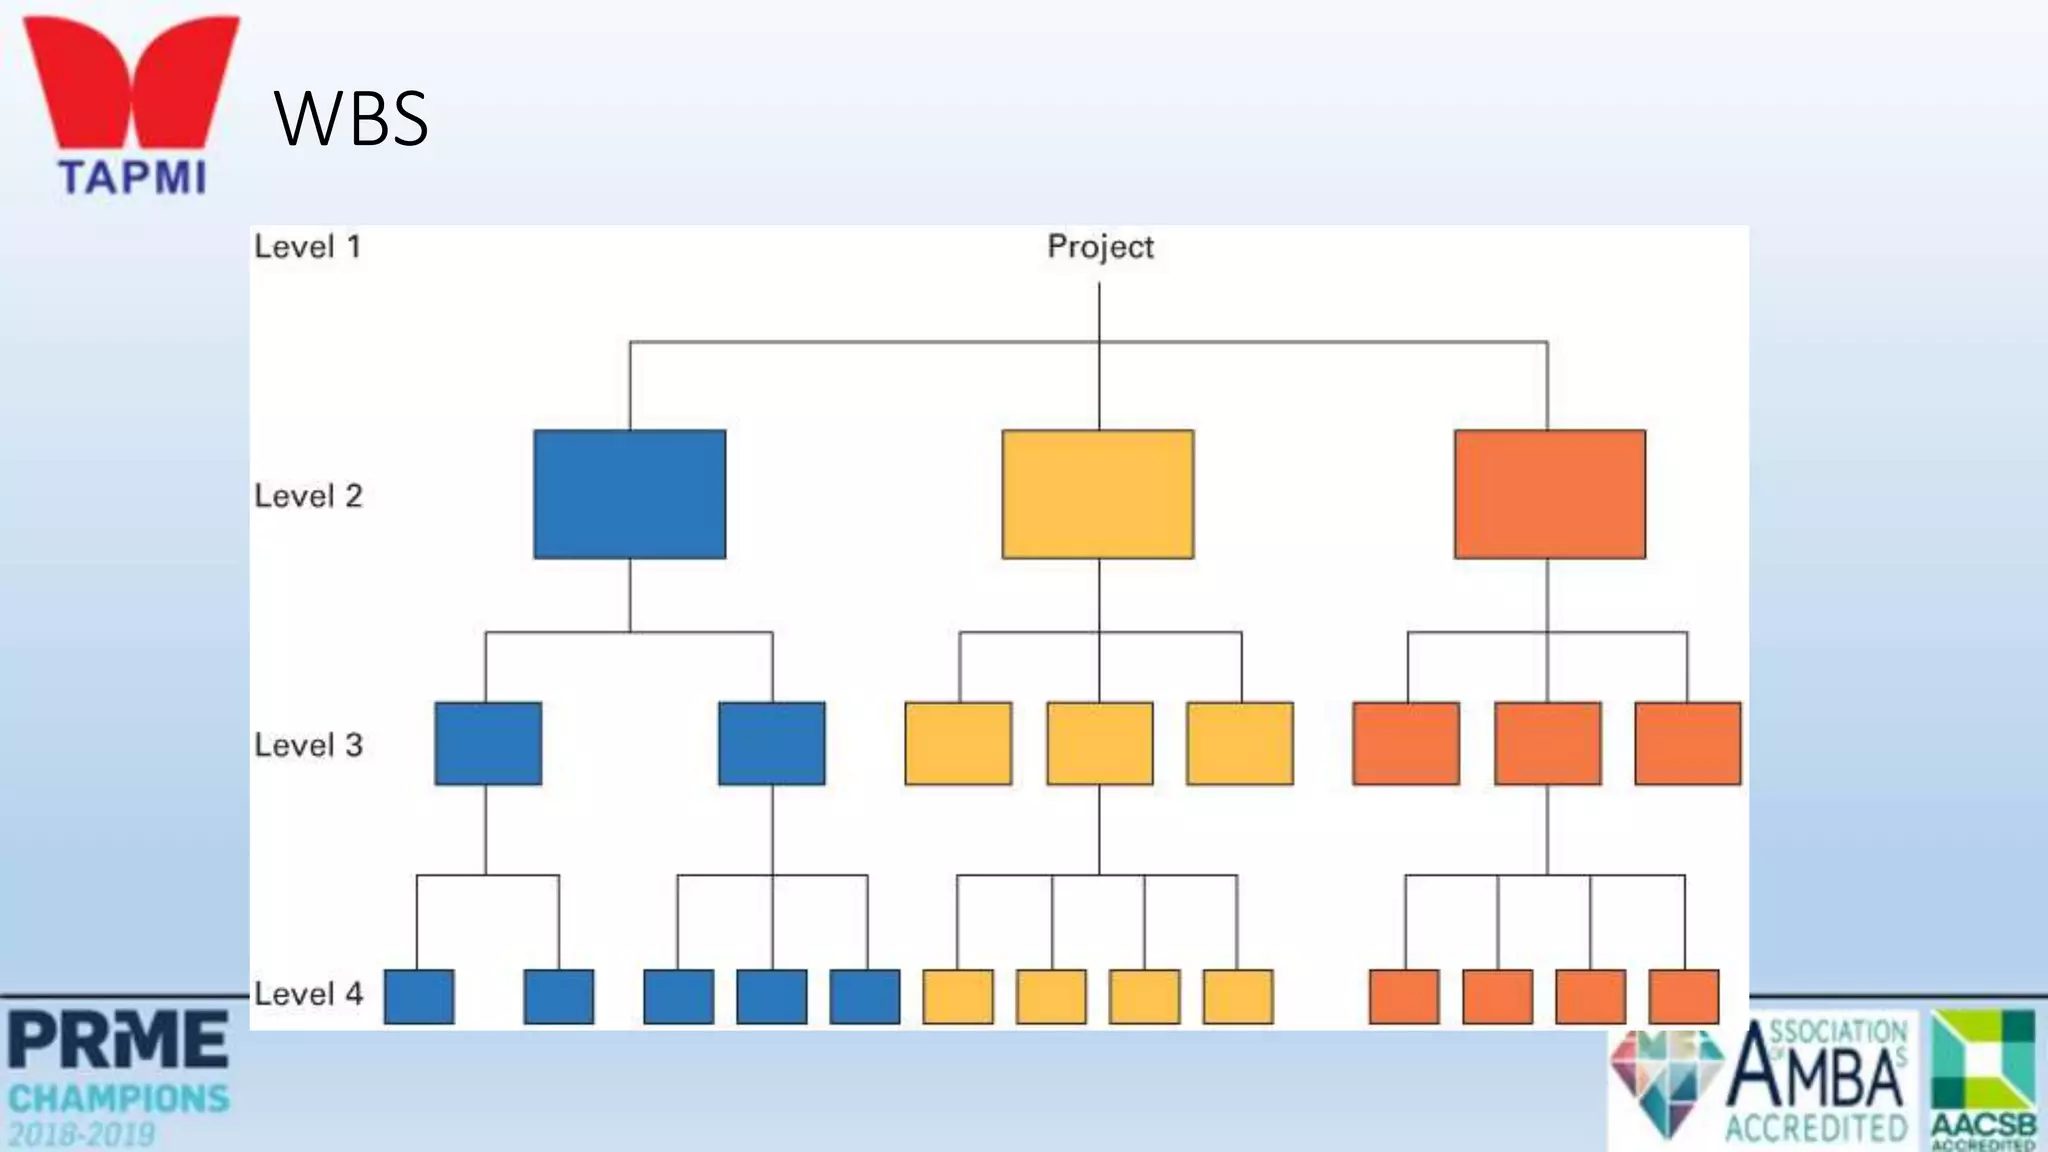
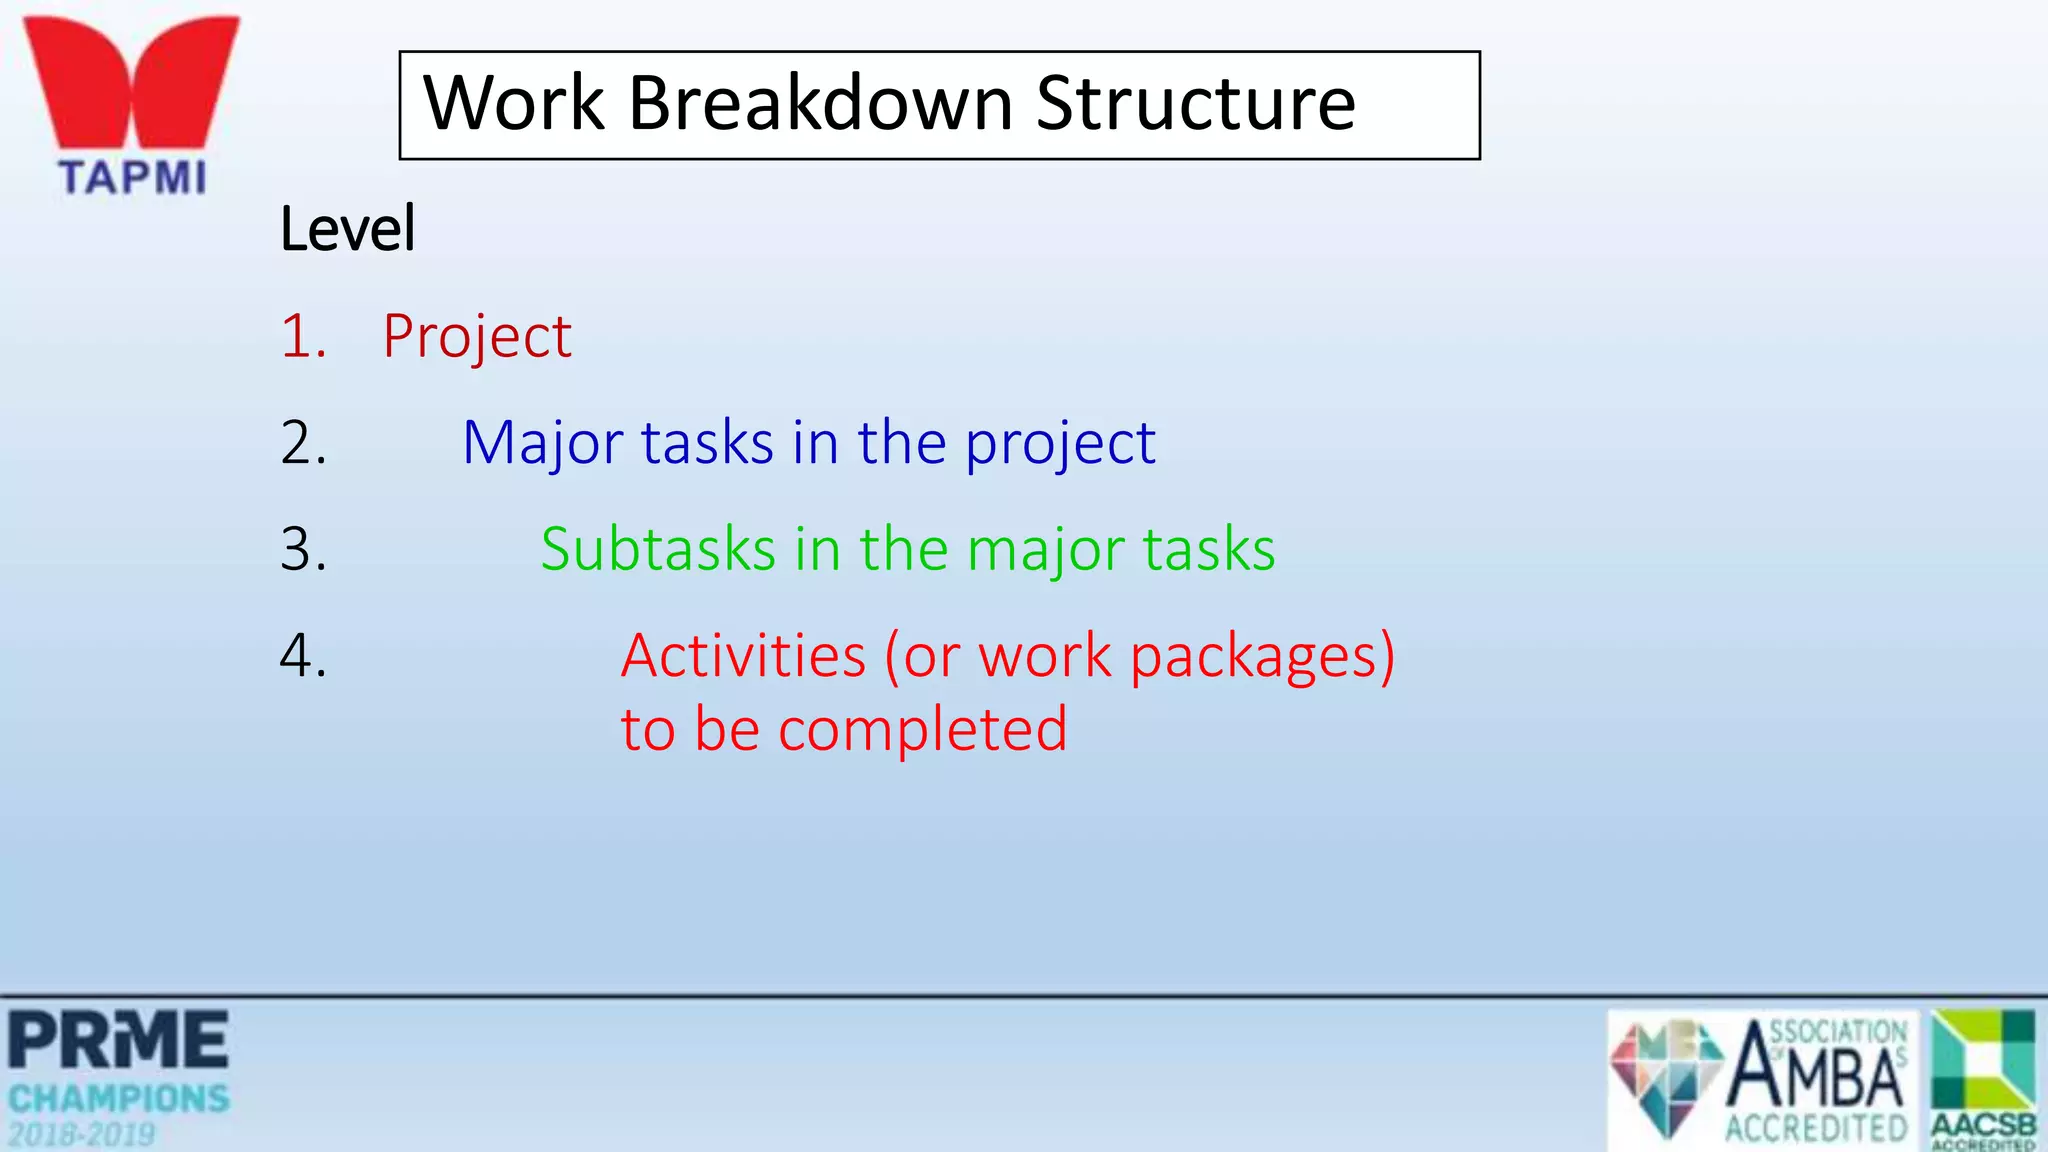
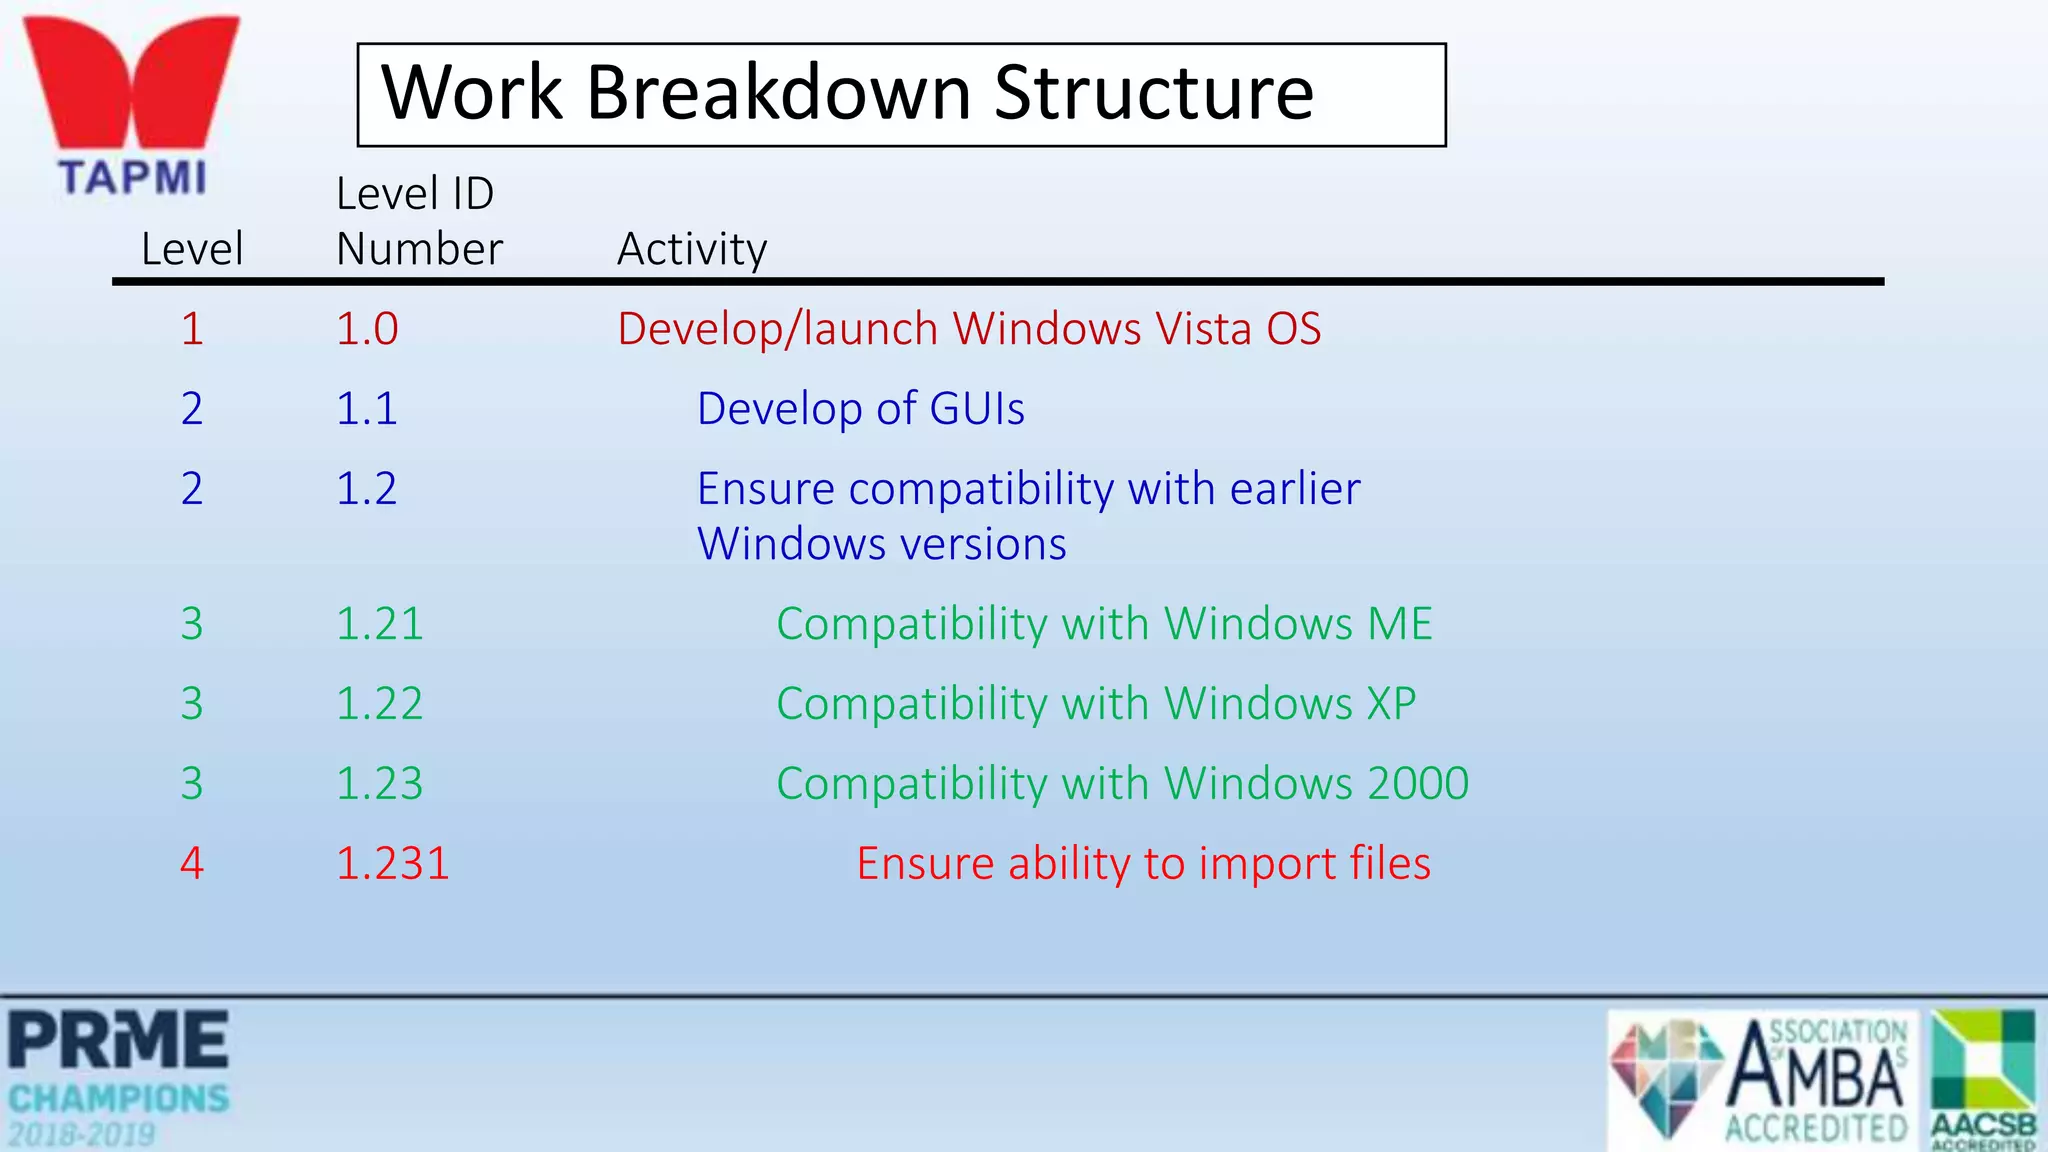
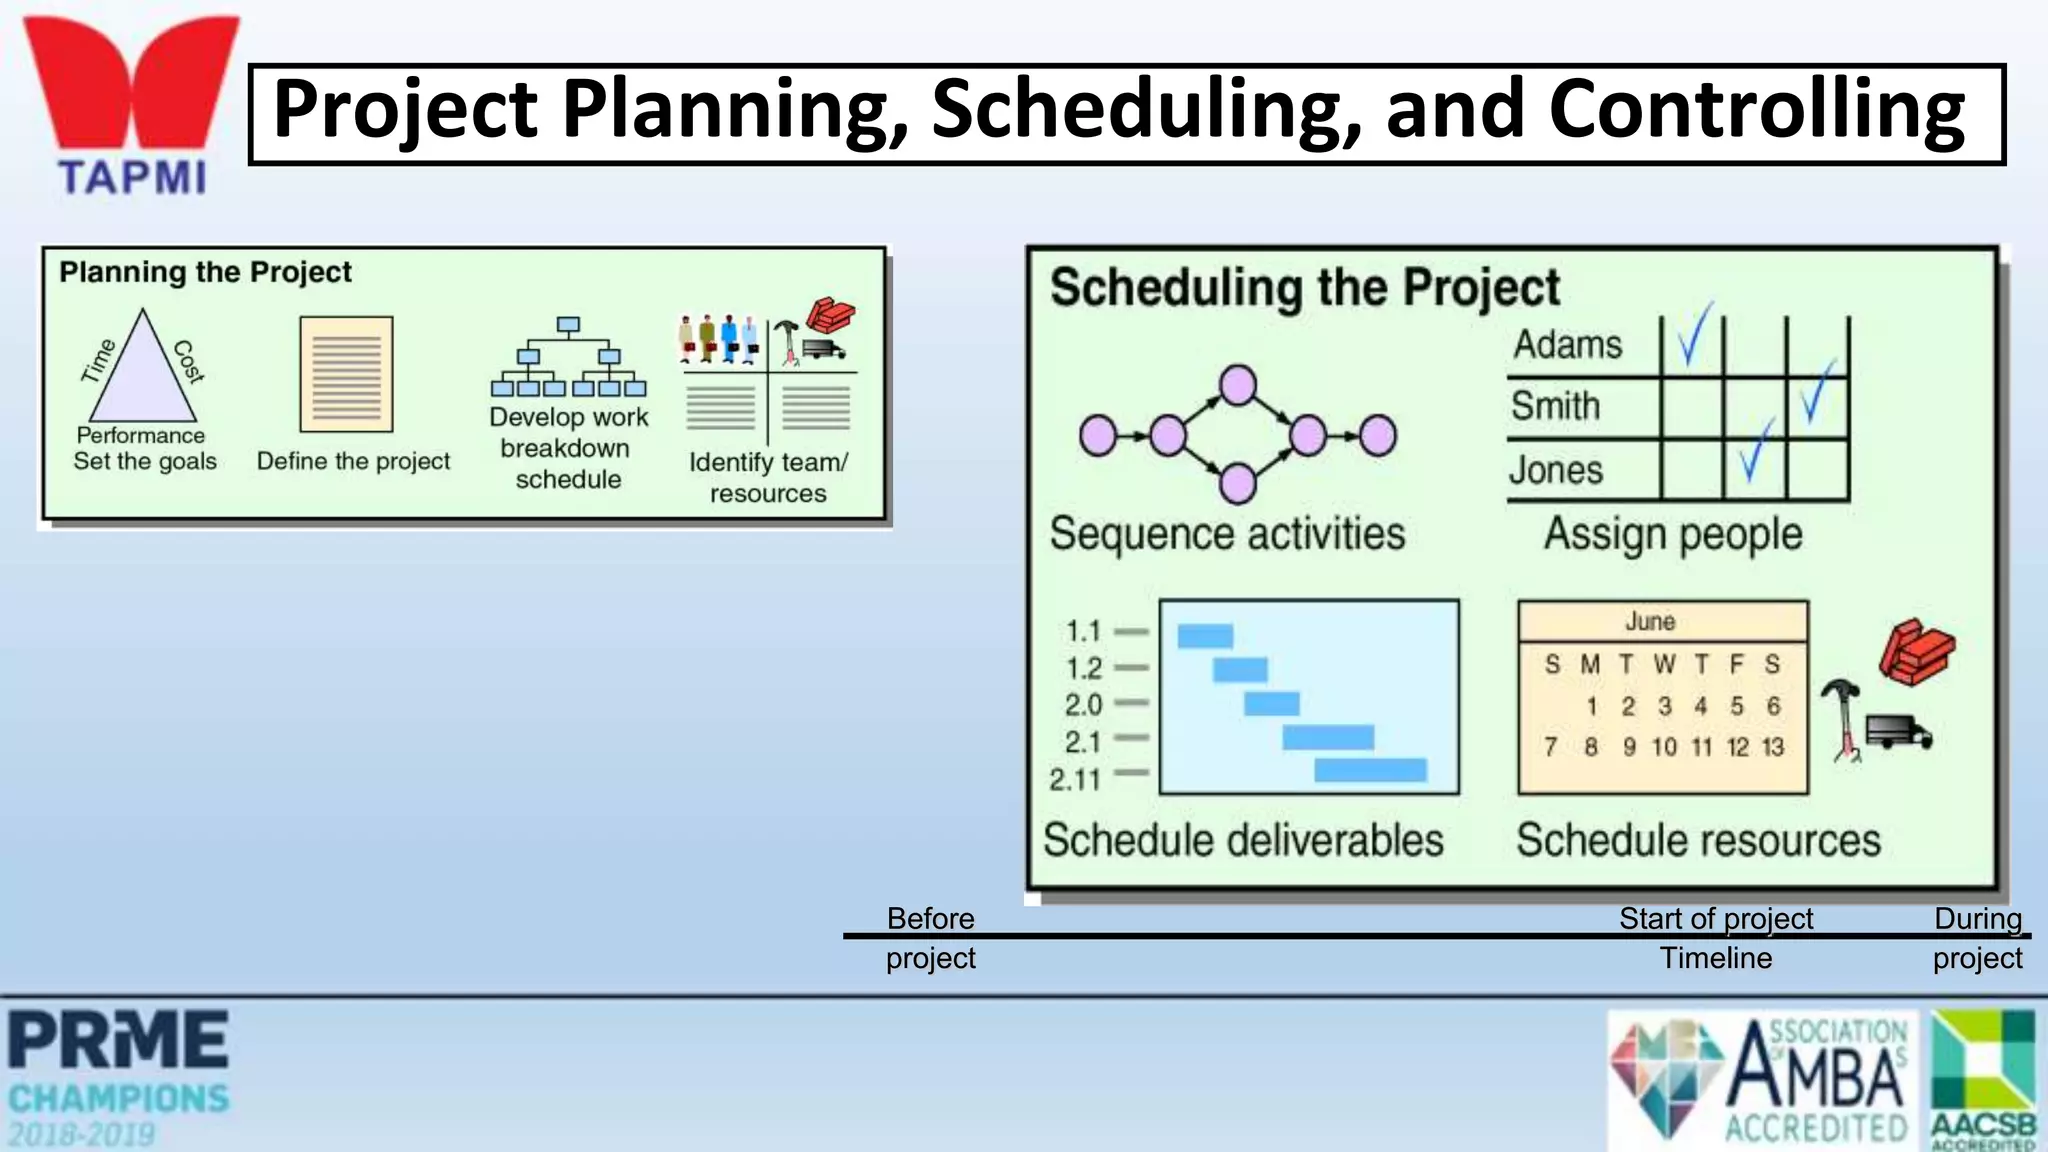
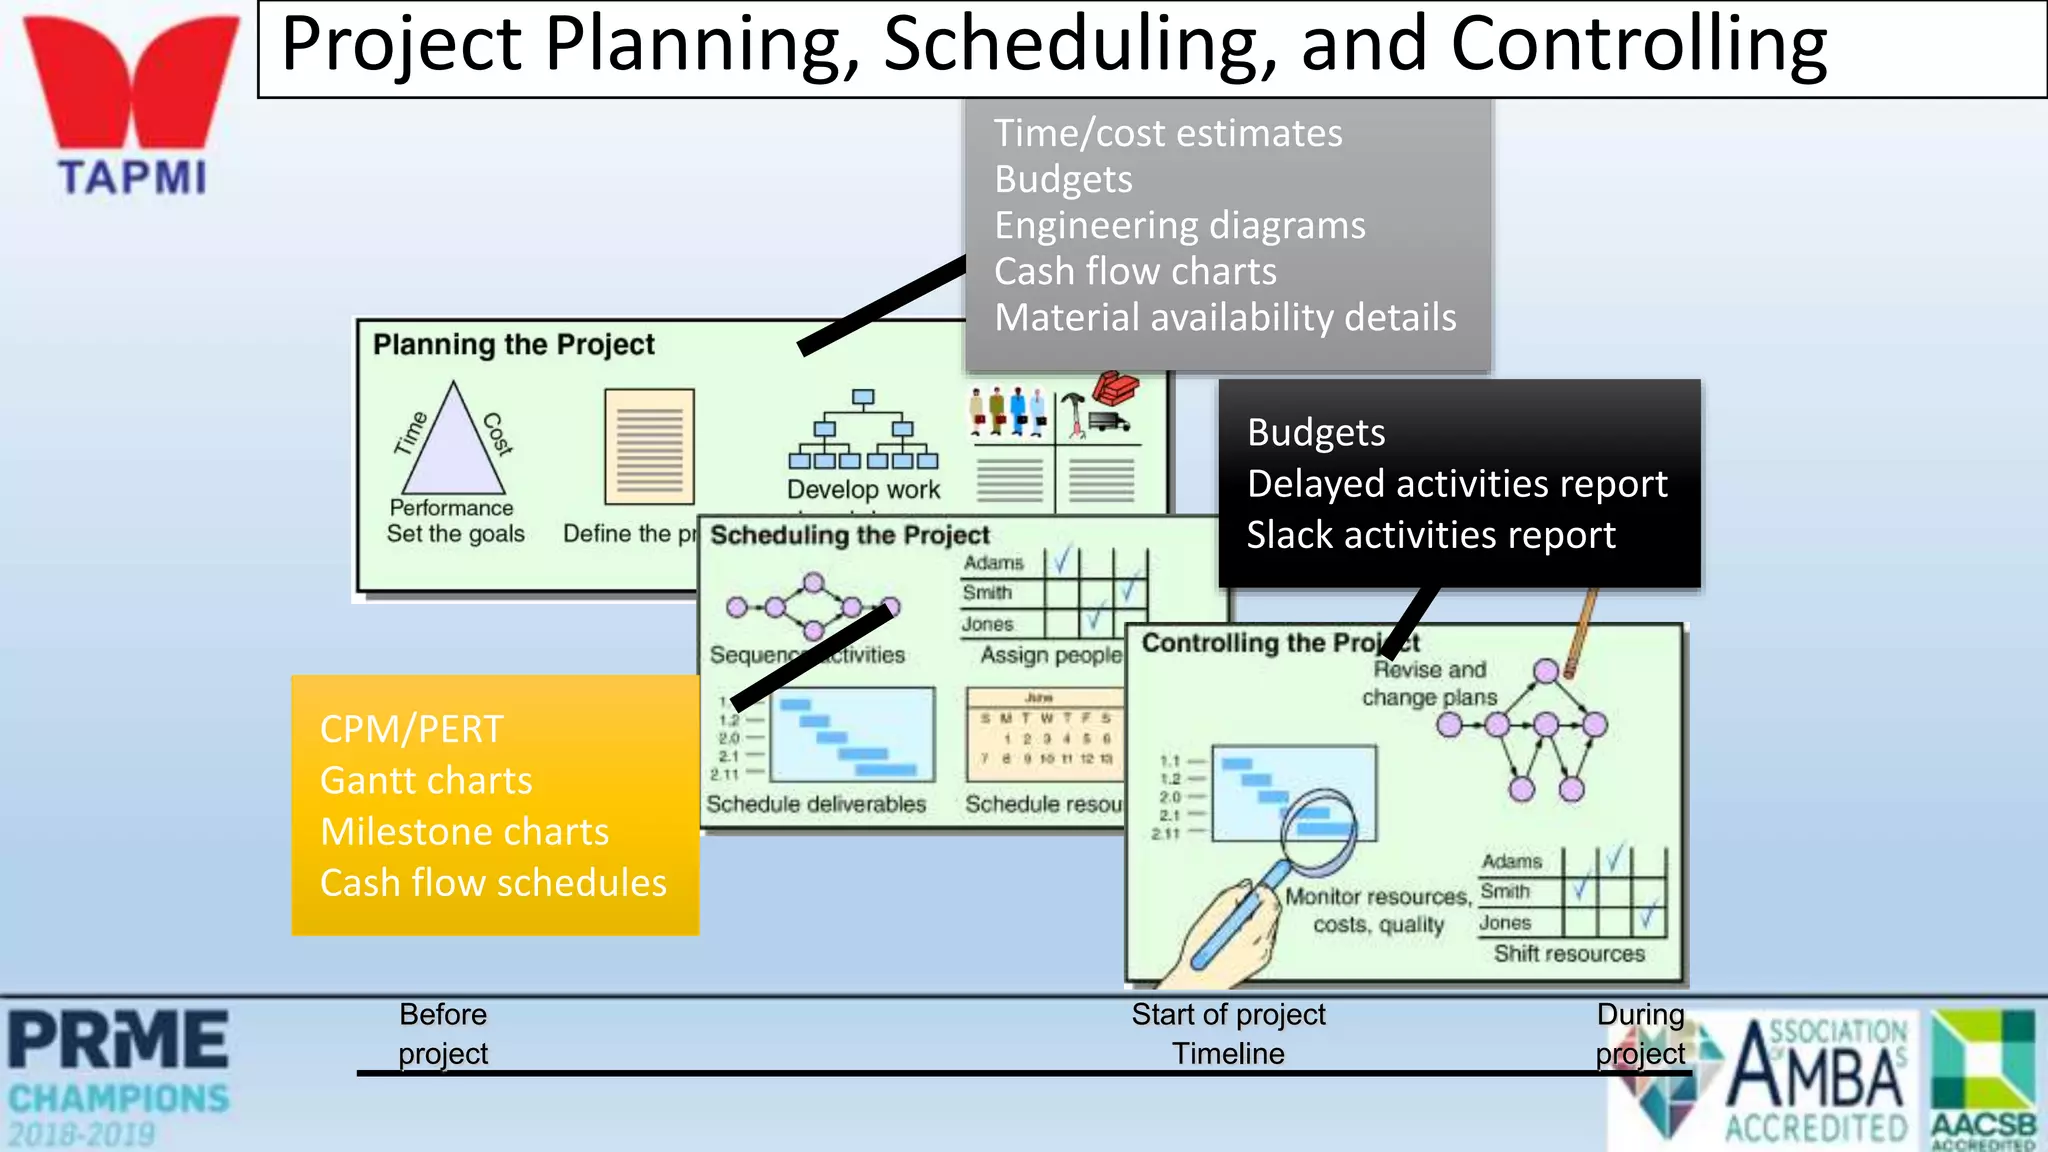
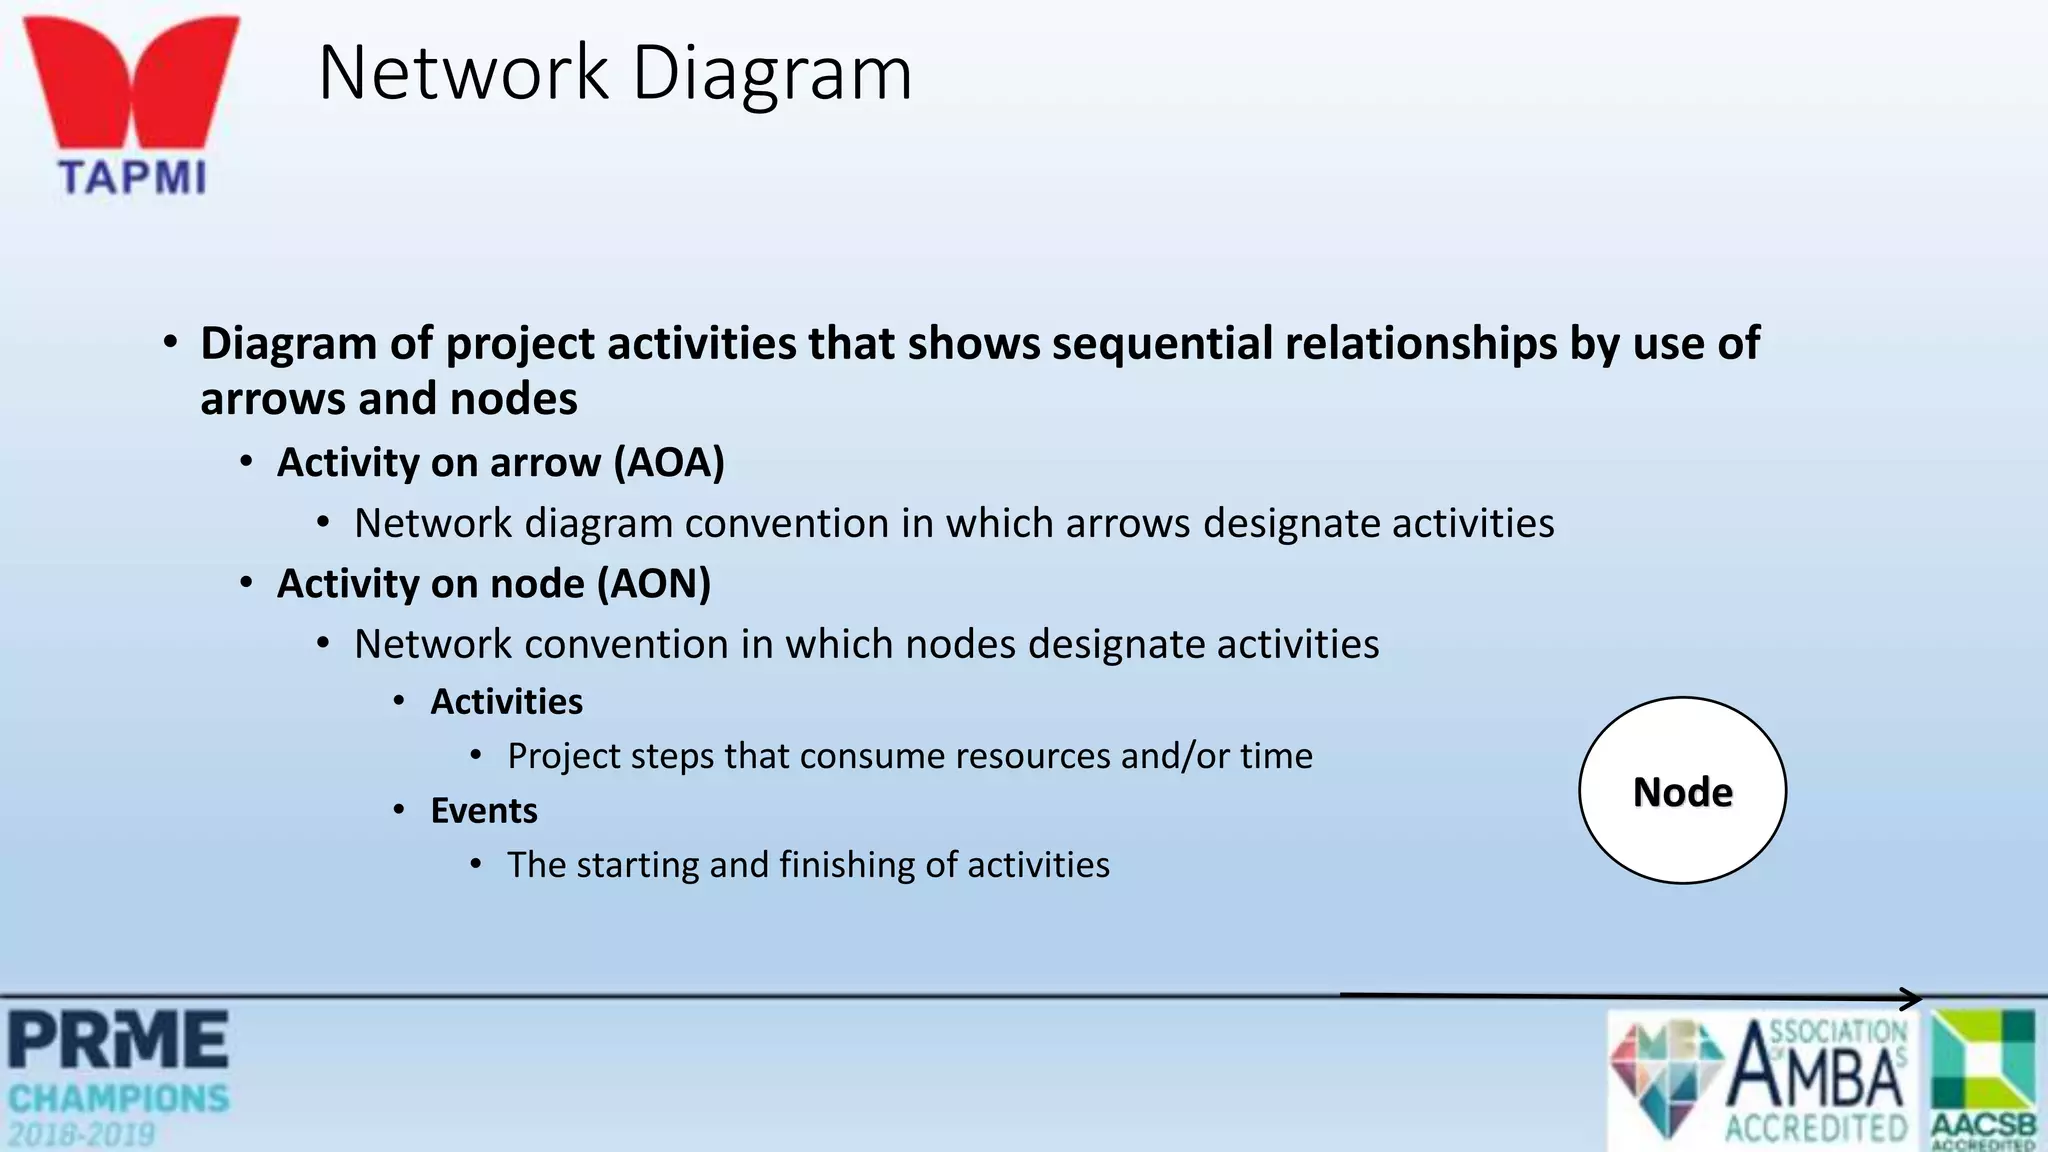
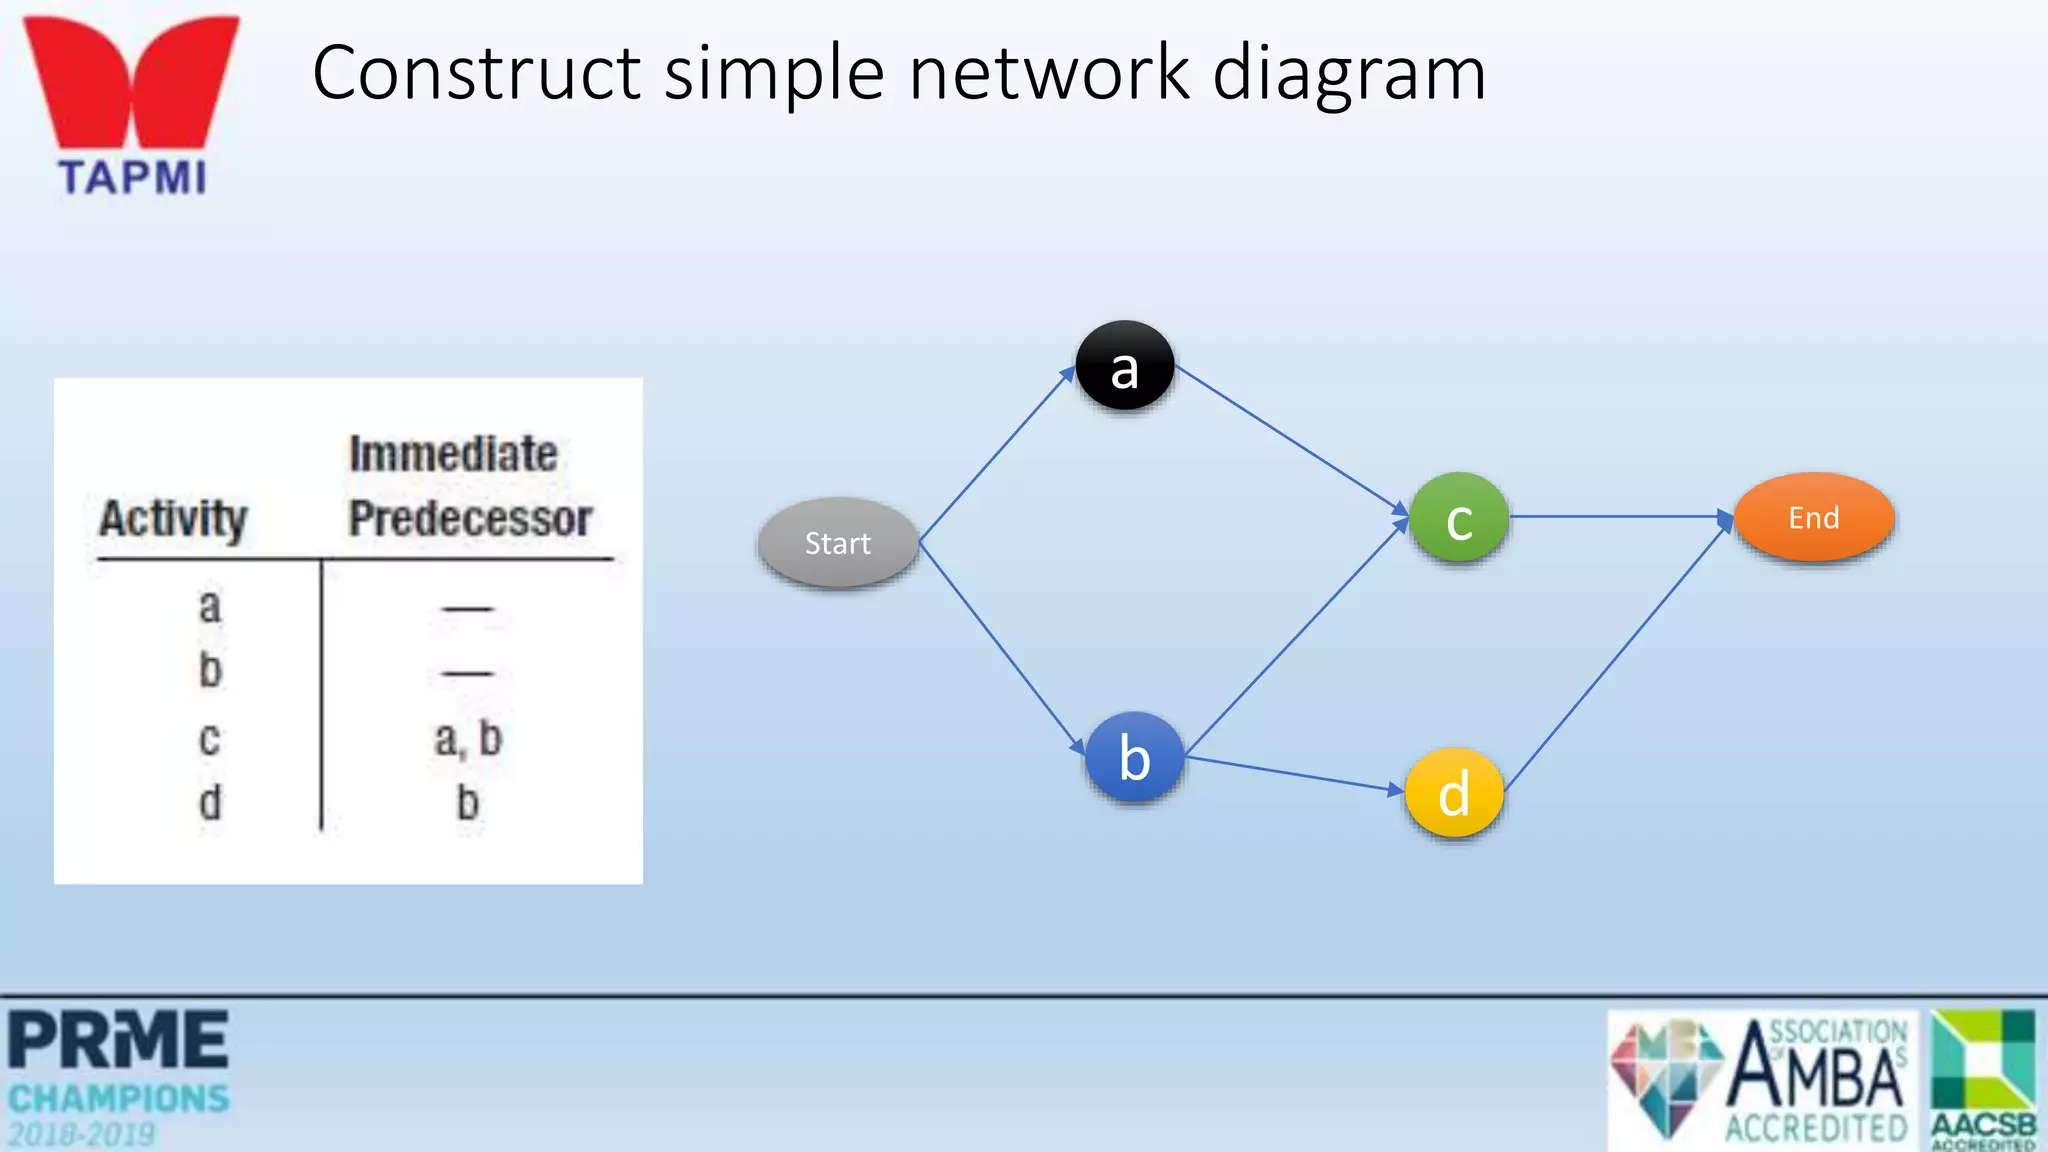
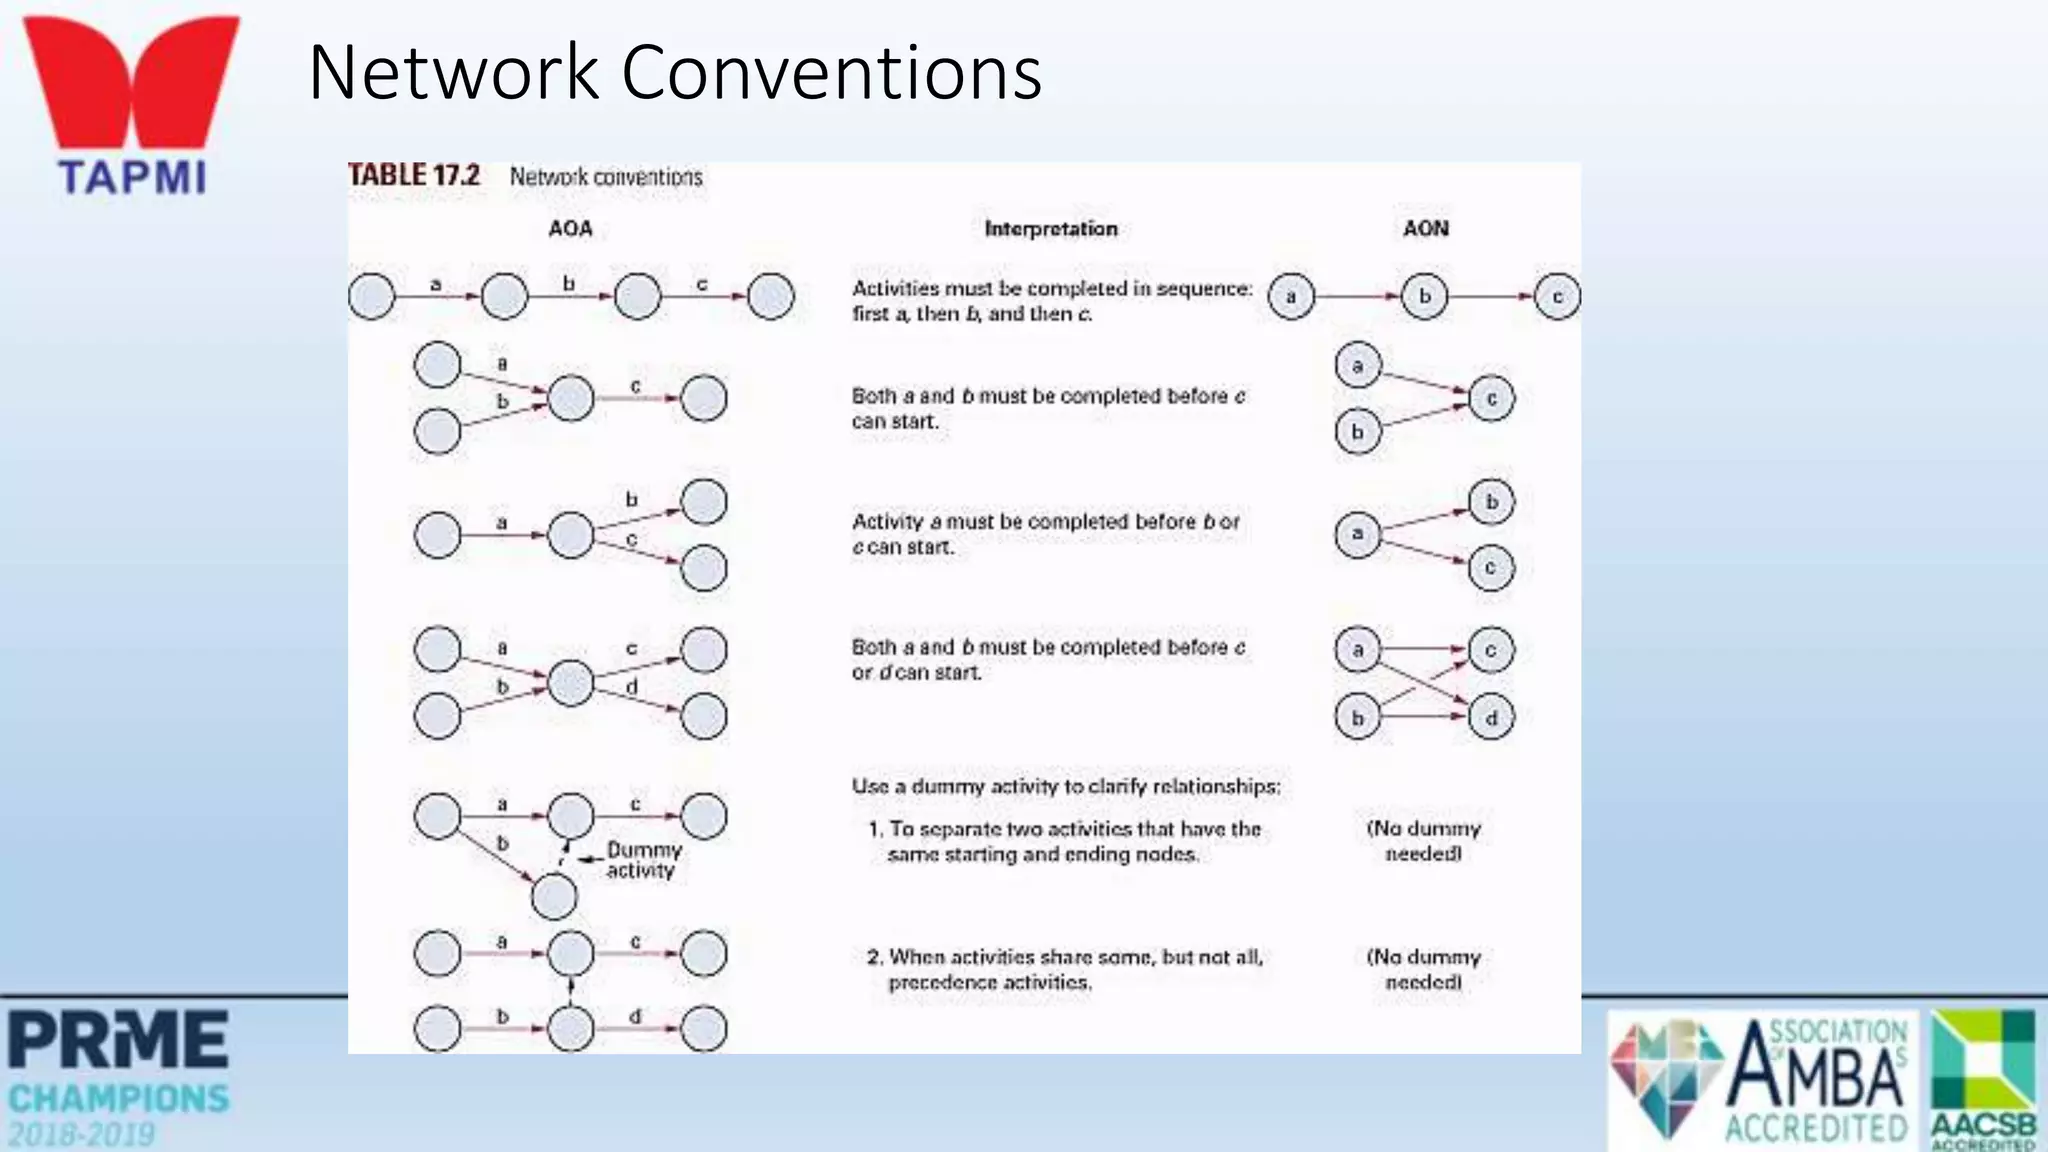
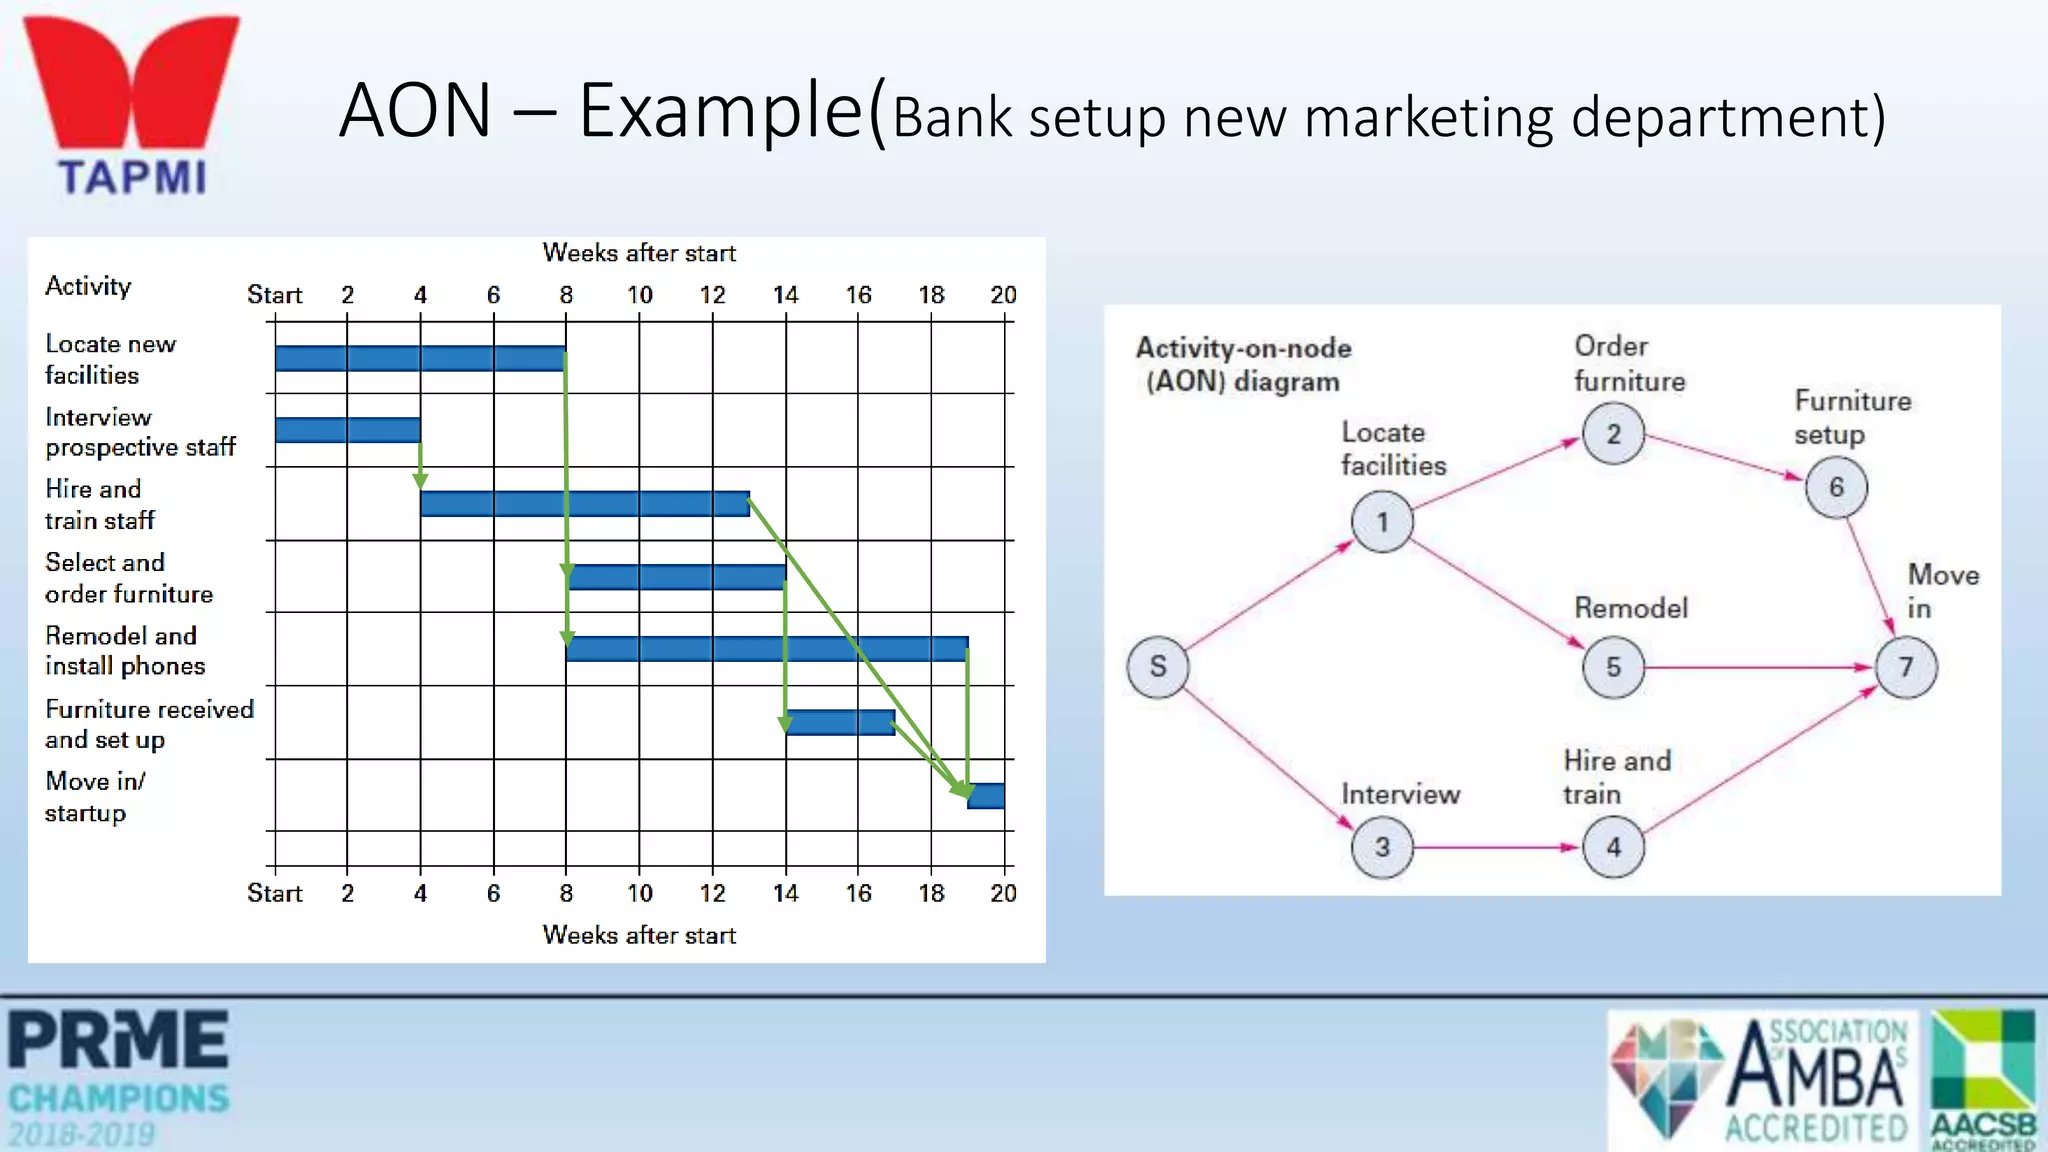
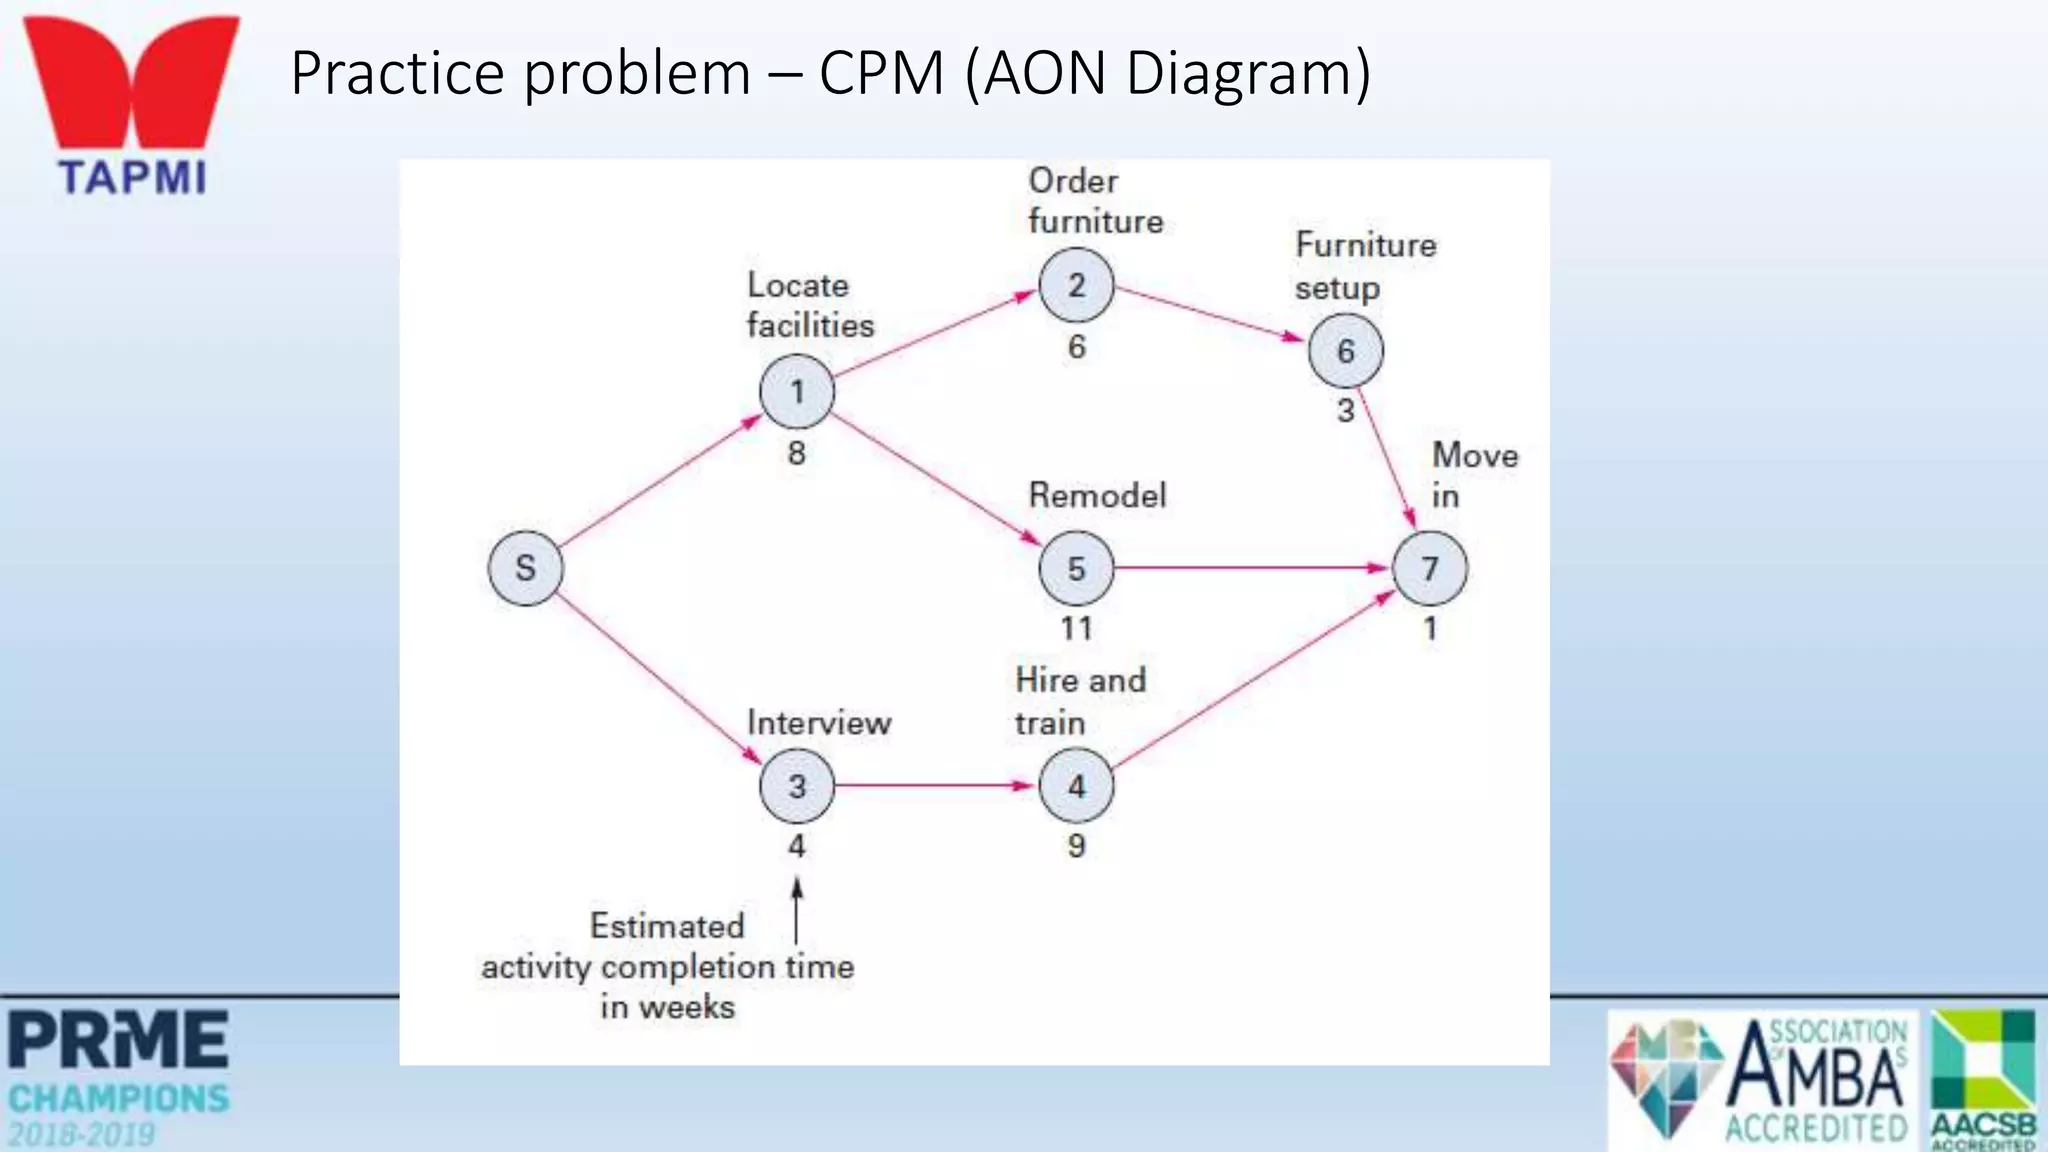
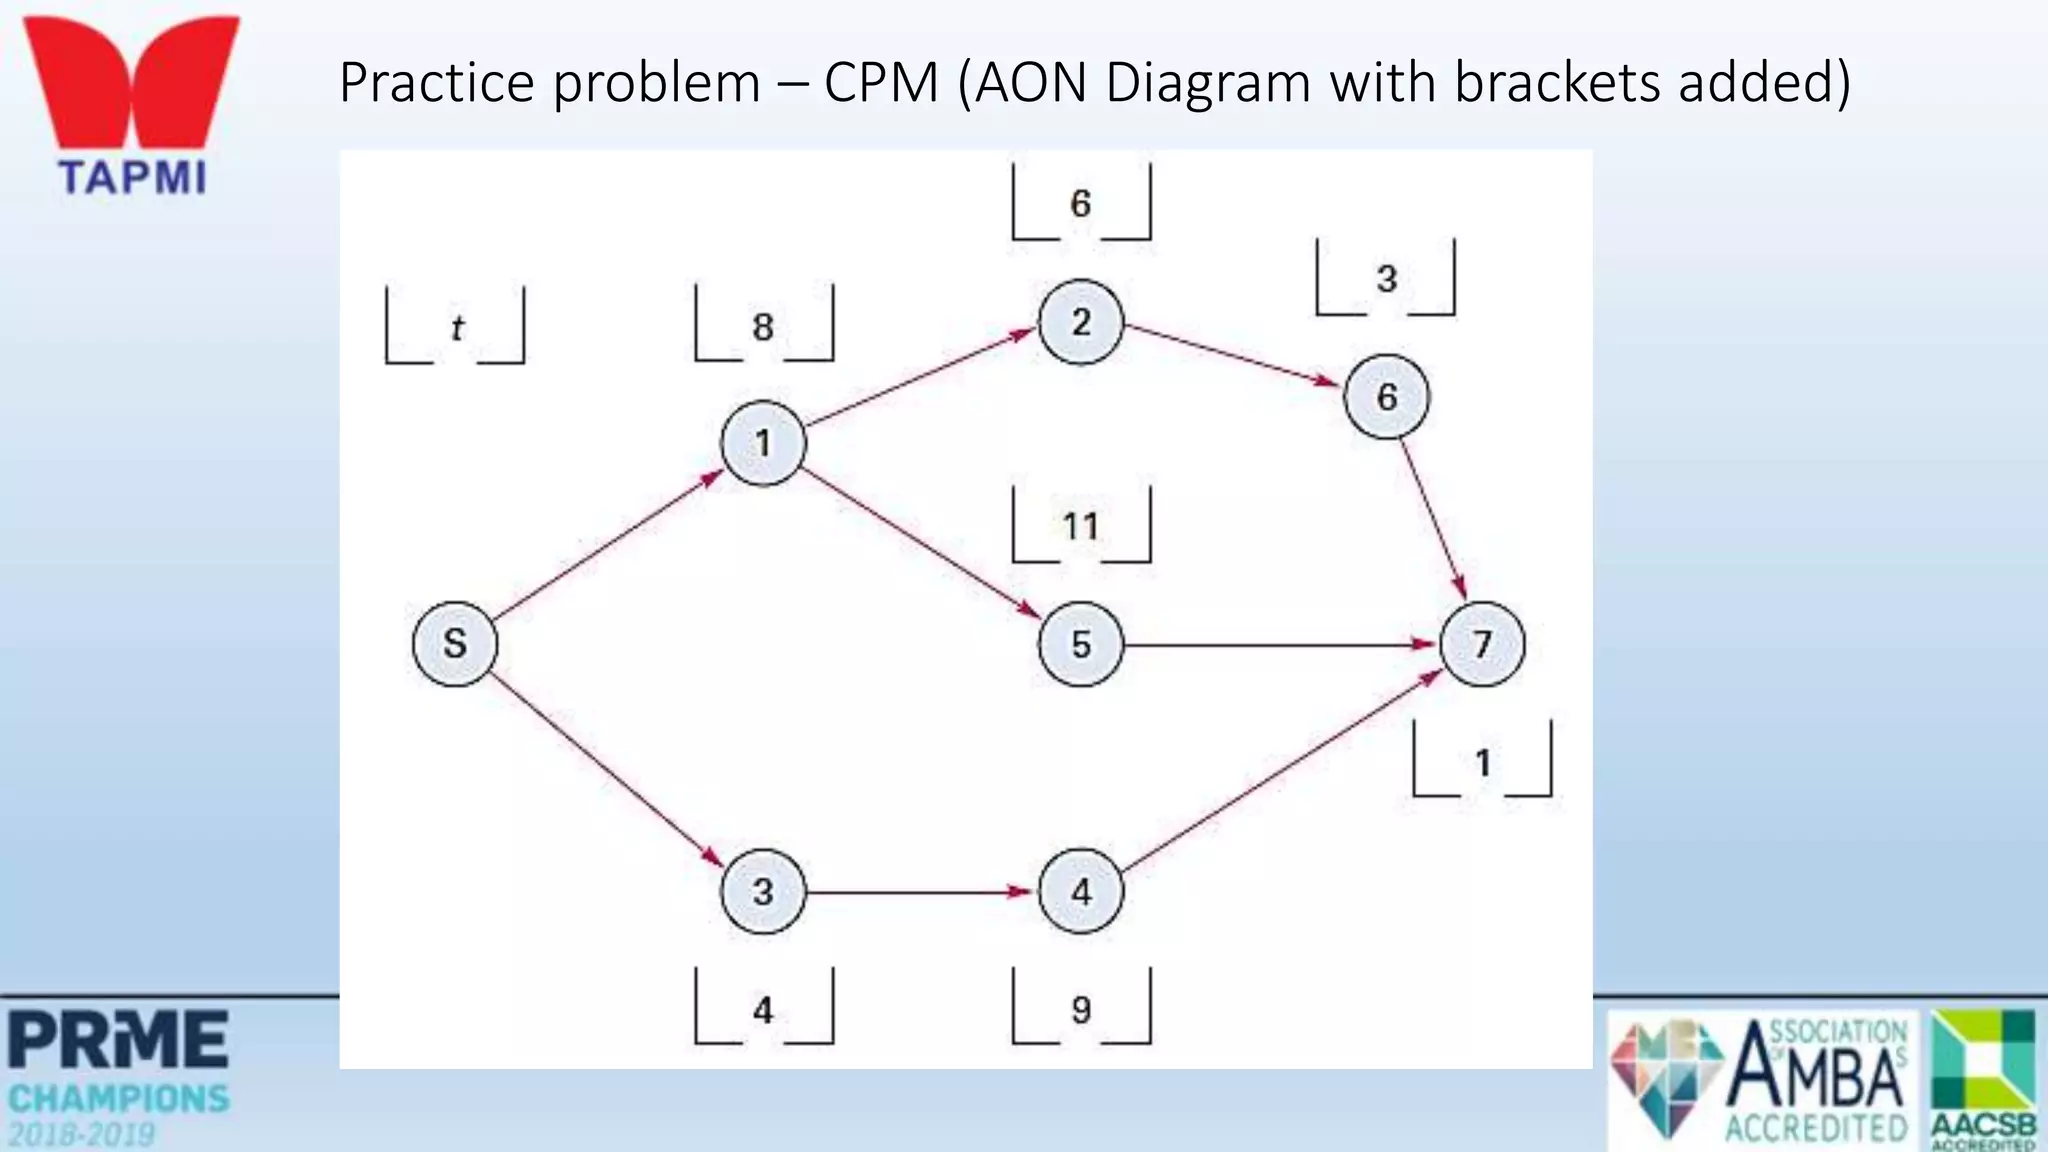
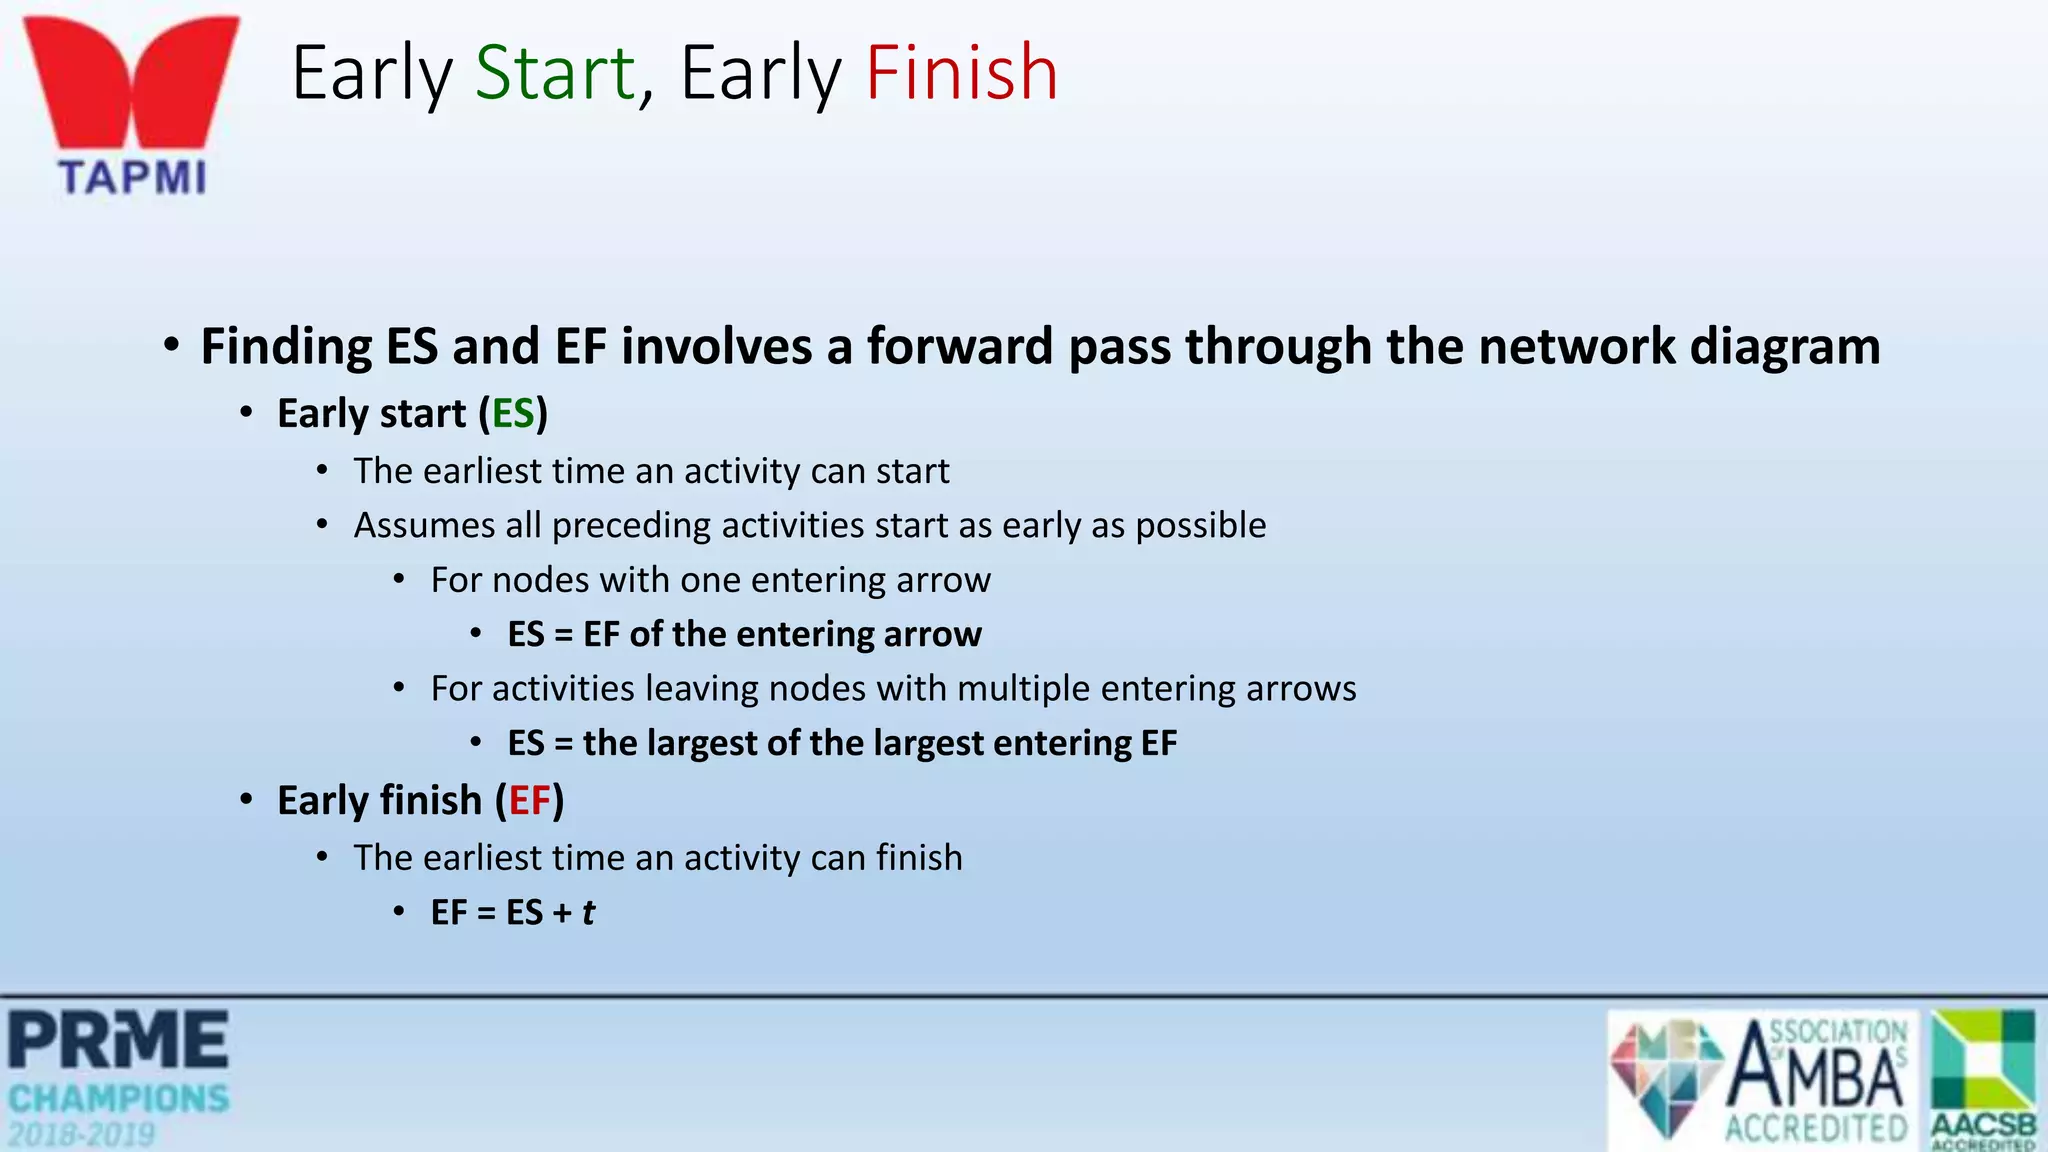
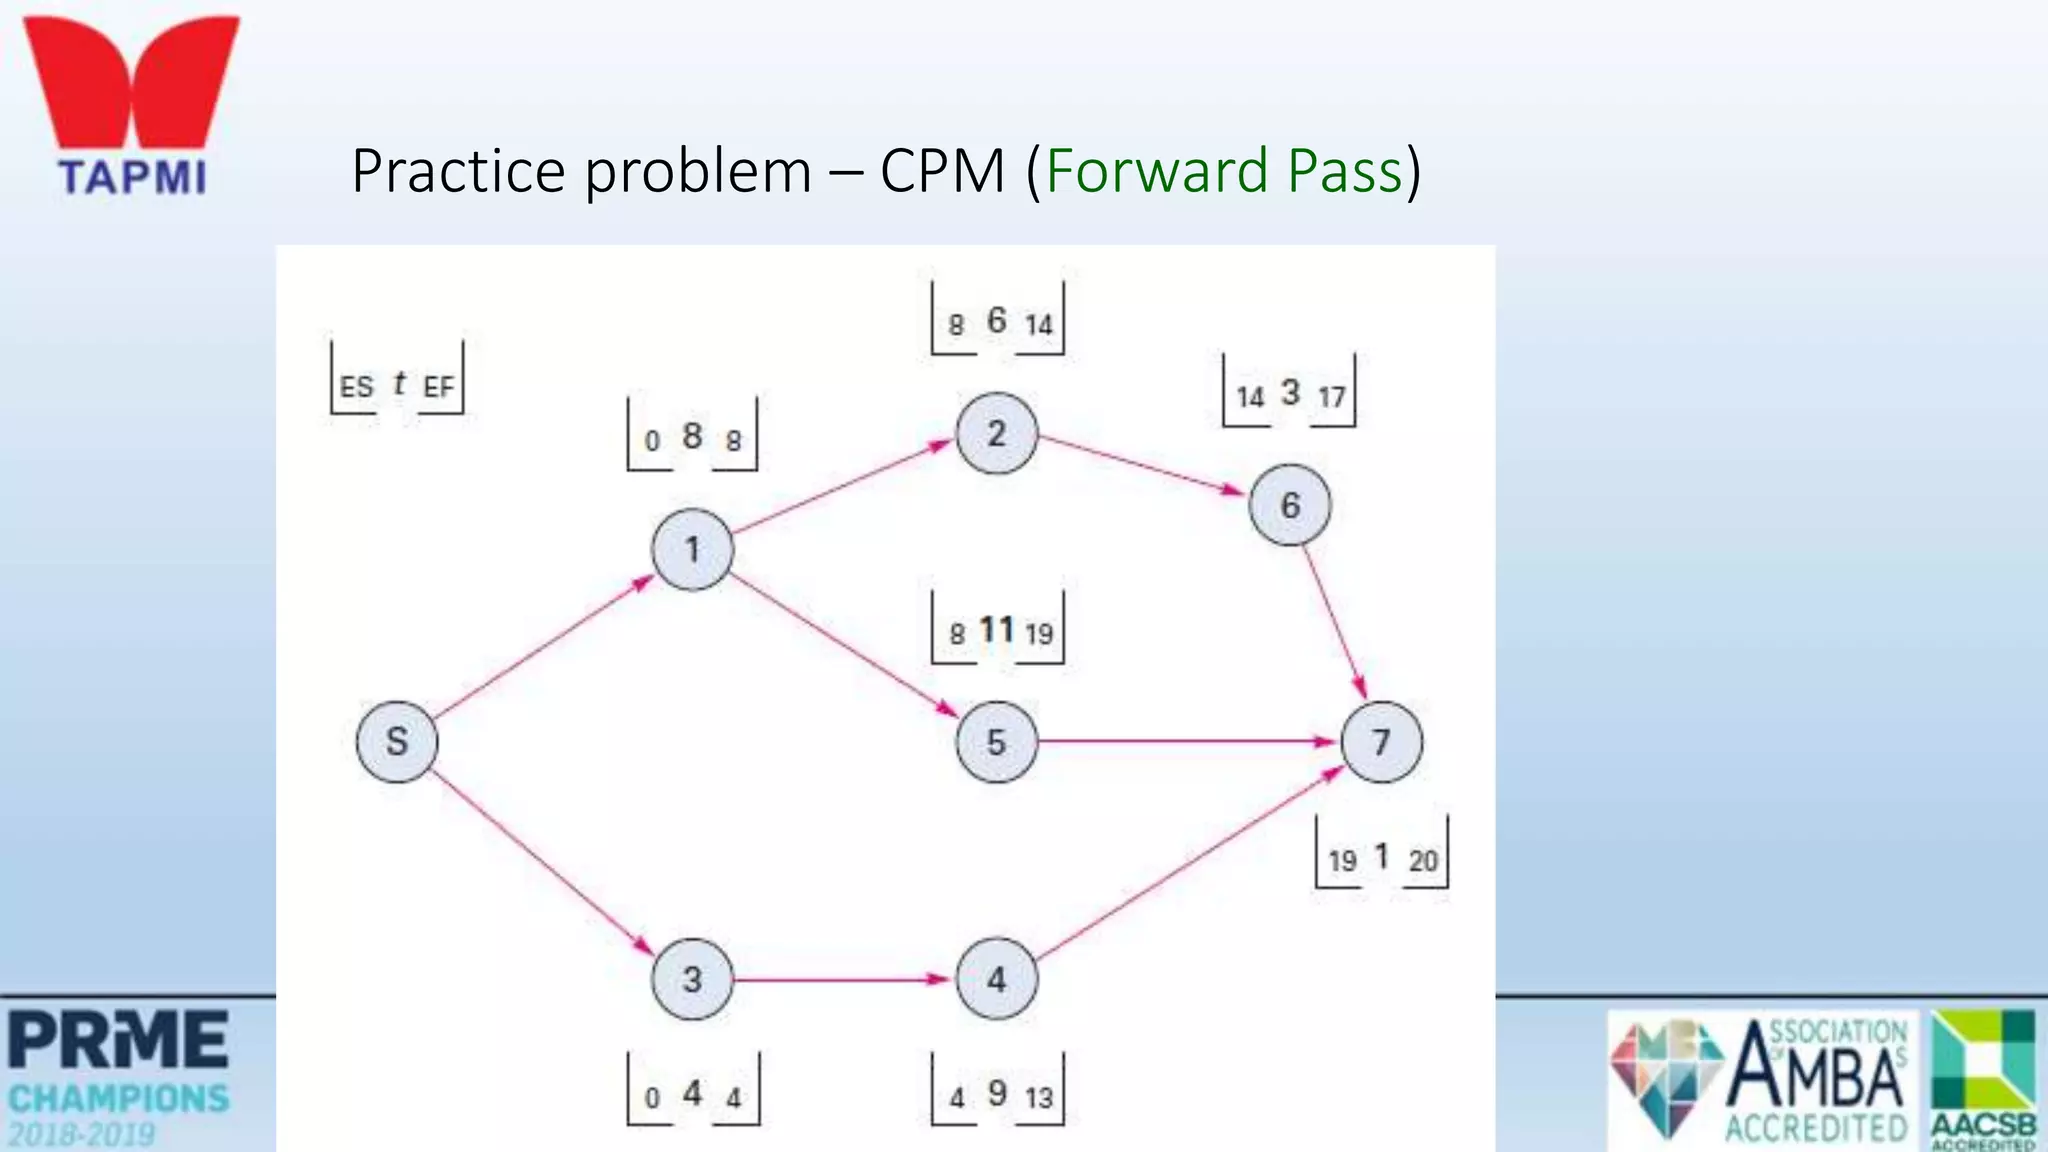
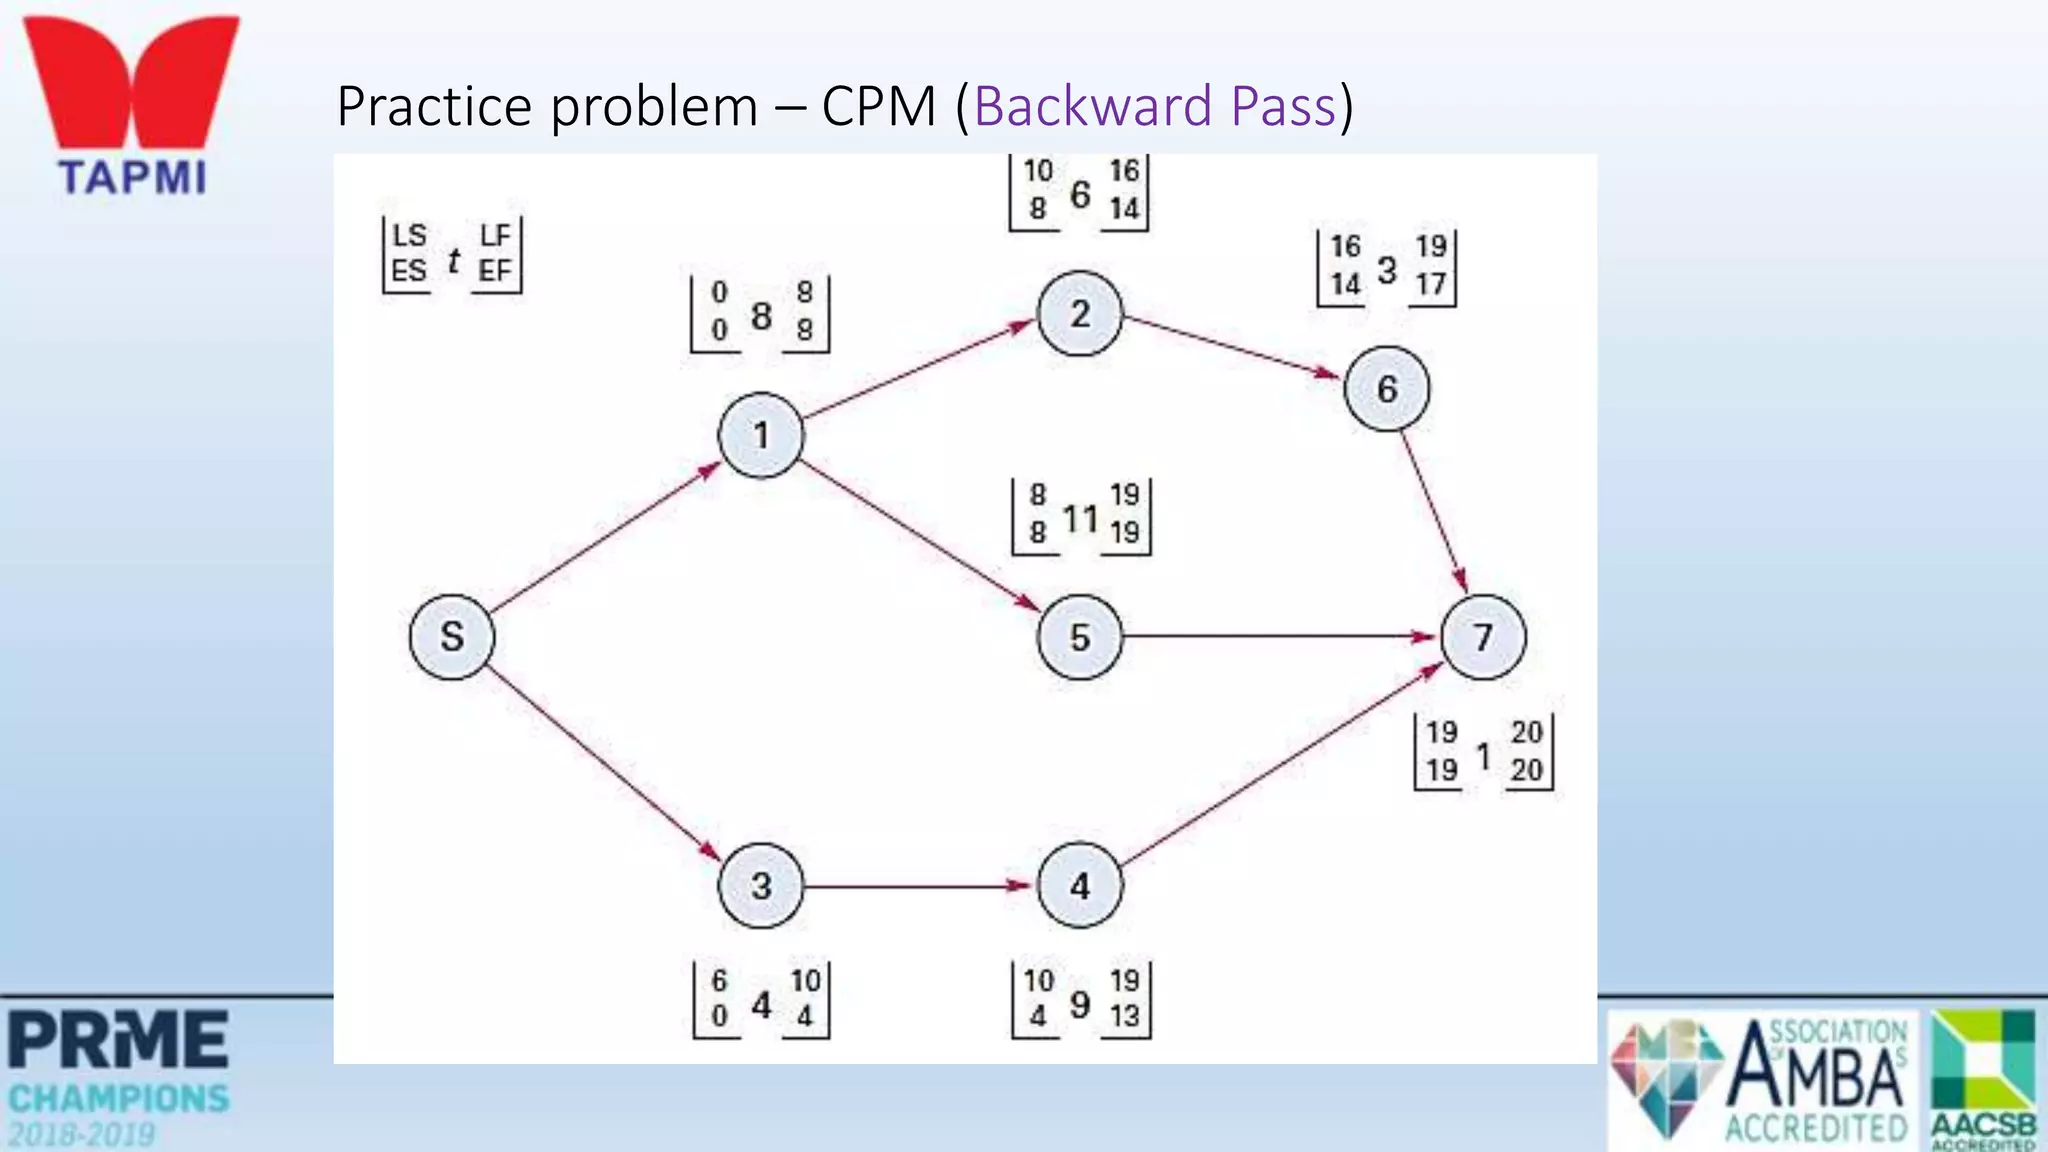
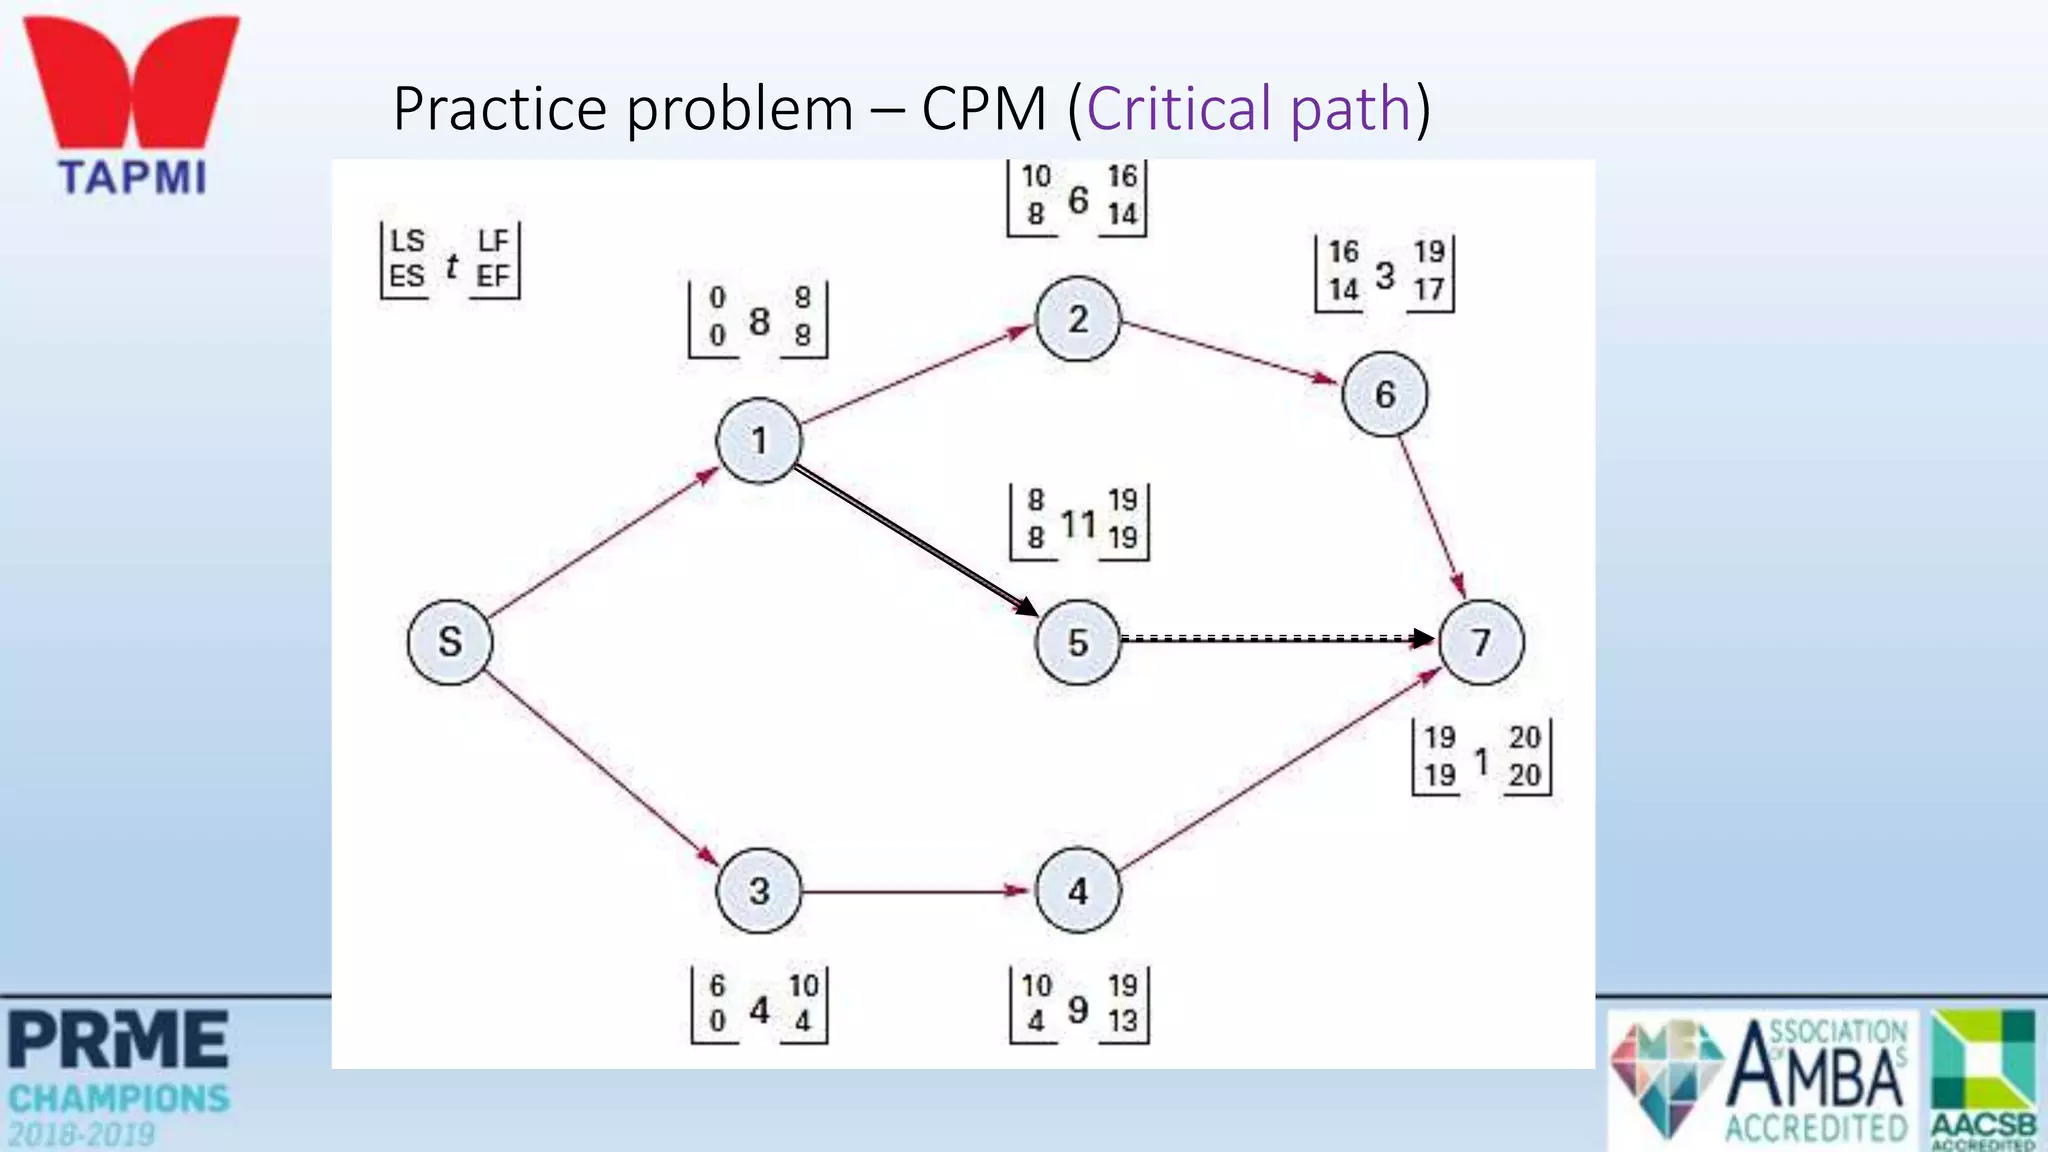
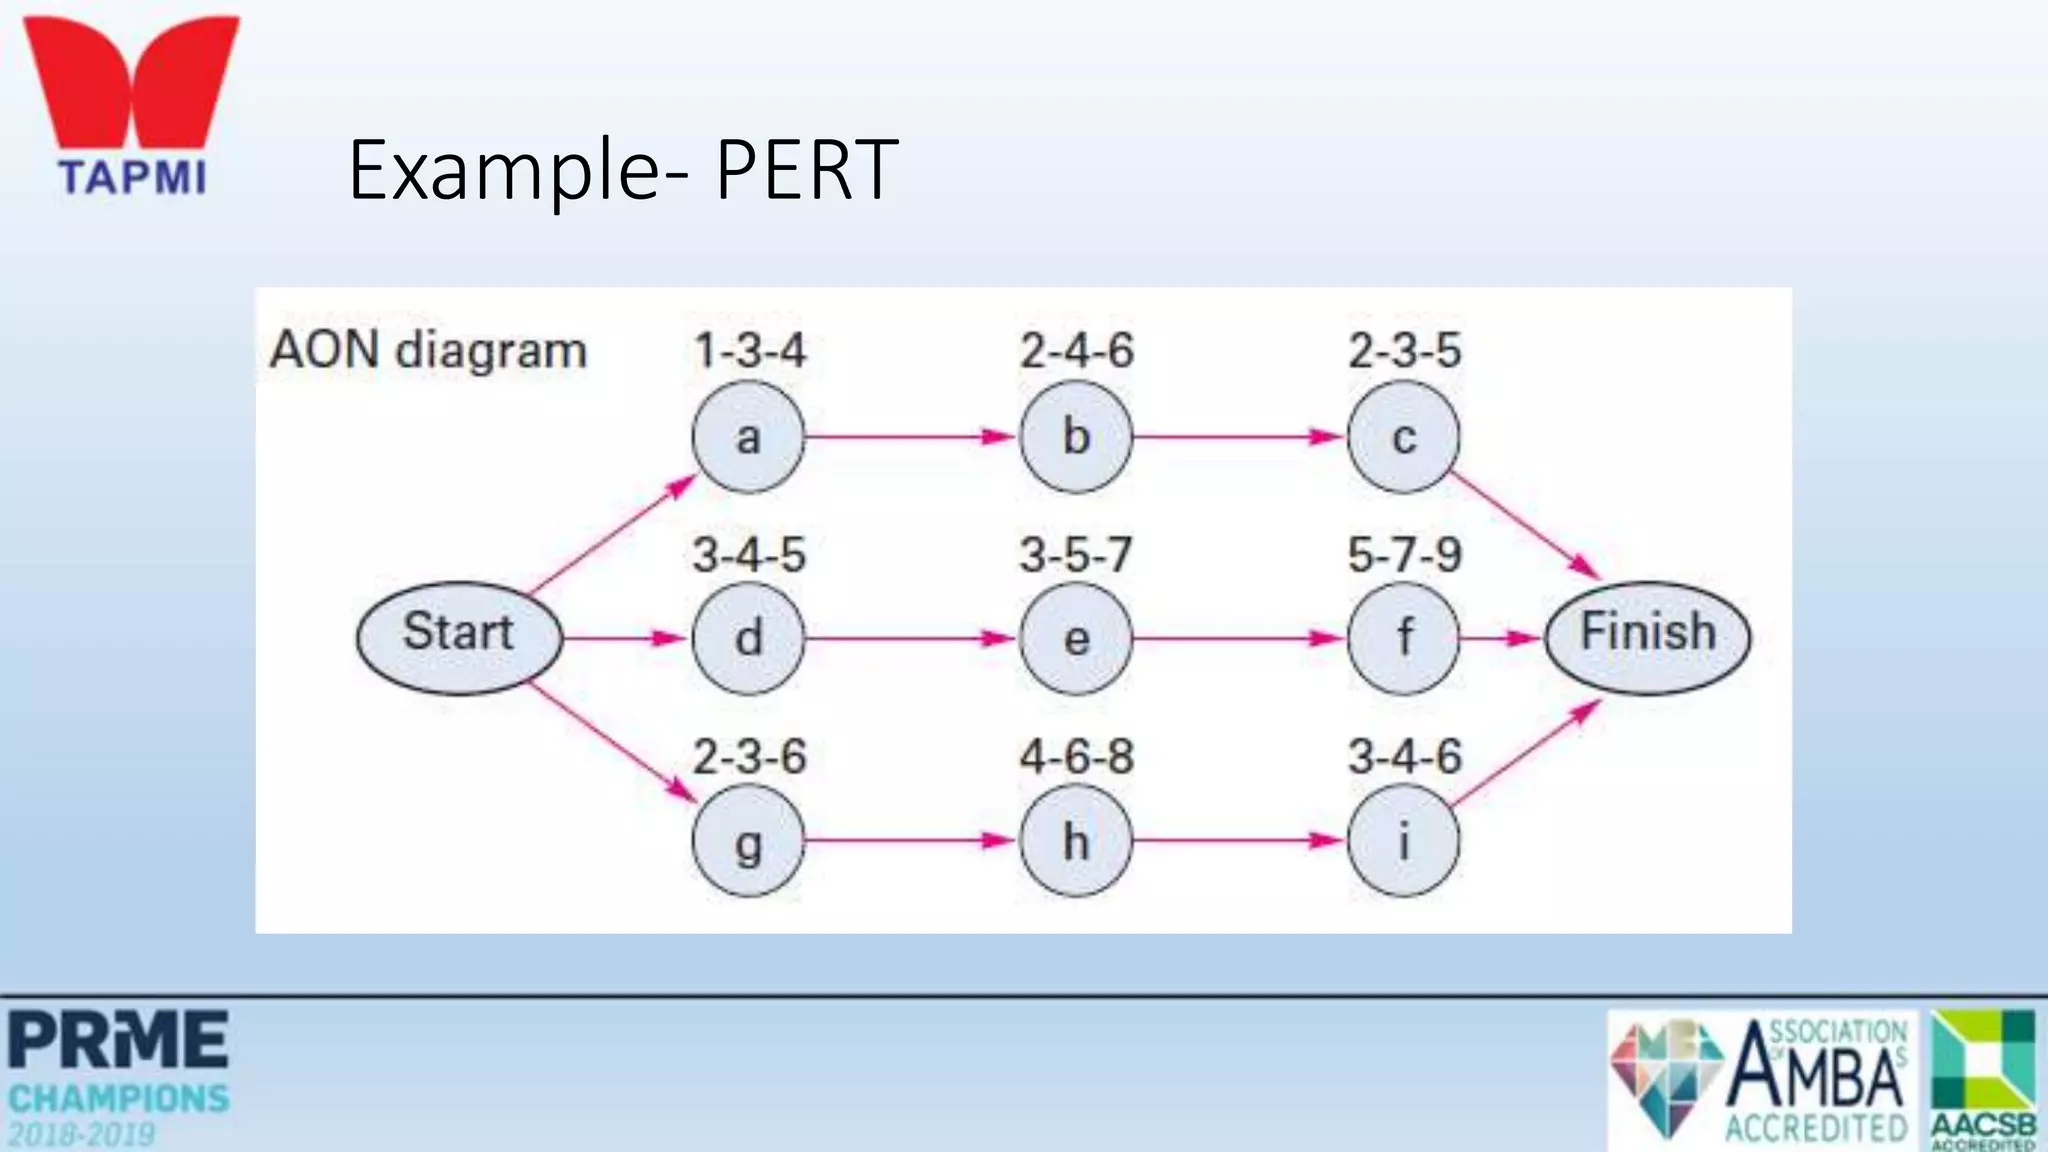
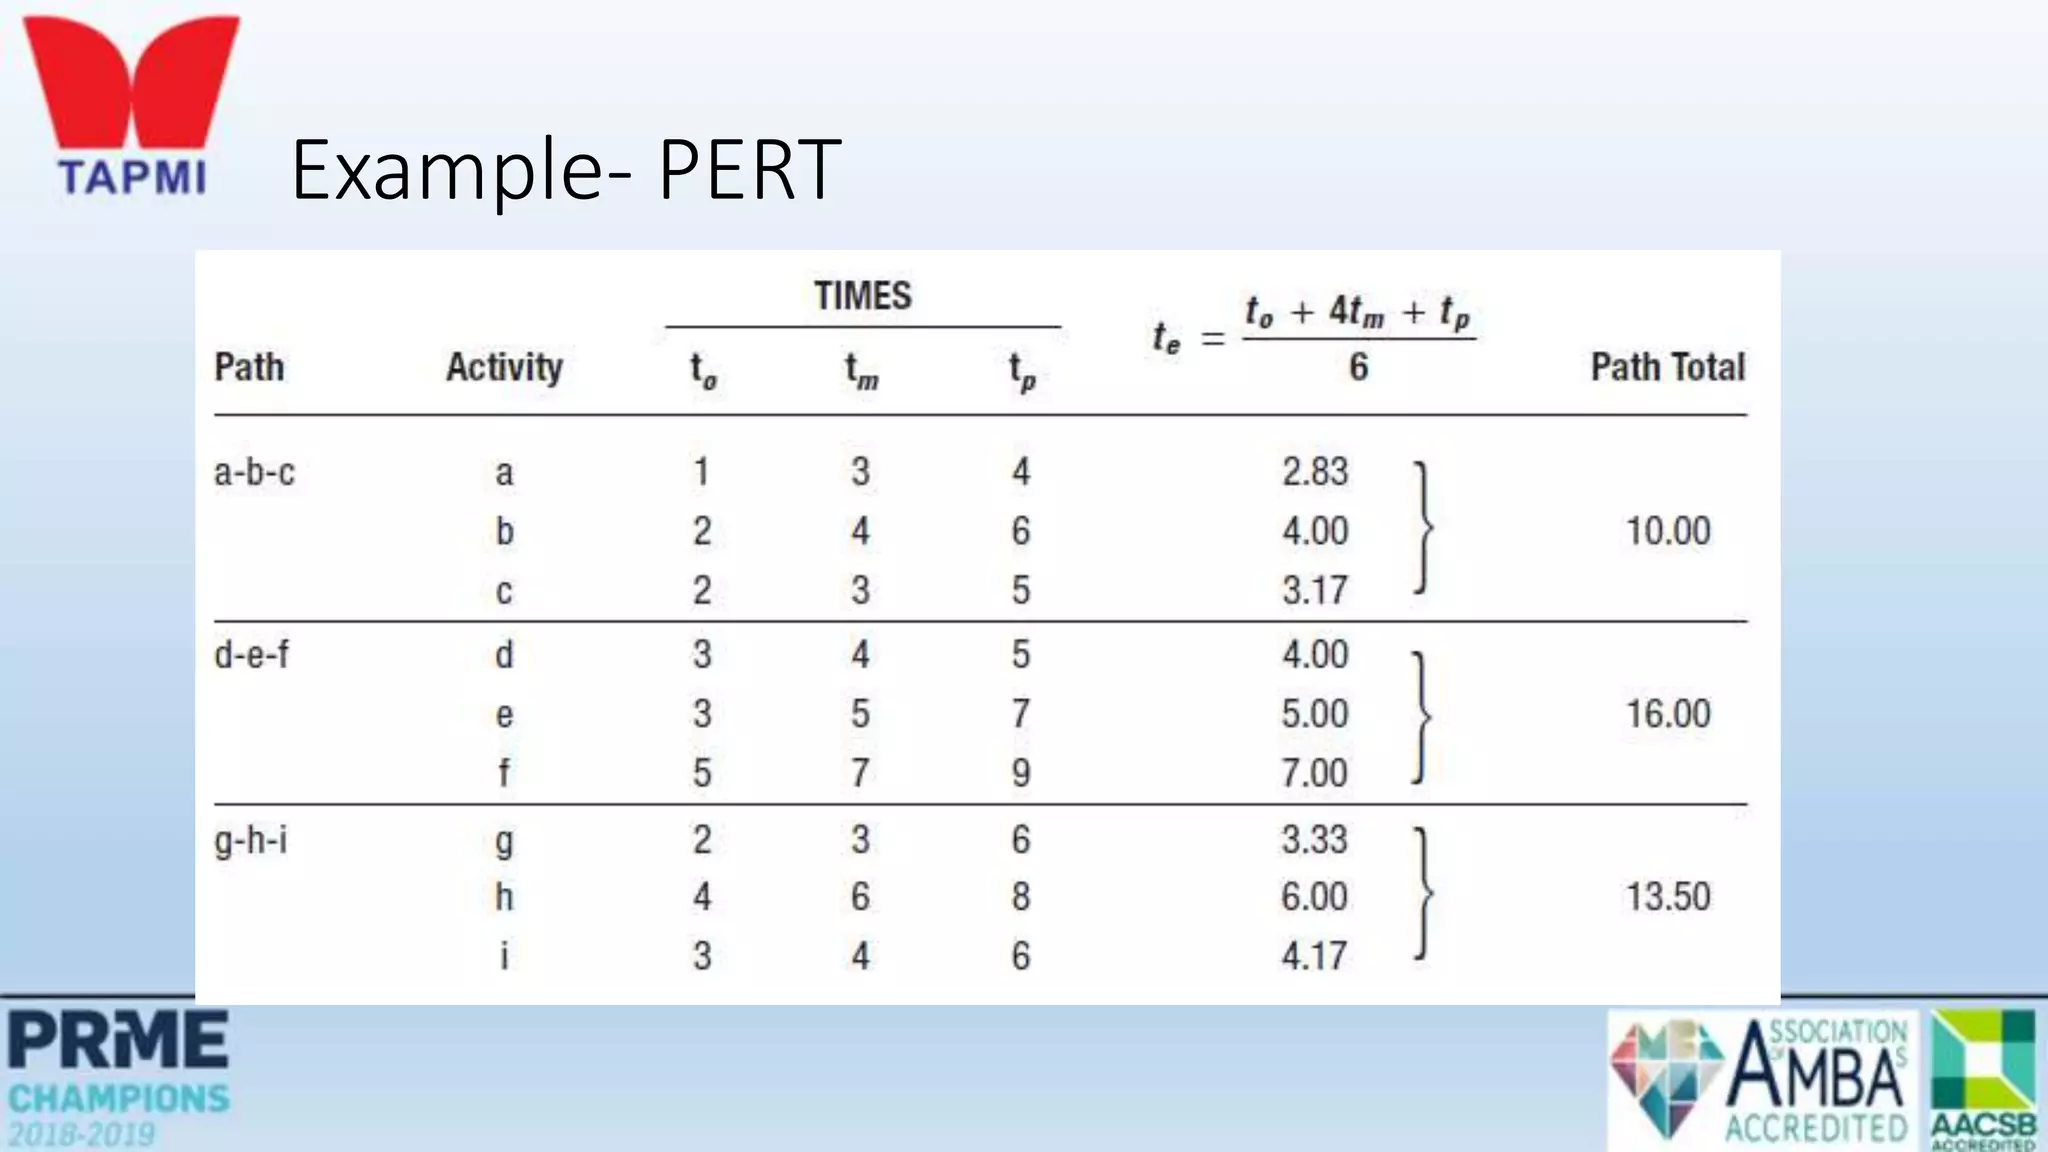
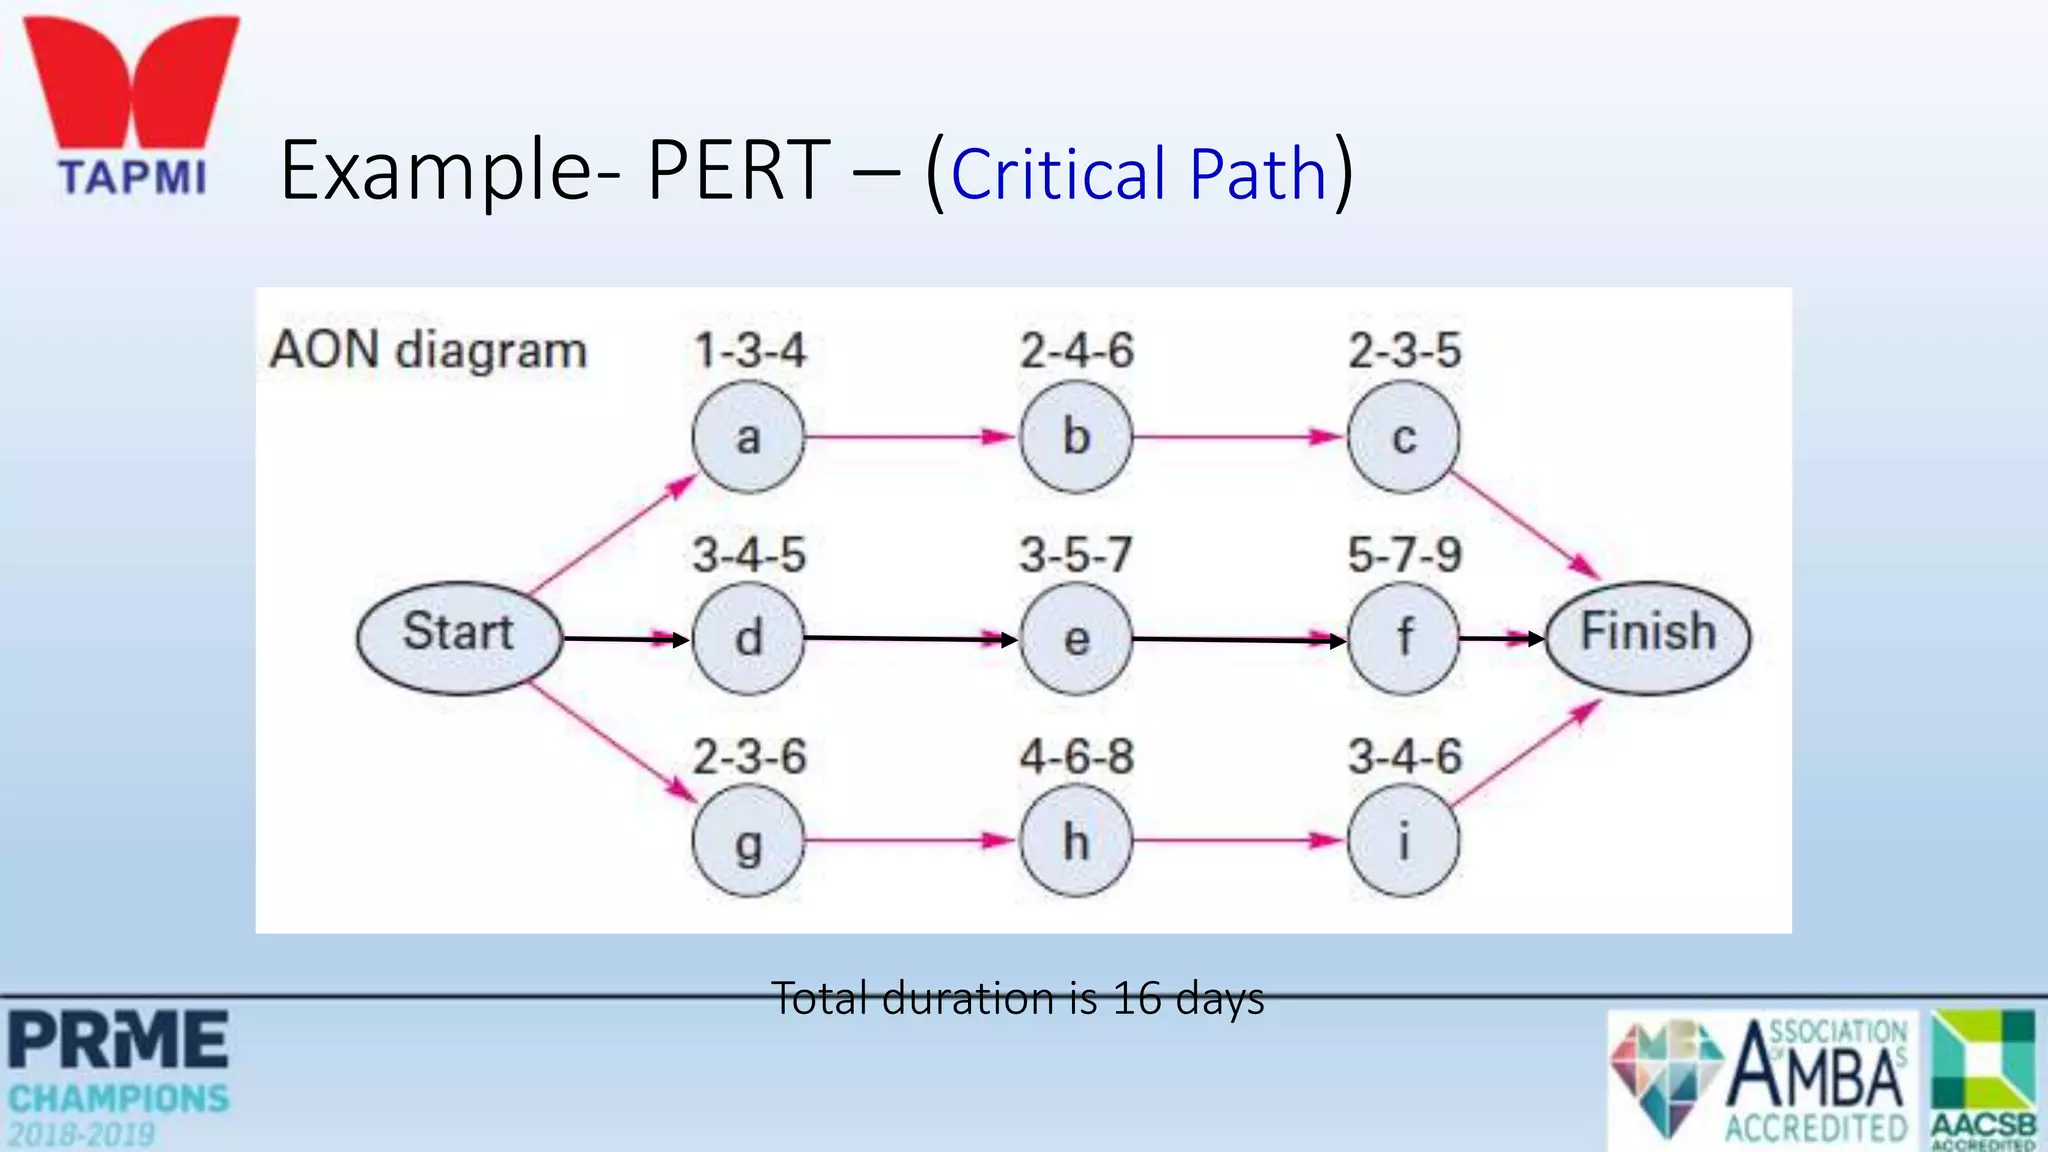
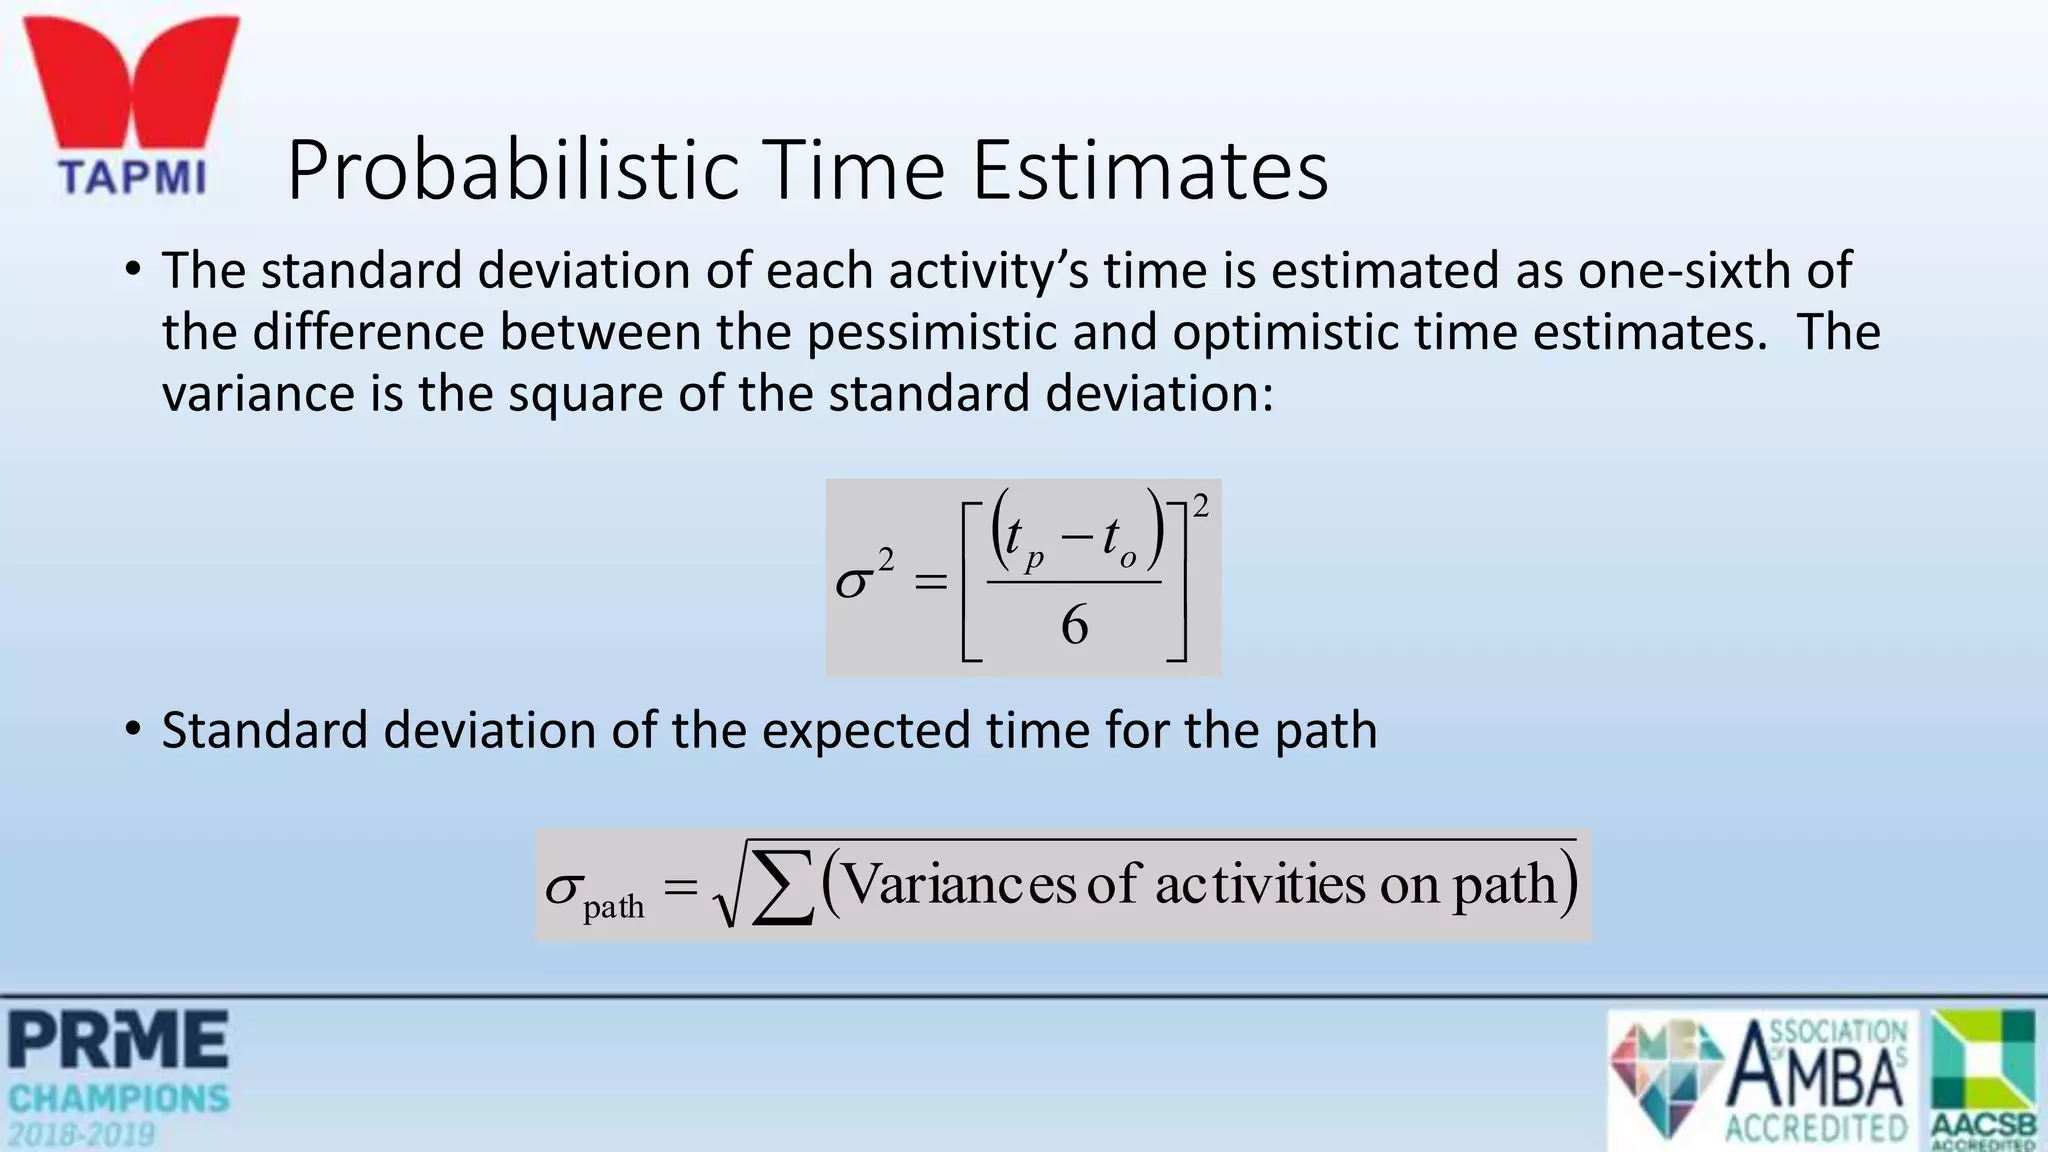
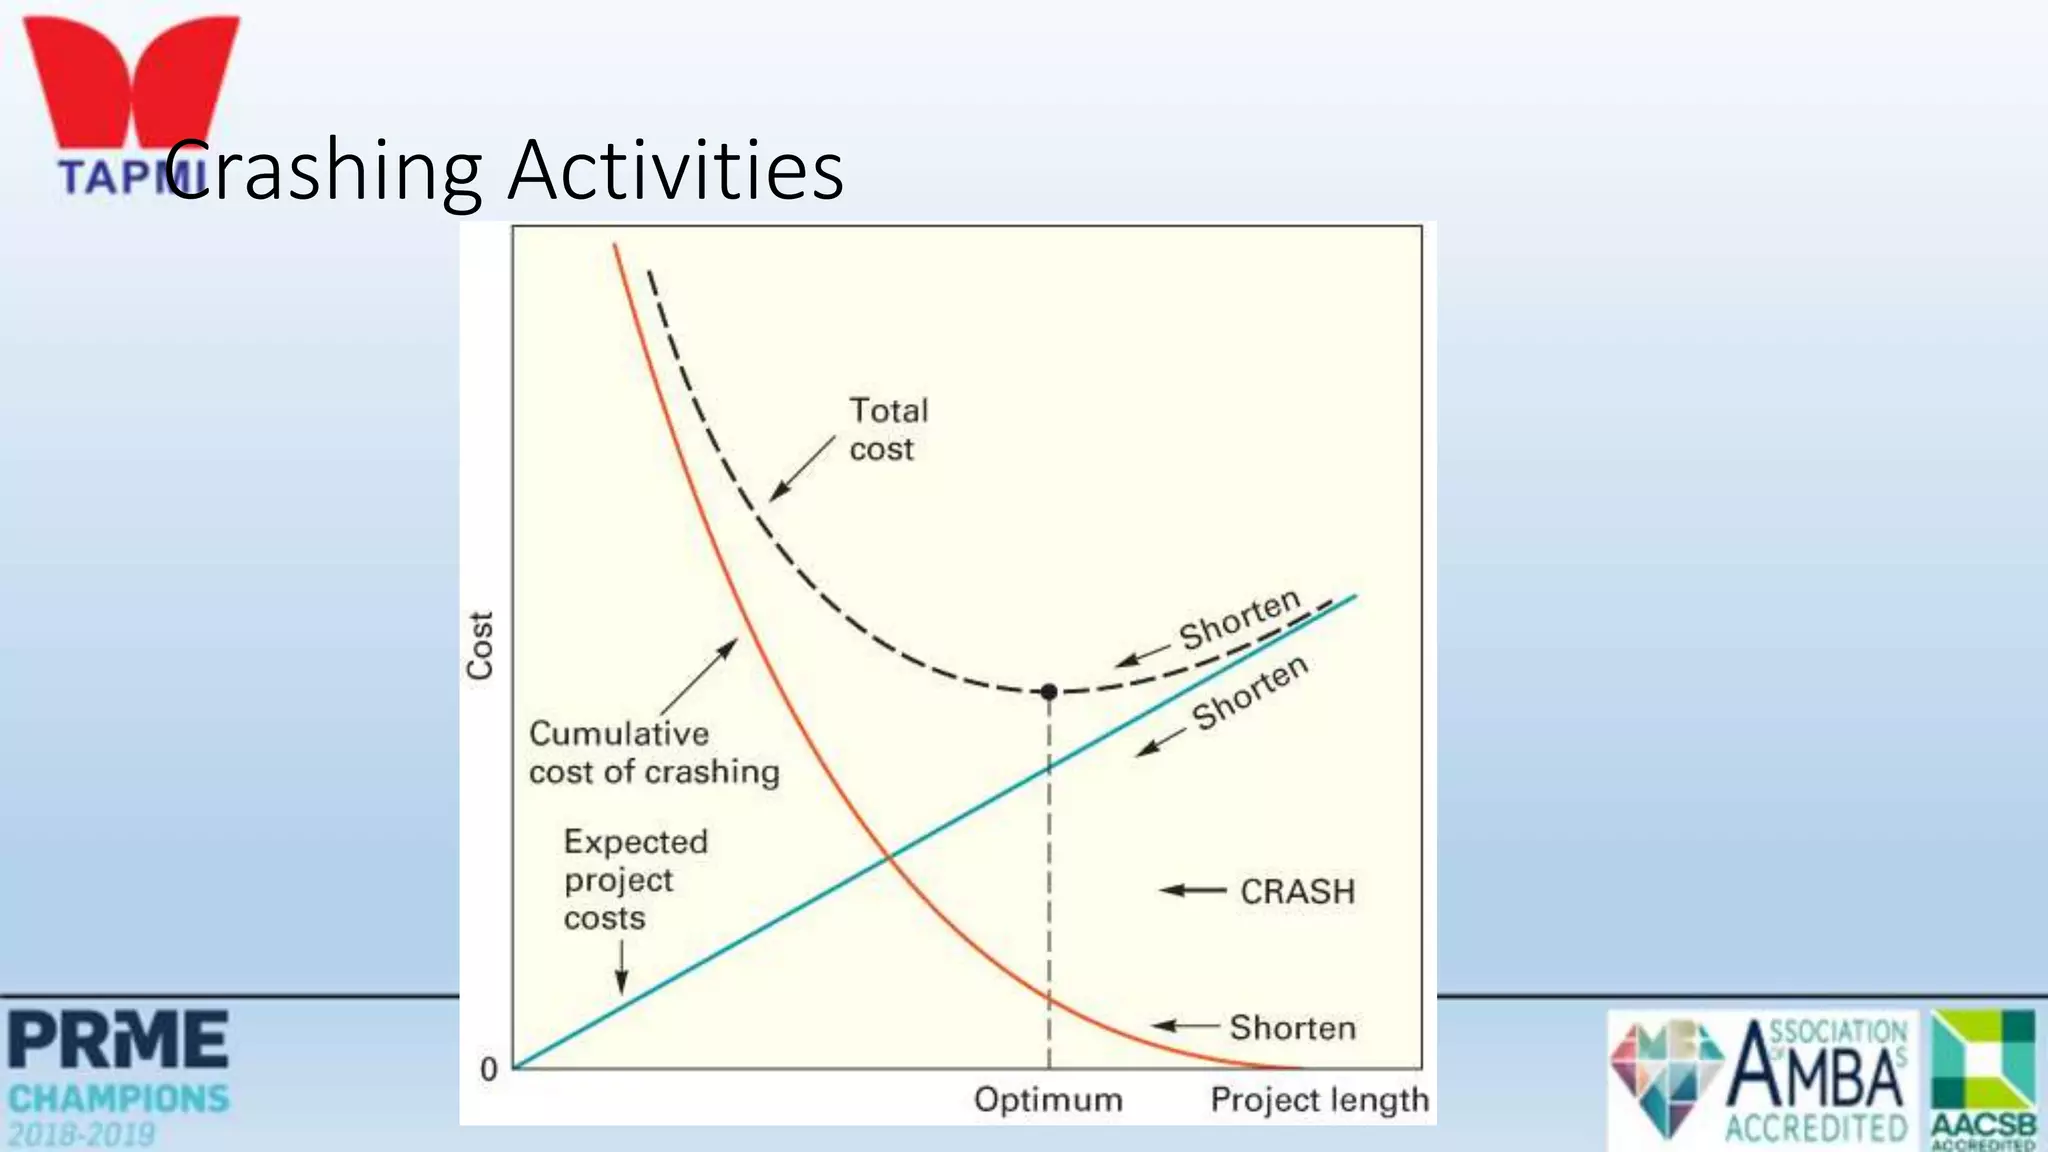
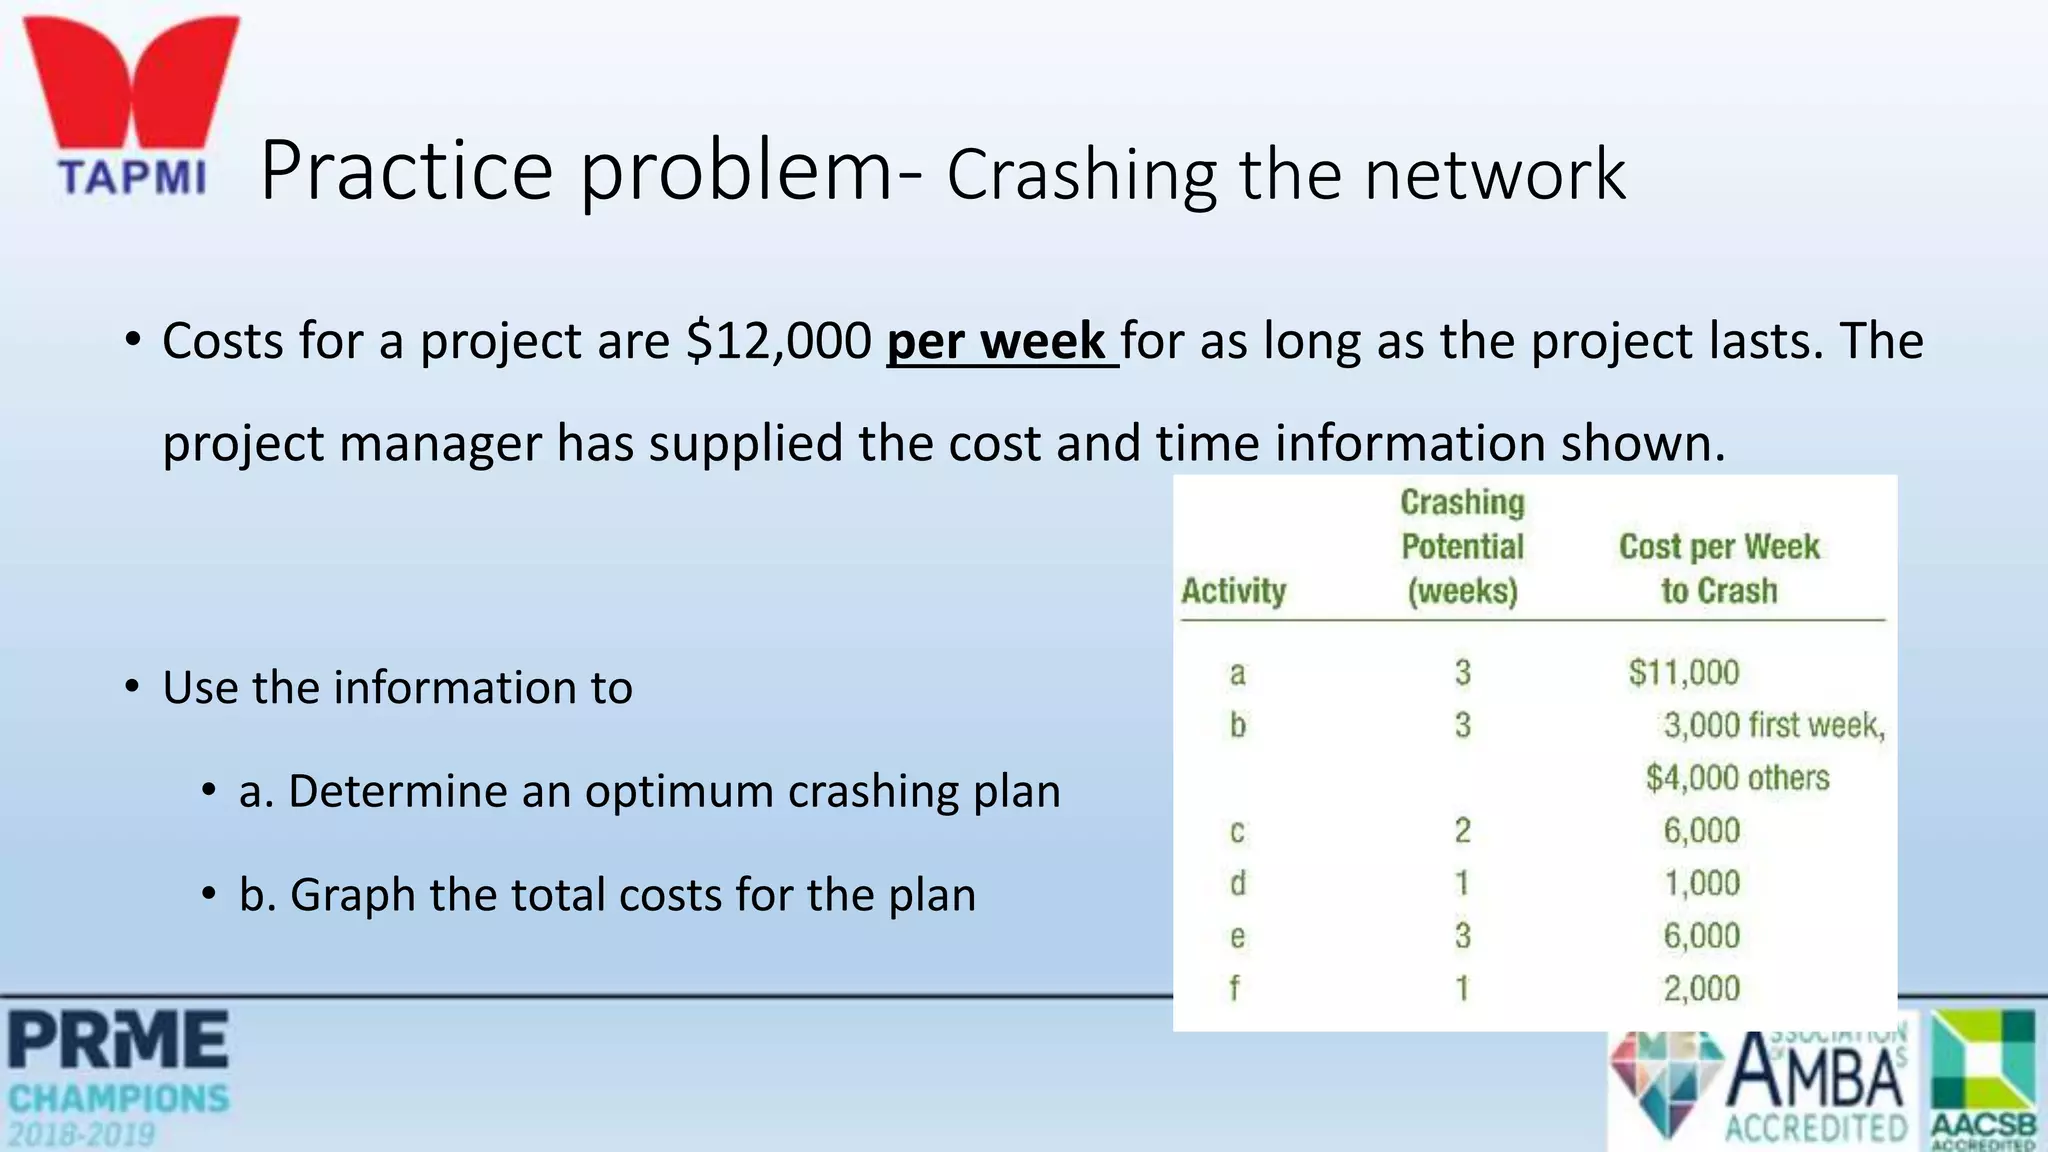
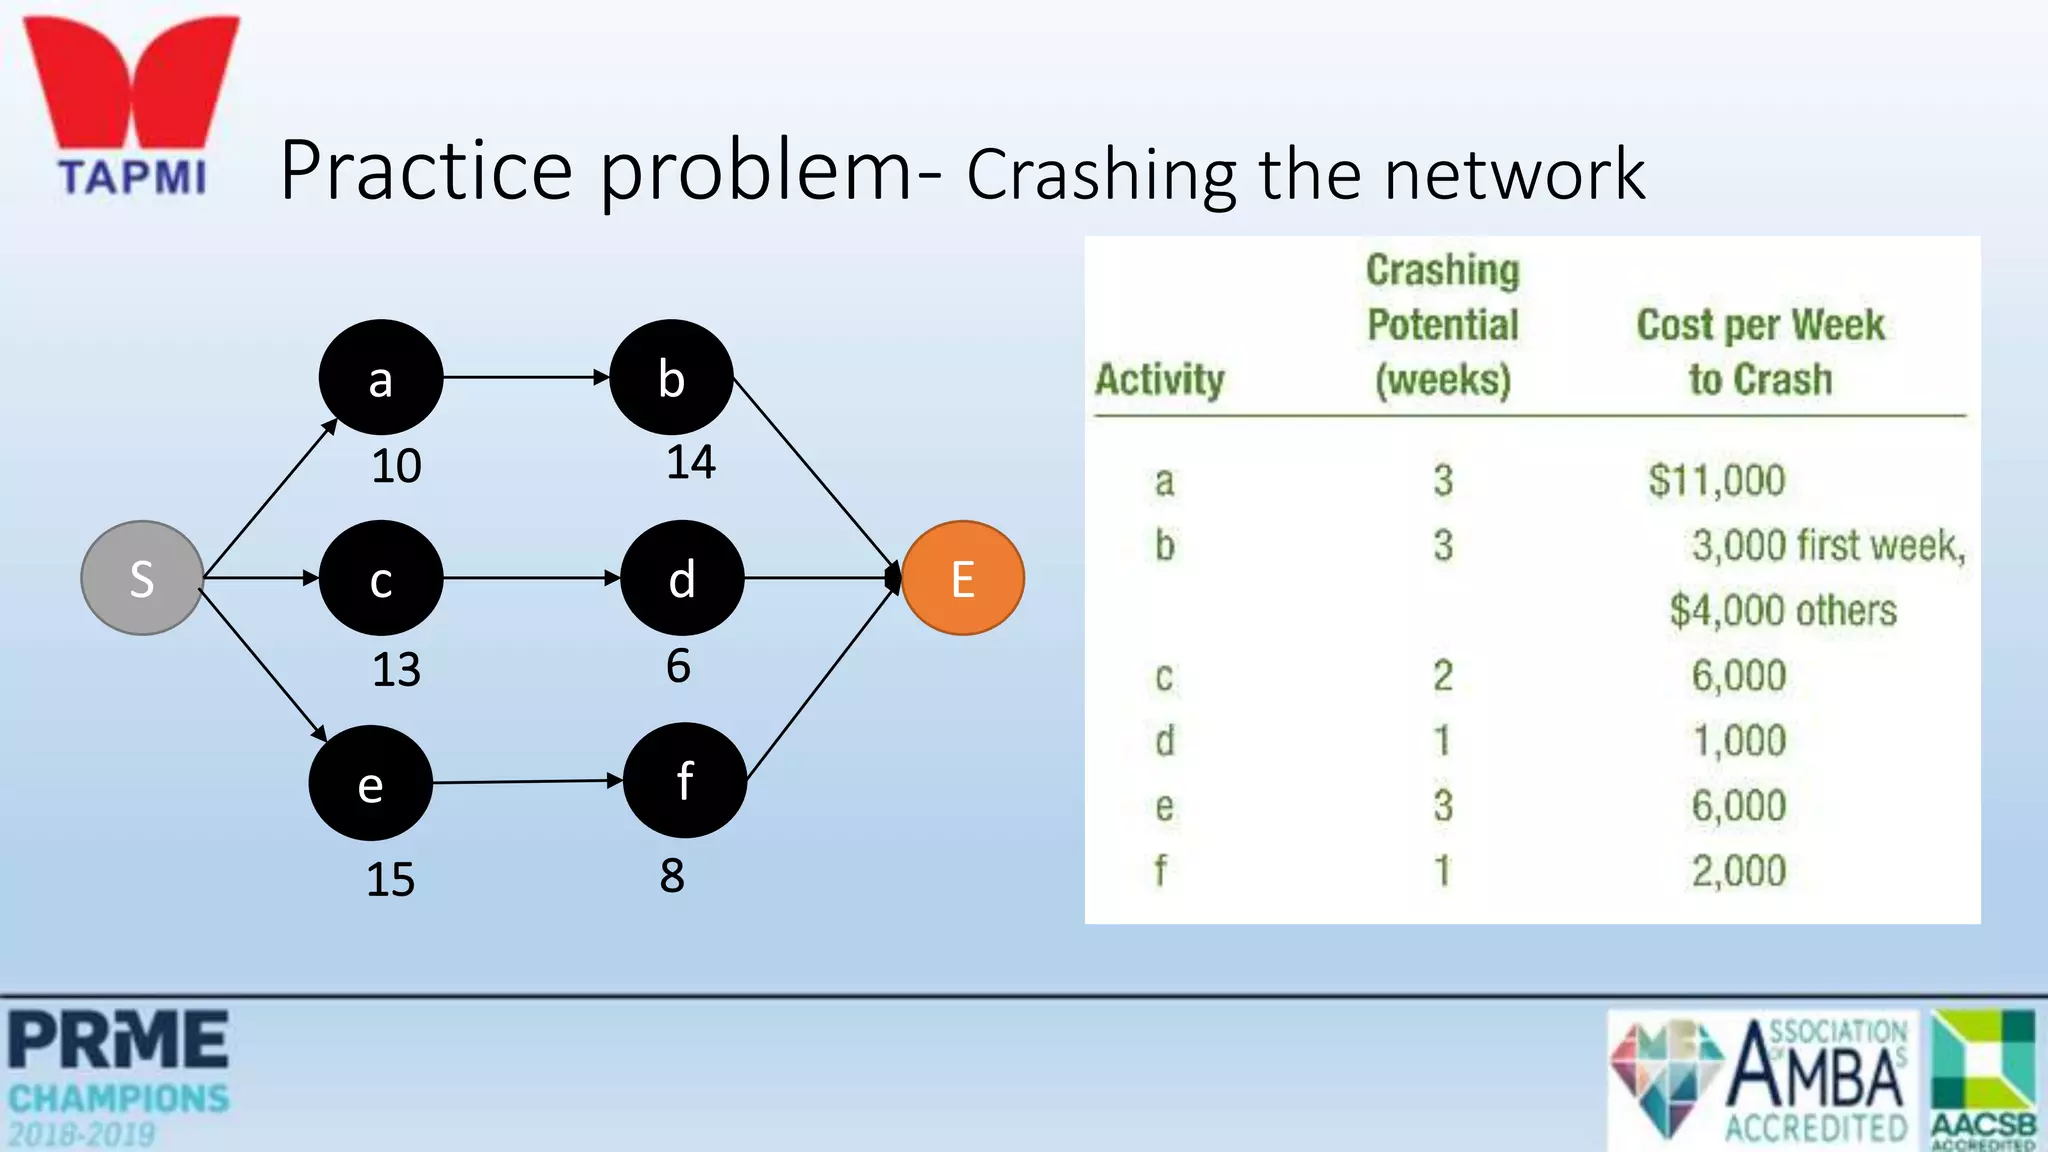
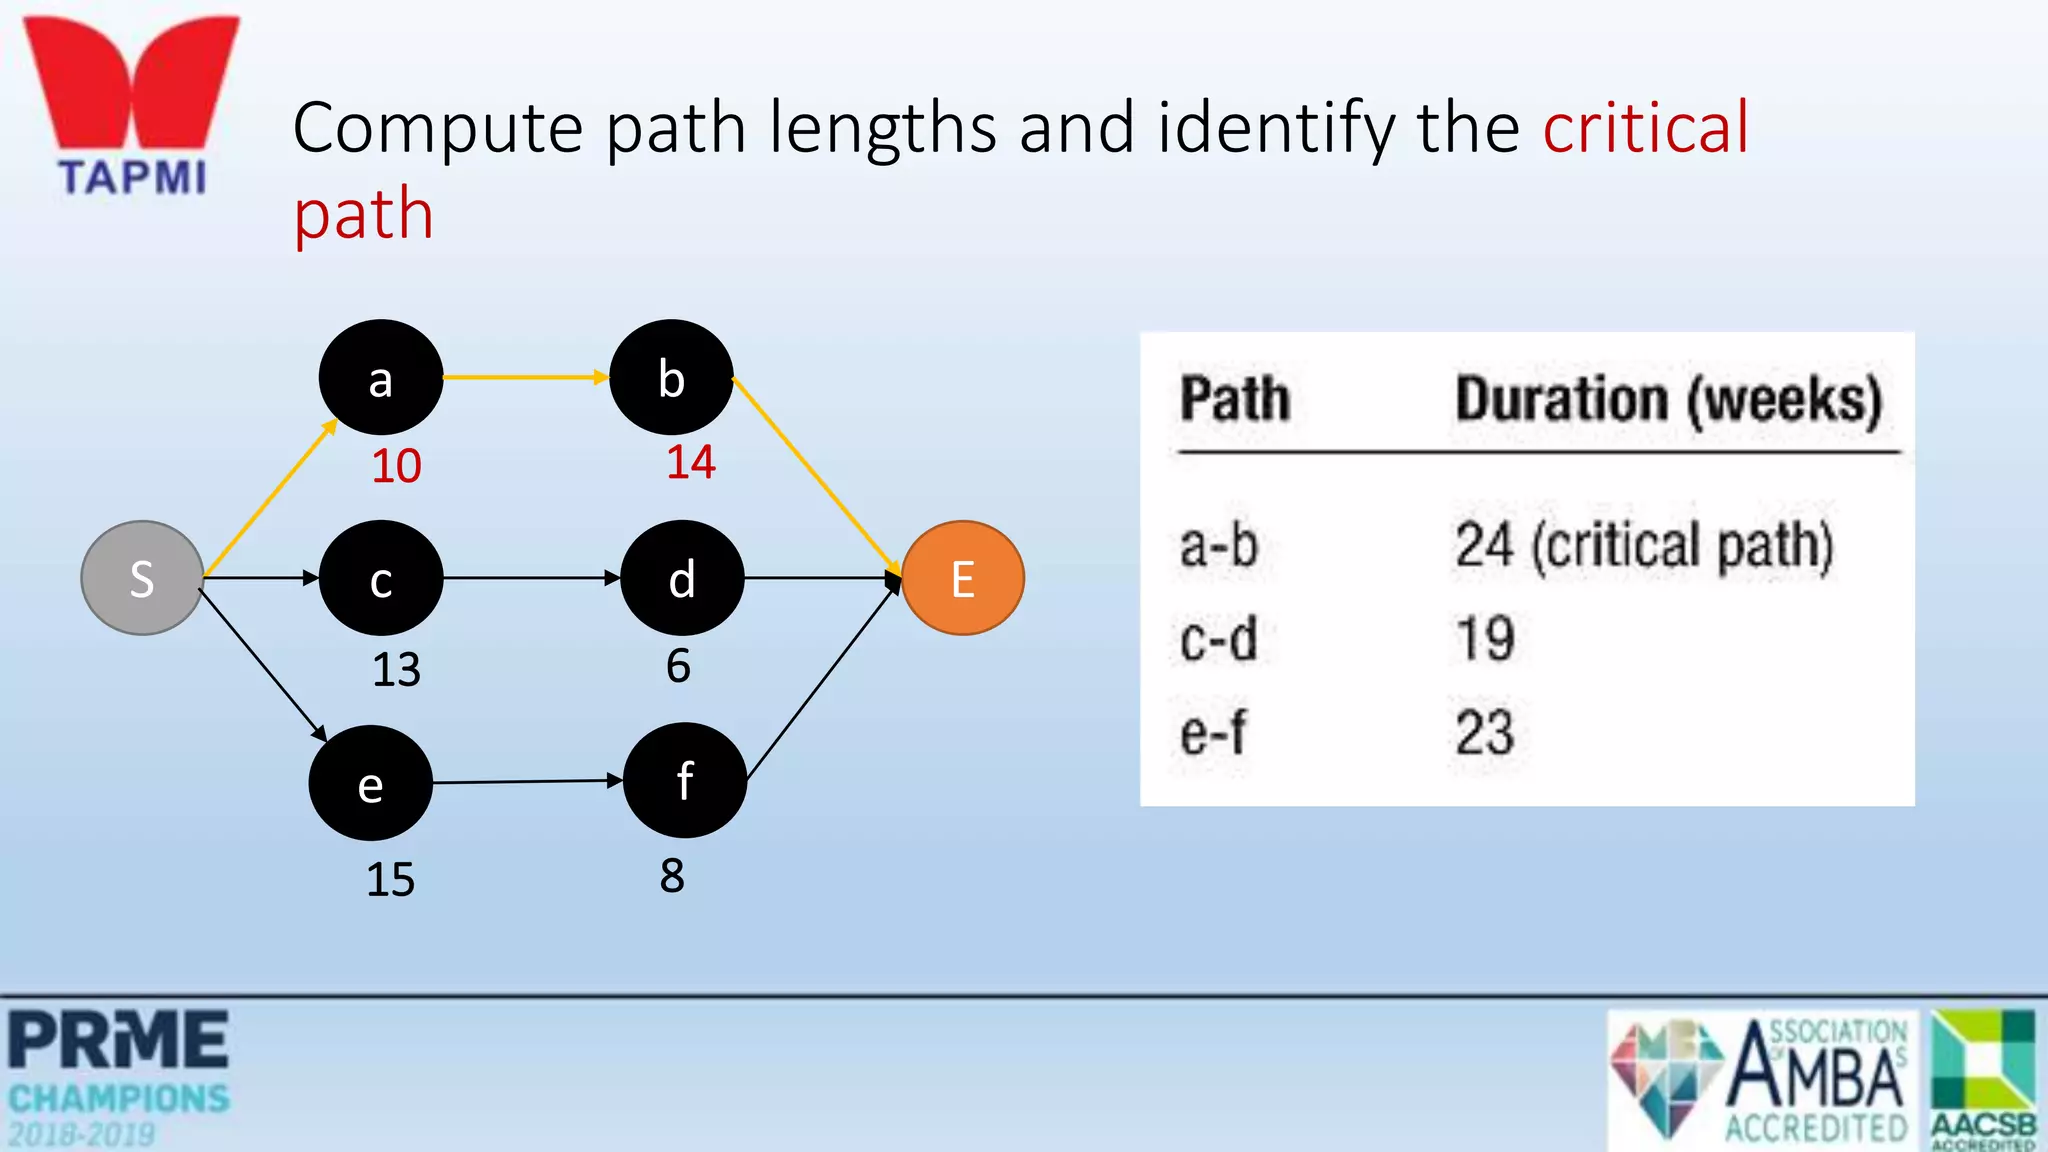
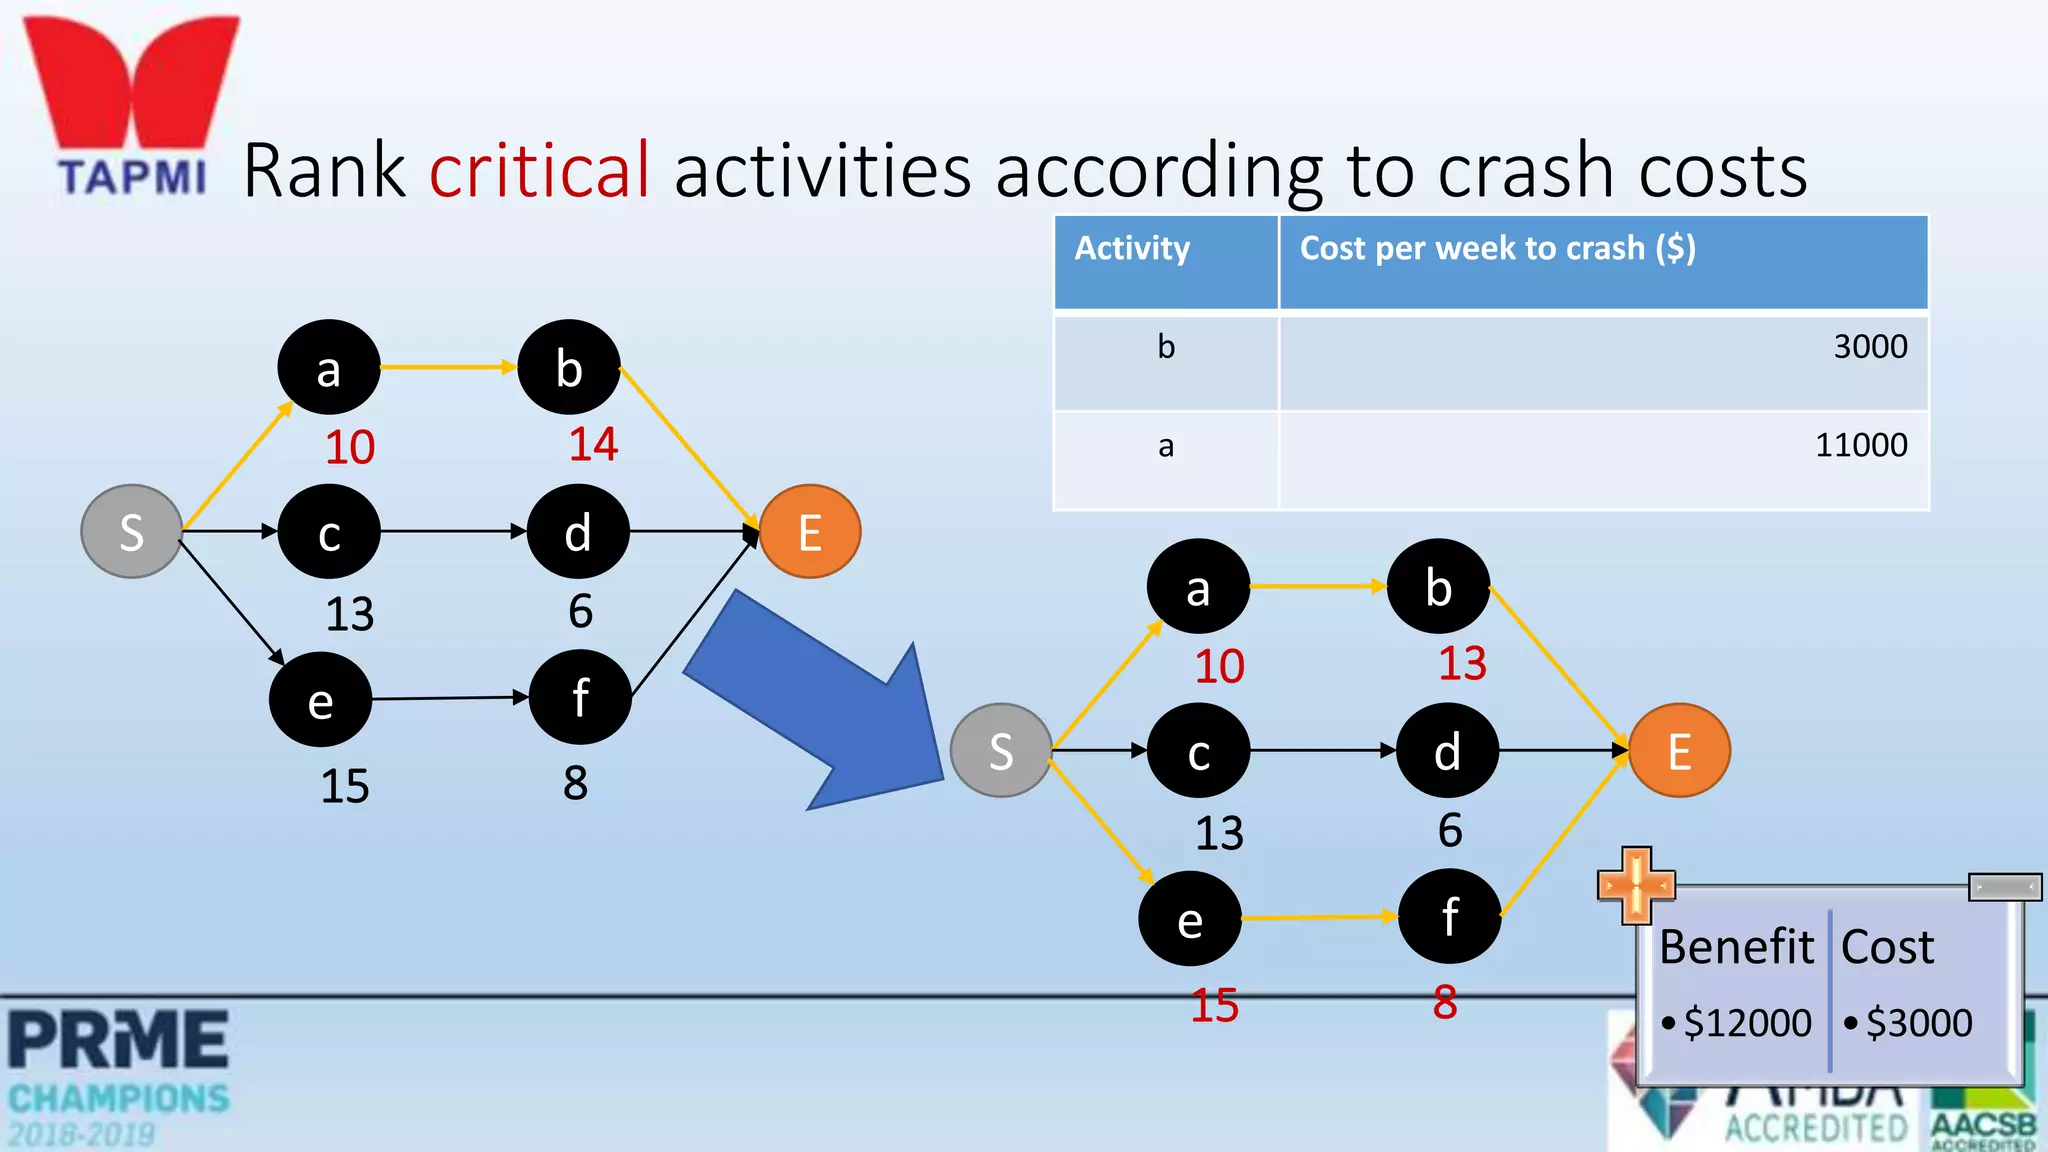
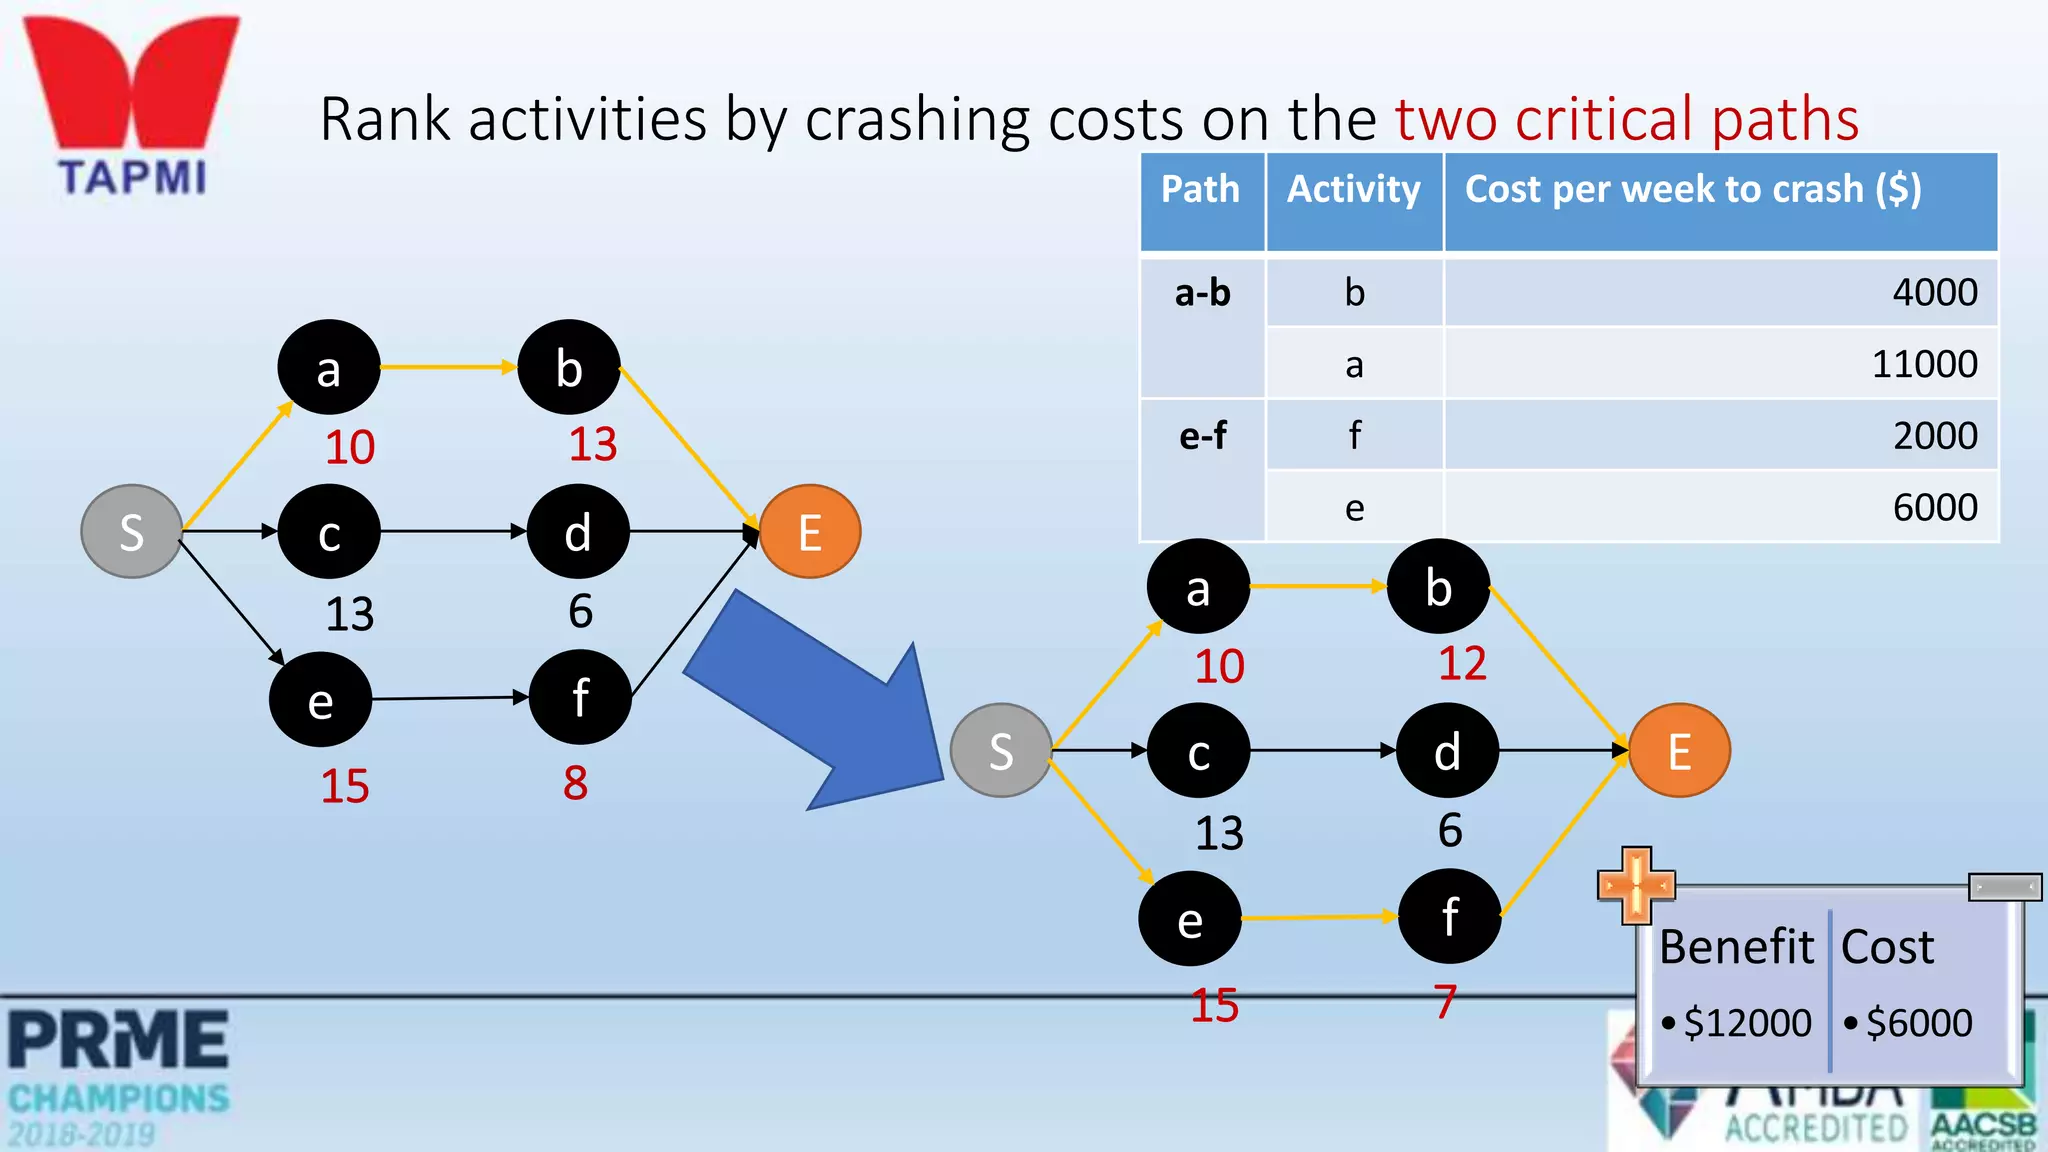
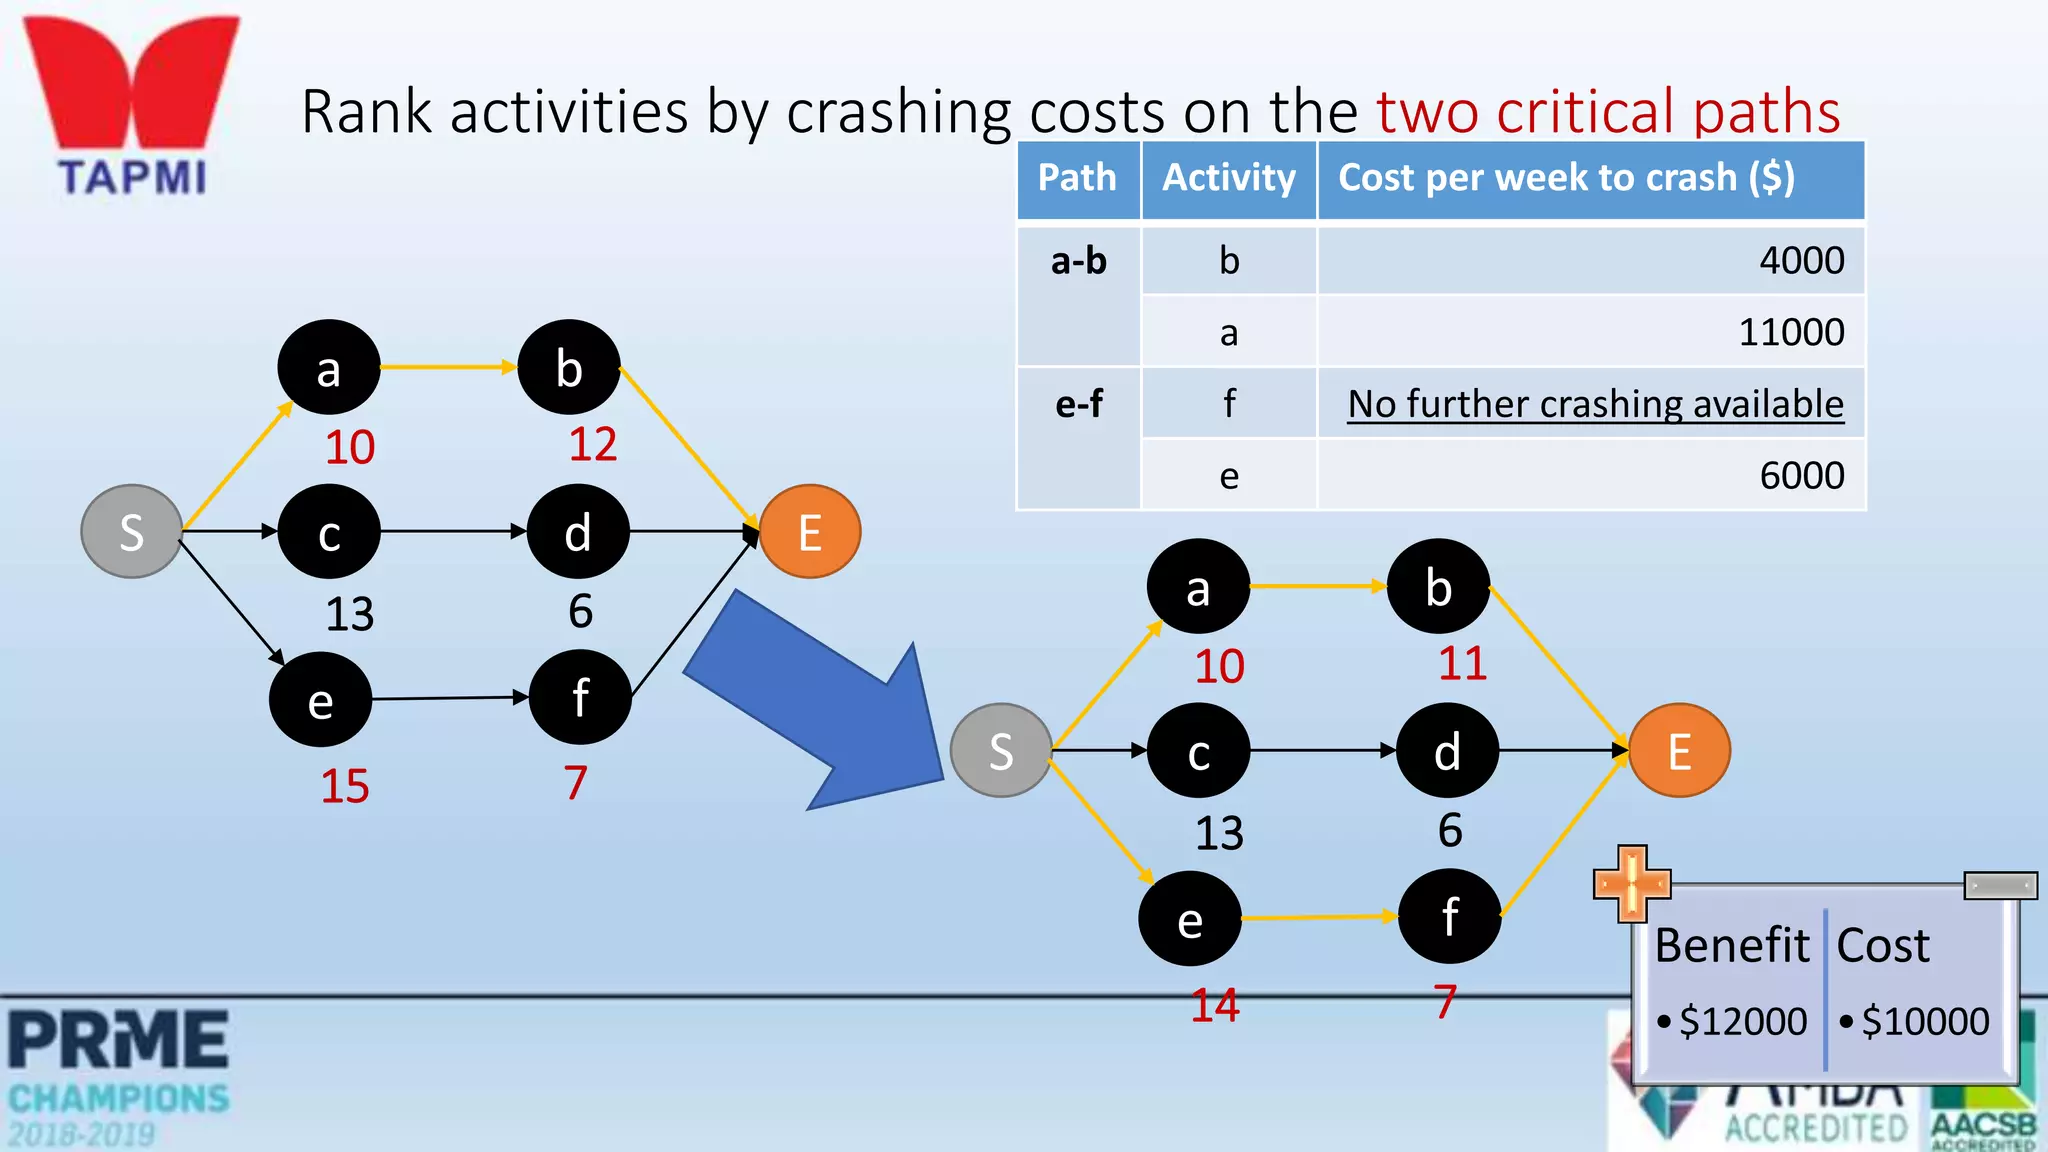
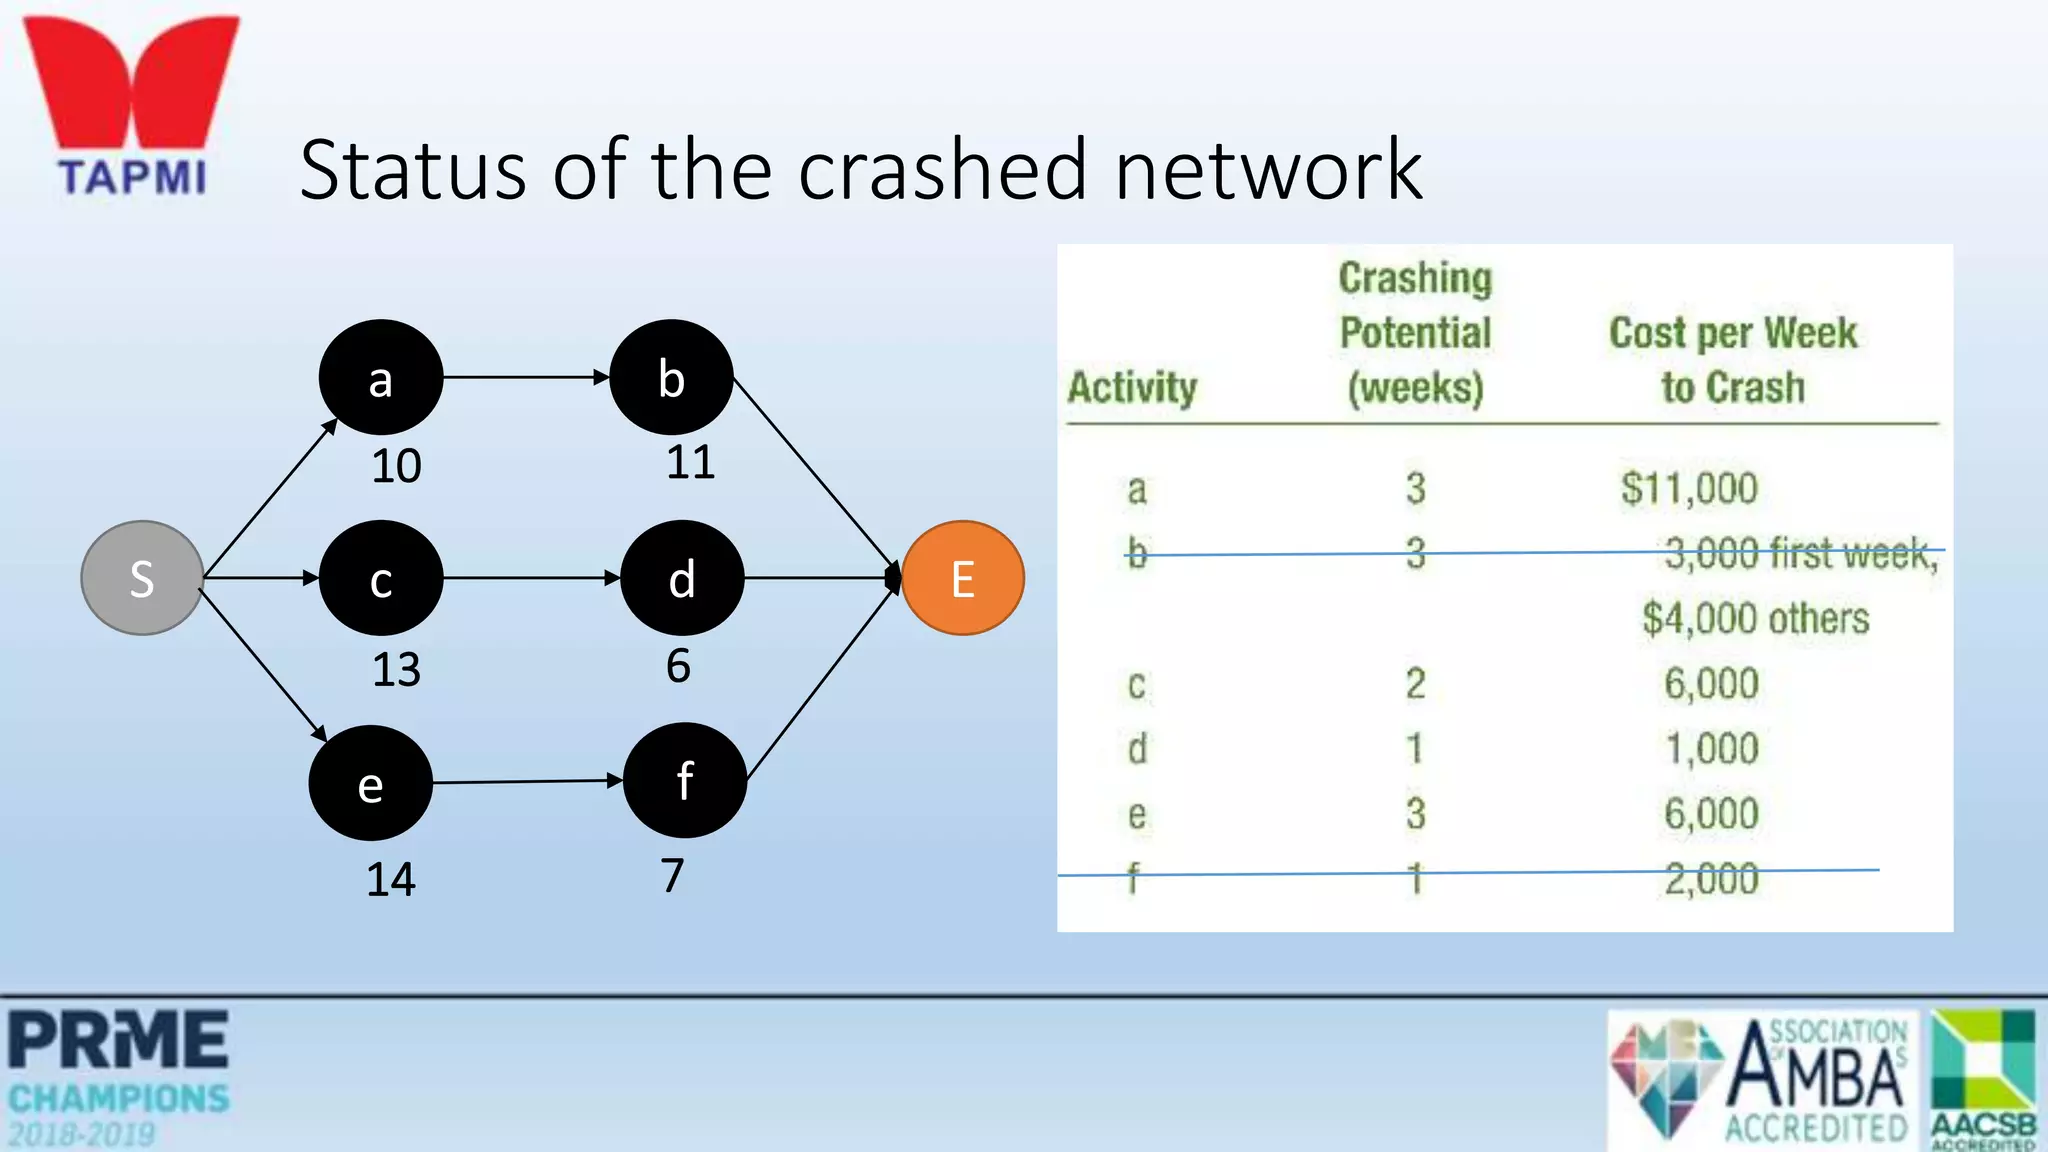
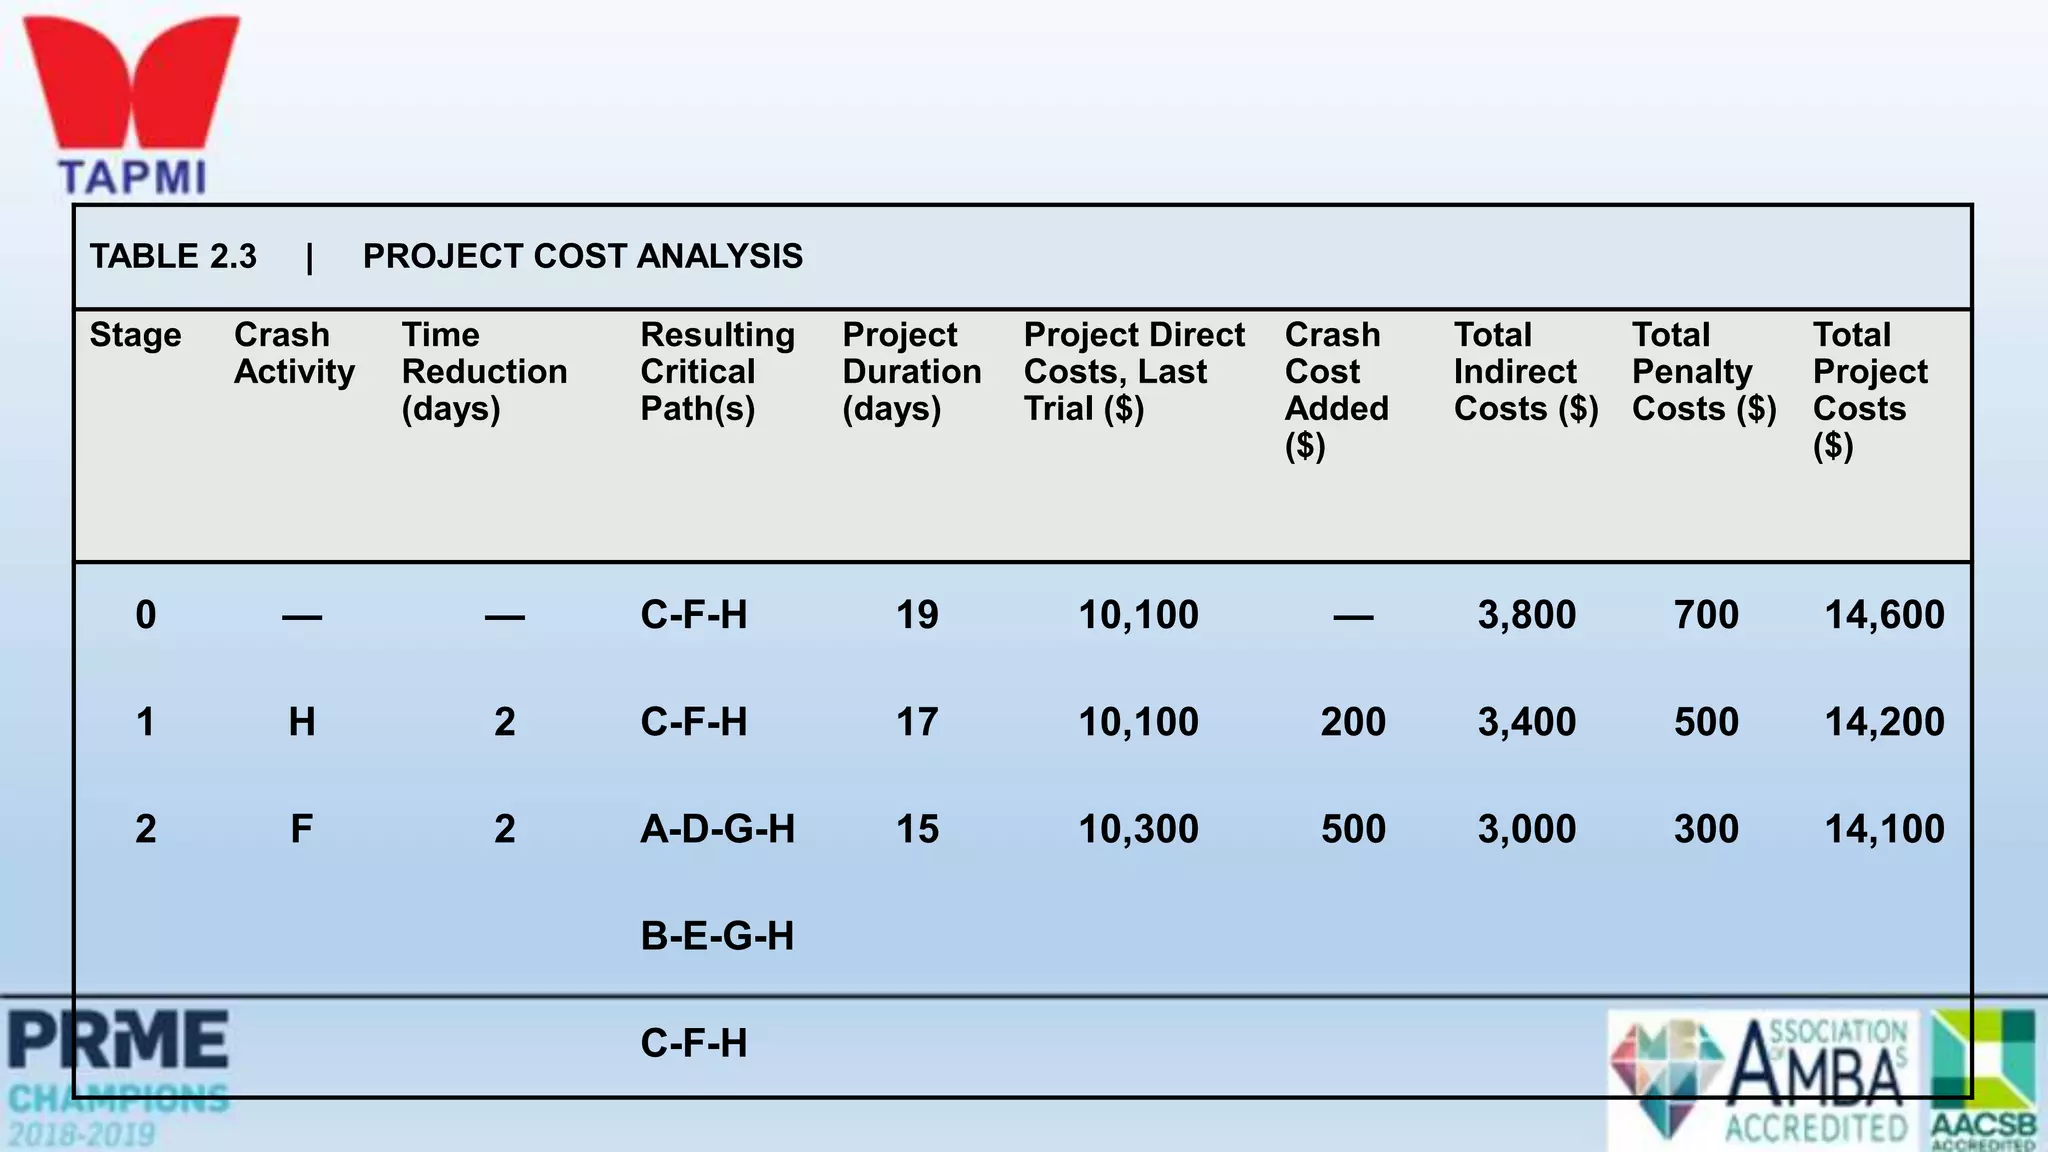
Project Management
Learning Objectives
 Describe the project life cycle
 Discuss the behavioral aspects of projects
 Explain the nature and importance of a work breakdown structure
 Give a general description of PERT/CPM techniques
 Construct simple network diagrams
 Analyze networks with deterministic times
 Analyze networks with probabilistic times
Projects
Unique, one-time operations designed to accomplish a
specific set of objectives in a limited time frame
The three main goals are to:
• Complete the project on time
• Not exceed the budget
• Meet the specifications to the satisfactions of the customer
Examples of Projects
 Building Construction
 Research Project
The Nature of Projects
• Projects go through a series of stages – a life cycle
• Projects bring together people with a diversity of knowledge and skills,
most of whom remain associated with the project for less than its full
life
• Organizational structure affects how projects are managed
Project Life Cycle
Initiating
Planning
Executing
Monitoring and
Controlling
Closing
Project Manager
• The project manager is ultimately responsible for the success or failure
of the project
• The project manager must effectively manage:
• The work
• The human resources
• Communications
• Quality
• Time
• Costs
Behavioral Issues
• Behavioral problems can be created or exacerbated by
• Decentralized decision making
• Stress of achieving project milestones on time and within budget
• Surprises
• The team must be able to function as a unit
• Interpersonal and coping skills are very important
• Conflict resolution & negotiation is vital part of a project manager’s job
Project Planning, Scheduling, and Controlling
Before Start of project During
project Timeline project
The Project Management Triangle
Quality
Performance Objectives
Project Planning
 Establishing objectives
 Defining project
 Creating work breakdown structure
 Determining
resources
 Forming organization
Work Breakdown Structure (WBS)
• A hierarchical listing of what must be done during a project
• Establishes a logical framework for identifying the required activities
for the project
1. Identify the major elements of the project
2. Identify the major supporting activities for each of the major
elements
3. Break down each major supporting activity into a list of the
activities that will be needed to accomplish it
WBS
Work Breakdown Structure
Level
1. Project
2. Major tasks in the project
3. Subtasks in the major tasks
4. Activities (or work packages)
to be completed
Work Breakdown Structure
Level ID
Level Number Activity
1 1.0 Develop/launch Windows Vista OS
2 1.1 Develop of GUIs
2 1.2 Ensure compatibility with earlier
Windows versions
3 1.21 Compatibility with Windows ME
3 1.22 Compatibility with Windows XP
3 1.23 Compatibility with Windows 2000
4 1.231 Ensure ability to import files
Before Start of project During
project Timeline project
Project Planning, Scheduling, and Controlling
Project Scheduling
 Identifying precedence
relationships
 Sequencing activities
 Determining activity times & costs
 Estimating material & worker
requirements
 Determining critical activities
A Simple Gantt Chart - Bank’s plan to establish new marketing department
Before Start of project During
project Timeline project
Project Planning, Scheduling, and Controlling
Before Start of project During
project Timeline project
Project Planning, Scheduling, and Controlling
Before Start of project During
project Timeline project
Budgets
Delayed activities report
Slack activities report
Time/cost estimates
Budgets
Engineering diagrams
Cash flow charts
Material availability details
CPM/PERT
Gantt charts
Milestone charts
Cash flow schedules
Project Planning, Scheduling, and Controlling
PERT and CPM
 Developed in 1950’s
 CPM by DuPont for chemical plants (1957)
 PERT by Booz, Allen & Hamilton with the U.S. Navy, for Polaris missile (1958)
 Consider precedence relationships and interdependencies
 Each uses a different estimate of activity times
• By using PERT or CPM Managers can obtain:
1. A graphical display of project activities
2. An estimate of how long the project will take
3. An indication of which activities are most critical to timely project completion
4. An indication of how long any activity can be delayed without delaying the project
Six Steps PERT & CPM
1. Define the project and prepare the work breakdown structure
2. Develop relationships among the activities - decide which activities must
precede and which must follow others
3. Draw the network connecting all of the activities
Six Steps PERT & CPM
4. Assign time and/or cost estimates to each activity
5. Compute the longest time path through the network – this is called the
critical path
6. Use the network to help plan, schedule, monitor, and control the project
Network Diagram
• Diagram of project activities that shows sequential relationships by use of
arrows and nodes
• Activity on arrow (AOA)
• Network diagram convention in which arrows designate activities
• Activity on node (AON)
• Network convention in which nodes designate activities
• Activities
• Project steps that consume resources and/or time
• Events
• The starting and finishing of activities
Node
Construct simple network diagram
a
c
b
d
Start
End
Network Conventions
AON – Example(Bank setup new marketing department)
Deterministic Time Estimates
• Deterministic
• Time estimates that are fairly certain
• Probabilistic
• Time estimates that allow for variation
Practice problem – CPM (AON Diagram)
Practice problem – CPM (AON Diagram with brackets added)
Early Start, Early Finish
• Finding ES and EF involves a forward pass through the network diagram
• Early start (ES)
• The earliest time an activity can start
• Assumes all preceding activities start as early as possible
• For nodes with one entering arrow
• ES = EF of the entering arrow
• For activities leaving nodes with multiple entering arrows
• ES = the largest of the largest entering EF
• Early finish (EF)
• The earliest time an activity can finish
• EF = ES + t
Late Start, Late Finish
• Finding LS and LF involves a backward pass through the network diagram
• Late Start (LS)
• The latest time the activity can start and not delay the project
• The latest starting time for each activity is equal to its latest finishing time minus its
expected duration:
• LS = LF - t
• Late Finish (LF)
• The latest time the activity can finish and not delay the project
• For nodes with one leaving arrow, LF for nodes entering that node equals the LS of the
leaving arrow
• For nodes with multiple leaving arrows, LF for arrows entering node equals the smallest of
the leaving arrows
Forward Pass
Begin at starting event and work forward
Earliest Start Time Rule:
 If an activity has only a single immediate predecessor, its ES equals the
EF of the predecessor
 If an activity has multiple immediate predecessors, its ES is the
maximum of all the EF values of its predecessors
ES = Max {EF of all immediate predecessors}
Begin at starting event and work forward
Earliest Finish Time Rule:
 The earliest finish time (EF) of an activity is the sum of its earliest start
time (ES) and its activity time
EF = ES + Activity time
Forward Pass
Practice problem – CPM (Forward Pass)
Backward Pass
Begin with the last event and work backwards
Latest Finish Time Rule:
 If an activity is an immediate predecessor for just a single activity, its LF
equals the LS of the activity that immediately follows it
 If an activity is an immediate predecessor to more than one activity, its LF
is the minimum of all LS values of all activities that immediately follow it
LF = Min {LS of all immediate following activities}
Begin with the last event and work backwards
Latest Start Time Rule:
 The latest start time (LS) of an activity is the difference of its latest finish
time (LF) and its activity time
LS = LF – Activity time
Backward Pass
Practice problem – CPM (Backward Pass)
Practice problem – CPM (Critical path)
Computing Slack Time
After computing the ES, EF, LS, and LF times for all activities, compute the
slack or free time for each activity
Slack is the length of time an activity can be delayed without delaying the
entire project
Slack = LS – ES or Slack = LF – EF
Practice problem – CPM (Slack)
0
0
0
2
2
6
6
Using Slack Times
• Knowledge of slack times provides managers with information for planning
allocation of scarce resources
• Control efforts will be directed toward those activities that might be most susceptible to
delaying the project
• Activity slack times are based on the assumption that all of the activities on the same path
will be started as early as possible and not exceed their expected time
• If two activities are on the same path and have the same slack, this will be the total slack
available to both
Determining the Project Schedule
• The critical path is the longest path through the network
• The critical path is the shortest time in which the project can be completed
• Any delay in critical path activities delays the project
• Critical path activities have no slack time
Perform a Critical Path Analysis
Variability in Activity Times
 CPM assumes we know a fixed time estimate for each activity and
there is no variability in activity times
 PERT uses a probability distribution for activity times to allow for
variability
Probabilistic Time Estimates
• The beta distribution is generally used to describe the inherent
variability in time estimates
• The probabilistic approach involves three time estimates:
• Optimistic time, (to)
• The length of time required under optimal conditions
• Pessimistic time, (tp)
• The length of time required under the worst conditions
• Most likely time, (tm)
• The most probable length of time required
The Beta Distribution
Probabilistic Time Estimates
• The expected time, te ,for an activity is a weighted average of the
three time estimates:
• The expected duration of a path is equal to the sum of the expected
times of the activities on that path:
6
4 p
m
o
e
t
t
t
t




 path
on the
activities
of
times
expected
of
Path time
Example- PERT
Example- PERT
Example- PERT – (Critical Path)
Total duration is 16 days
Probabilistic Time Estimates
• The standard deviation of each activity’s time is estimated as one-sixth of
the difference between the pessimistic and optimistic time estimates. The
variance is the square of the standard deviation:
• Standard deviation of the expected time for the path
  2
2
6





 

o
p t
t

 

 path
on
activities
of
Variances
path

Example- PERT
Knowledge of Path Statistics
• Knowledge of expected path times and their standard deviations
enables managers to compute probabilistic estimates about project
completion such as:
• The probability that the project will be completed by a certain time
• The probability that the project will take longer than its expected
completion time
PERT makes two more assumptions:
Total project completion times follow a normal probability
distribution
Activity times are statistically independent
Probability of Project Completion
Path Probabilities
• Calculating path probabilities involves the use of the normal
distribution
• Although path activities are represented by the beta distribution,
the path distribution can be represented by a normal distribution
Determining Path Probabilities
deviation
standard
Path
mean
Path
-
time
Specified

z
Project Completion Time
• A project is not complete until all project activities are complete
• It is risky to only consider the critical path when assessing the probability of
completing a project within a specified time.
• To determine the probability of completing the project within a particular time frame
• Calculate the probability that each path in the project will be completed within the
specified time
• Multiply these probabilities
• The result is the probability that the project will be completed within the
specified time
What's the probability of project completion in 17 weeks of its start?
deviation
standard
Path
mean
Path
-
time
Specified

z
What's the probability of project completion in 17 weeks of its start?
Probability of Project Completion
What's the probability of project completion in 15 weeks of its start?
What's the probability of project completion Not before 15 weeks of its start?
PERT: Advantages
• Among the most useful features of PERT:
1.It forces the manager to organize and quantify available
information and to identify where additional information is
needed
2.It provides a graphic display of the project and its major
activities
3.It identifies
a.Activities that should be closely watched
b.Activities that have slack time
Time-Cost Trade-Offs
• Activity time estimates are made for some given level of resources
• It may be possible to reduce the duration of a project by injecting
additional resources
• Motivations:
• To avoid late penalties
• Monetary incentives
• Free resources for use on other projects
Time-Cost Trade-Offs: Crashing
• Crashing
• Shortening activity durations
• Typically, involves the use of additional funds to support additional personnel or more efficient
equipment, and the relaxing of some work specifications
• The project duration may be shortened by increasing direct expenses (labor, materials
etc.), thereby realizing savings in indirect project costs (fixed cost)
Crashing Decisions
• To make decisions concerning crashing requires information about:
1. Regular time and crash time estimates for each activity
2. Regular cost and crash cost estimates for each activity
3. A list of activities that are on the critical path
• Critical path activities are potential candidates for crashing
• Crashing non-critical path activities would not have an impact on overall project duration
Crashing: Procedure
• General procedure:
1. Crash the project one period at a time
2. Crash the least expensive activity that is on the critical path
3. When there are multiple critical paths, find the sum of crashing the least expensive activity
on each critical path
• If two or more critical paths share common activities, compare the least expensive cost
of crashing a common activity shared by critical paths with the sum for the separate
critical paths
Crashing Activities
Practice problem- Crashing the network
• Costs for a project are $12,000 per week for as long as the project lasts. The
project manager has supplied the cost and time information shown.
• Use the information to
• a. Determine an optimum crashing plan
• b. Graph the total costs for the plan
Practice problem- Crashing the network
S
a b
E
c d
e f
10 14
13 6
15 8
Compute path lengths and identify the critical
path
S
a b
E
c d
e f
10 14
13 6
15 8
Rank critical activities according to crash costs
Activity Cost per week to crash ($)
b 3000
a 11000
S
a b
E
c d
e f
10 14
13 6
15 8
S
a b
E
c d
e f
10 13
13 6
15 8
Benefit
•$12000
Cost
•$3000
Rank activities by crashing costs on the two critical paths
Path Activity Cost per week to crash ($)
a-b b 4000
a 11000
e-f f 2000
e 6000
S
a b
E
c d
e f
10 13
13 6
15 8
S
a b
E
c d
e f
10 12
13 6
15 7
Benefit
•$12000
Cost
•$6000
Rank activities by crashing costs on the two critical paths
Path Activity Cost per week to crash ($)
a-b b 4000
a 11000
e-f f No further crashing available
e 6000
S
a b
E
c d
e f
10 12
13 6
15 7
S
a b
E
c d
e f
10 11
13 6
14 7
Benefit
•$12000
Cost
•$10000
Status of the crashed network
S
a b
E
c d
e f
10 11
13 6
14 7
Rank activities by crashing costs on the two critical paths
Path Activity Cost per week to crash ($)
a-b b No further crashing available
a 11000
e-f f No further crashing available
e 6000
S
a b
E
c d
e f
10 12
13 6
15 7
S
a b
E
c d
e f
9 11
13 6
13 7
Benefit
•$12000
Cost
•$17000
Summary of crashing process
Path N=0 1 2 3
a-b 24 23 22 21
c-d 19 19 19 19
e-f 23 23 22 21
Crashed Activity b b,f b,e
Crashing cost 3000 6000 10000
266
269
272
275
278
281
284
287
290
19 20 21 22 23 24 25
Total
costs($000)
Project duration (Days)
Project Classifications
-Goals and Methods Matrix
Type 2 Project
•Product devpt.
Type 4 project
•Research & Devpt
Type 1 Project
•Engineering
Type 3 Project
Application Software
Goals well defined
Yes No
Method well
defined
No
Yes
Greater Chance of
failure
Greater Chance of
Success
Problem
Your company has just received an order from a good customer for a specially designed electric
motor. The contract states that, starting on the thirteenth day from now, your firm will
experience a penalty of $100 per day until the job is completed. Indirect project costs amount to
$200 per day. The data on direct costs and activity precedent relationships are given in Table 2.2.
a. Draw the project network diagram.
b. What completion date would you recommend?
Solved Problem 1
ELECTRIC MOTOR PROJECT DATA
Activity Normal Time
(days)
Normal Cost ($) Crash Time
(days)
Crash Cost ($) Immediate Predecessor(s)
A 4 1,000 3 1,300 None
B 7 1,400 4 2,000 None
C 5 2,000 4 2,700 None
D 6 1,200 5 1,400 A
E 3 900 2 1,100 B
F 11 2,500 6 3,750 C
G 4 800 3 1,450 D, E
H 3 300 1 500 F, G
SOLUTION
a. The network diagram is shown in Figure 2.10. Keep the following points in mind while
constructing a network diagram.
1. Always have start and finish nodes.
2. Try to avoid crossing paths to keep the diagram simple.
3. Use only one arrow to directly
connect any two nodes.
4. Put the activities with no
predecessors at the left
and point the arrows
from left to right.
5. Be prepared to revise
the diagram several
times before you come
up with a correct
and uncluttered diagram.
Start
Finish
A
4
B
7
C
5
D
6
E
3
F
11
G
4
H
3
Figure 2.10
b. With these activity times, the project will be completed in 19 days and incur a
$700 penalty. Using the data in Table 2.2, you can determine the maximum
crash-time reduction and crash cost per day for each activity. For activity A
Maximum crash time = Normal time – Crash time =
4 days – 3 days = 1 day
Crash cost
per day
= =
Crash cost – Normal cost
Normal time – Crash time
CC – NC
NT – CT
= = $300
$1,300 – $1,000
4 days – 3 days
Activity Crash Cost per Day ($) Maximum Time Reduction (days)
A 300 1
B 200 3
C 700 1
D 200 1
E 200 1
F 250 5
G 650 1
H 100 2
Table 2.3 summarizes the analysis and the resultant project duration and total
cost. The critical path is C–F–H at 19 days, which is the longest path in the
network. The cheapest activity to crash is H which, when combined with reduced
penalty costs, saves $300 per day (200–Indirect cost+100-Penalty). Crashing this
activity for two days gives
A–D–G–H: 15 days, B–E–G–H: 15 days, and C–F–H: 17 days
Crash activity F next. This makes all activities critical and no more crashing should
be done as the cost of crashing exceeds the savings.
TABLE 2.3 | PROJECT COST ANALYSIS
Stage Crash
Activity
Time
Reduction
(days)
Resulting
Critical
Path(s)
Project
Duration
(days)
Project Direct
Costs, Last
Trial ($)
Crash
Cost
Added
($)
Total
Indirect
Costs ($)
Total
Penalty
Costs ($)
Total
Project
Costs
($)
0 — — C-F-H 19 10,100 — 3,800 700 14,600
1 H 2 C-F-H 17 10,100 200 3,400 500 14,200
2 F 2 A-D-G-H 15 10,300 500 3,000 300 14,100
B-E-G-H
C-F-H

Project Management.pptx

  • 1.
  • 2.
    Learning Objectives  Describethe project life cycle  Discuss the behavioral aspects of projects  Explain the nature and importance of a work breakdown structure  Give a general description of PERT/CPM techniques  Construct simple network diagrams  Analyze networks with deterministic times  Analyze networks with probabilistic times
  • 3.
    Projects Unique, one-time operationsdesigned to accomplish a specific set of objectives in a limited time frame The three main goals are to: • Complete the project on time • Not exceed the budget • Meet the specifications to the satisfactions of the customer
  • 4.
    Examples of Projects Building Construction  Research Project
  • 5.
    The Nature ofProjects • Projects go through a series of stages – a life cycle • Projects bring together people with a diversity of knowledge and skills, most of whom remain associated with the project for less than its full life • Organizational structure affects how projects are managed
  • 6.
  • 7.
    Project Manager • Theproject manager is ultimately responsible for the success or failure of the project • The project manager must effectively manage: • The work • The human resources • Communications • Quality • Time • Costs
  • 8.
    Behavioral Issues • Behavioralproblems can be created or exacerbated by • Decentralized decision making • Stress of achieving project milestones on time and within budget • Surprises • The team must be able to function as a unit • Interpersonal and coping skills are very important • Conflict resolution & negotiation is vital part of a project manager’s job
  • 9.
    Project Planning, Scheduling,and Controlling Before Start of project During project Timeline project
  • 10.
    The Project ManagementTriangle Quality Performance Objectives
  • 11.
    Project Planning  Establishingobjectives  Defining project  Creating work breakdown structure  Determining resources  Forming organization
  • 12.
    Work Breakdown Structure(WBS) • A hierarchical listing of what must be done during a project • Establishes a logical framework for identifying the required activities for the project 1. Identify the major elements of the project 2. Identify the major supporting activities for each of the major elements 3. Break down each major supporting activity into a list of the activities that will be needed to accomplish it
  • 13.
  • 14.
    Work Breakdown Structure Level 1.Project 2. Major tasks in the project 3. Subtasks in the major tasks 4. Activities (or work packages) to be completed
  • 15.
    Work Breakdown Structure LevelID Level Number Activity 1 1.0 Develop/launch Windows Vista OS 2 1.1 Develop of GUIs 2 1.2 Ensure compatibility with earlier Windows versions 3 1.21 Compatibility with Windows ME 3 1.22 Compatibility with Windows XP 3 1.23 Compatibility with Windows 2000 4 1.231 Ensure ability to import files
  • 16.
    Before Start ofproject During project Timeline project Project Planning, Scheduling, and Controlling
  • 17.
    Project Scheduling  Identifyingprecedence relationships  Sequencing activities  Determining activity times & costs  Estimating material & worker requirements  Determining critical activities
  • 18.
    A Simple GanttChart - Bank’s plan to establish new marketing department
  • 19.
    Before Start ofproject During project Timeline project Project Planning, Scheduling, and Controlling
  • 20.
    Before Start ofproject During project Timeline project Project Planning, Scheduling, and Controlling
  • 21.
    Before Start ofproject During project Timeline project Budgets Delayed activities report Slack activities report Time/cost estimates Budgets Engineering diagrams Cash flow charts Material availability details CPM/PERT Gantt charts Milestone charts Cash flow schedules Project Planning, Scheduling, and Controlling
  • 22.
    PERT and CPM Developed in 1950’s  CPM by DuPont for chemical plants (1957)  PERT by Booz, Allen & Hamilton with the U.S. Navy, for Polaris missile (1958)  Consider precedence relationships and interdependencies  Each uses a different estimate of activity times • By using PERT or CPM Managers can obtain: 1. A graphical display of project activities 2. An estimate of how long the project will take 3. An indication of which activities are most critical to timely project completion 4. An indication of how long any activity can be delayed without delaying the project
  • 23.
    Six Steps PERT& CPM 1. Define the project and prepare the work breakdown structure 2. Develop relationships among the activities - decide which activities must precede and which must follow others 3. Draw the network connecting all of the activities
  • 24.
    Six Steps PERT& CPM 4. Assign time and/or cost estimates to each activity 5. Compute the longest time path through the network – this is called the critical path 6. Use the network to help plan, schedule, monitor, and control the project
  • 25.
    Network Diagram • Diagramof project activities that shows sequential relationships by use of arrows and nodes • Activity on arrow (AOA) • Network diagram convention in which arrows designate activities • Activity on node (AON) • Network convention in which nodes designate activities • Activities • Project steps that consume resources and/or time • Events • The starting and finishing of activities Node
  • 26.
    Construct simple networkdiagram a c b d Start End
  • 27.
  • 28.
    AON – Example(Banksetup new marketing department)
  • 29.
    Deterministic Time Estimates •Deterministic • Time estimates that are fairly certain • Probabilistic • Time estimates that allow for variation
  • 30.
    Practice problem –CPM (AON Diagram)
  • 31.
    Practice problem –CPM (AON Diagram with brackets added)
  • 32.
    Early Start, EarlyFinish • Finding ES and EF involves a forward pass through the network diagram • Early start (ES) • The earliest time an activity can start • Assumes all preceding activities start as early as possible • For nodes with one entering arrow • ES = EF of the entering arrow • For activities leaving nodes with multiple entering arrows • ES = the largest of the largest entering EF • Early finish (EF) • The earliest time an activity can finish • EF = ES + t
  • 33.
    Late Start, LateFinish • Finding LS and LF involves a backward pass through the network diagram • Late Start (LS) • The latest time the activity can start and not delay the project • The latest starting time for each activity is equal to its latest finishing time minus its expected duration: • LS = LF - t • Late Finish (LF) • The latest time the activity can finish and not delay the project • For nodes with one leaving arrow, LF for nodes entering that node equals the LS of the leaving arrow • For nodes with multiple leaving arrows, LF for arrows entering node equals the smallest of the leaving arrows
  • 34.
    Forward Pass Begin atstarting event and work forward Earliest Start Time Rule:  If an activity has only a single immediate predecessor, its ES equals the EF of the predecessor  If an activity has multiple immediate predecessors, its ES is the maximum of all the EF values of its predecessors ES = Max {EF of all immediate predecessors}
  • 35.
    Begin at startingevent and work forward Earliest Finish Time Rule:  The earliest finish time (EF) of an activity is the sum of its earliest start time (ES) and its activity time EF = ES + Activity time Forward Pass
  • 36.
    Practice problem –CPM (Forward Pass)
  • 37.
    Backward Pass Begin withthe last event and work backwards Latest Finish Time Rule:  If an activity is an immediate predecessor for just a single activity, its LF equals the LS of the activity that immediately follows it  If an activity is an immediate predecessor to more than one activity, its LF is the minimum of all LS values of all activities that immediately follow it LF = Min {LS of all immediate following activities}
  • 38.
    Begin with thelast event and work backwards Latest Start Time Rule:  The latest start time (LS) of an activity is the difference of its latest finish time (LF) and its activity time LS = LF – Activity time Backward Pass
  • 39.
    Practice problem –CPM (Backward Pass)
  • 40.
    Practice problem –CPM (Critical path)
  • 41.
    Computing Slack Time Aftercomputing the ES, EF, LS, and LF times for all activities, compute the slack or free time for each activity Slack is the length of time an activity can be delayed without delaying the entire project Slack = LS – ES or Slack = LF – EF
  • 42.
    Practice problem –CPM (Slack) 0 0 0 2 2 6 6
  • 43.
    Using Slack Times •Knowledge of slack times provides managers with information for planning allocation of scarce resources • Control efforts will be directed toward those activities that might be most susceptible to delaying the project • Activity slack times are based on the assumption that all of the activities on the same path will be started as early as possible and not exceed their expected time • If two activities are on the same path and have the same slack, this will be the total slack available to both
  • 44.
    Determining the ProjectSchedule • The critical path is the longest path through the network • The critical path is the shortest time in which the project can be completed • Any delay in critical path activities delays the project • Critical path activities have no slack time Perform a Critical Path Analysis
  • 45.
    Variability in ActivityTimes  CPM assumes we know a fixed time estimate for each activity and there is no variability in activity times  PERT uses a probability distribution for activity times to allow for variability
  • 46.
    Probabilistic Time Estimates •The beta distribution is generally used to describe the inherent variability in time estimates • The probabilistic approach involves three time estimates: • Optimistic time, (to) • The length of time required under optimal conditions • Pessimistic time, (tp) • The length of time required under the worst conditions • Most likely time, (tm) • The most probable length of time required
  • 47.
  • 48.
    Probabilistic Time Estimates •The expected time, te ,for an activity is a weighted average of the three time estimates: • The expected duration of a path is equal to the sum of the expected times of the activities on that path: 6 4 p m o e t t t t      path on the activities of times expected of Path time
  • 49.
  • 50.
  • 51.
    Example- PERT –(Critical Path) Total duration is 16 days
  • 52.
    Probabilistic Time Estimates •The standard deviation of each activity’s time is estimated as one-sixth of the difference between the pessimistic and optimistic time estimates. The variance is the square of the standard deviation: • Standard deviation of the expected time for the path   2 2 6         o p t t      path on activities of Variances path 
  • 53.
  • 54.
    Knowledge of PathStatistics • Knowledge of expected path times and their standard deviations enables managers to compute probabilistic estimates about project completion such as: • The probability that the project will be completed by a certain time • The probability that the project will take longer than its expected completion time
  • 55.
    PERT makes twomore assumptions: Total project completion times follow a normal probability distribution Activity times are statistically independent Probability of Project Completion
  • 56.
    Path Probabilities • Calculatingpath probabilities involves the use of the normal distribution • Although path activities are represented by the beta distribution, the path distribution can be represented by a normal distribution
  • 57.
  • 58.
    Project Completion Time •A project is not complete until all project activities are complete • It is risky to only consider the critical path when assessing the probability of completing a project within a specified time. • To determine the probability of completing the project within a particular time frame • Calculate the probability that each path in the project will be completed within the specified time • Multiply these probabilities • The result is the probability that the project will be completed within the specified time
  • 59.
    What's the probabilityof project completion in 17 weeks of its start? deviation standard Path mean Path - time Specified  z
  • 60.
    What's the probabilityof project completion in 17 weeks of its start?
  • 61.
  • 62.
    What's the probabilityof project completion in 15 weeks of its start?
  • 63.
    What's the probabilityof project completion in 15 weeks of its start? What's the probability of project completion Not before 15 weeks of its start?
  • 64.
    PERT: Advantages • Amongthe most useful features of PERT: 1.It forces the manager to organize and quantify available information and to identify where additional information is needed 2.It provides a graphic display of the project and its major activities 3.It identifies a.Activities that should be closely watched b.Activities that have slack time
  • 65.
    Time-Cost Trade-Offs • Activitytime estimates are made for some given level of resources • It may be possible to reduce the duration of a project by injecting additional resources • Motivations: • To avoid late penalties • Monetary incentives • Free resources for use on other projects
  • 66.
    Time-Cost Trade-Offs: Crashing •Crashing • Shortening activity durations • Typically, involves the use of additional funds to support additional personnel or more efficient equipment, and the relaxing of some work specifications • The project duration may be shortened by increasing direct expenses (labor, materials etc.), thereby realizing savings in indirect project costs (fixed cost)
  • 67.
    Crashing Decisions • Tomake decisions concerning crashing requires information about: 1. Regular time and crash time estimates for each activity 2. Regular cost and crash cost estimates for each activity 3. A list of activities that are on the critical path • Critical path activities are potential candidates for crashing • Crashing non-critical path activities would not have an impact on overall project duration
  • 68.
    Crashing: Procedure • Generalprocedure: 1. Crash the project one period at a time 2. Crash the least expensive activity that is on the critical path 3. When there are multiple critical paths, find the sum of crashing the least expensive activity on each critical path • If two or more critical paths share common activities, compare the least expensive cost of crashing a common activity shared by critical paths with the sum for the separate critical paths
  • 69.
  • 70.
    Practice problem- Crashingthe network • Costs for a project are $12,000 per week for as long as the project lasts. The project manager has supplied the cost and time information shown. • Use the information to • a. Determine an optimum crashing plan • b. Graph the total costs for the plan
  • 71.
    Practice problem- Crashingthe network S a b E c d e f 10 14 13 6 15 8
  • 72.
    Compute path lengthsand identify the critical path S a b E c d e f 10 14 13 6 15 8
  • 73.
    Rank critical activitiesaccording to crash costs Activity Cost per week to crash ($) b 3000 a 11000 S a b E c d e f 10 14 13 6 15 8 S a b E c d e f 10 13 13 6 15 8 Benefit •$12000 Cost •$3000
  • 74.
    Rank activities bycrashing costs on the two critical paths Path Activity Cost per week to crash ($) a-b b 4000 a 11000 e-f f 2000 e 6000 S a b E c d e f 10 13 13 6 15 8 S a b E c d e f 10 12 13 6 15 7 Benefit •$12000 Cost •$6000
  • 75.
    Rank activities bycrashing costs on the two critical paths Path Activity Cost per week to crash ($) a-b b 4000 a 11000 e-f f No further crashing available e 6000 S a b E c d e f 10 12 13 6 15 7 S a b E c d e f 10 11 13 6 14 7 Benefit •$12000 Cost •$10000
  • 76.
    Status of thecrashed network S a b E c d e f 10 11 13 6 14 7
  • 77.
    Rank activities bycrashing costs on the two critical paths Path Activity Cost per week to crash ($) a-b b No further crashing available a 11000 e-f f No further crashing available e 6000 S a b E c d e f 10 12 13 6 15 7 S a b E c d e f 9 11 13 6 13 7 Benefit •$12000 Cost •$17000
  • 78.
    Summary of crashingprocess Path N=0 1 2 3 a-b 24 23 22 21 c-d 19 19 19 19 e-f 23 23 22 21 Crashed Activity b b,f b,e Crashing cost 3000 6000 10000 266 269 272 275 278 281 284 287 290 19 20 21 22 23 24 25 Total costs($000) Project duration (Days)
  • 79.
    Project Classifications -Goals andMethods Matrix Type 2 Project •Product devpt. Type 4 project •Research & Devpt Type 1 Project •Engineering Type 3 Project Application Software Goals well defined Yes No Method well defined No Yes Greater Chance of failure Greater Chance of Success
  • 80.
    Problem Your company hasjust received an order from a good customer for a specially designed electric motor. The contract states that, starting on the thirteenth day from now, your firm will experience a penalty of $100 per day until the job is completed. Indirect project costs amount to $200 per day. The data on direct costs and activity precedent relationships are given in Table 2.2. a. Draw the project network diagram. b. What completion date would you recommend?
  • 81.
    Solved Problem 1 ELECTRICMOTOR PROJECT DATA Activity Normal Time (days) Normal Cost ($) Crash Time (days) Crash Cost ($) Immediate Predecessor(s) A 4 1,000 3 1,300 None B 7 1,400 4 2,000 None C 5 2,000 4 2,700 None D 6 1,200 5 1,400 A E 3 900 2 1,100 B F 11 2,500 6 3,750 C G 4 800 3 1,450 D, E H 3 300 1 500 F, G
  • 82.
    SOLUTION a. The networkdiagram is shown in Figure 2.10. Keep the following points in mind while constructing a network diagram. 1. Always have start and finish nodes. 2. Try to avoid crossing paths to keep the diagram simple. 3. Use only one arrow to directly connect any two nodes. 4. Put the activities with no predecessors at the left and point the arrows from left to right. 5. Be prepared to revise the diagram several times before you come up with a correct and uncluttered diagram. Start Finish A 4 B 7 C 5 D 6 E 3 F 11 G 4 H 3 Figure 2.10
  • 83.
    b. With theseactivity times, the project will be completed in 19 days and incur a $700 penalty. Using the data in Table 2.2, you can determine the maximum crash-time reduction and crash cost per day for each activity. For activity A Maximum crash time = Normal time – Crash time = 4 days – 3 days = 1 day Crash cost per day = = Crash cost – Normal cost Normal time – Crash time CC – NC NT – CT = = $300 $1,300 – $1,000 4 days – 3 days
  • 84.
    Activity Crash Costper Day ($) Maximum Time Reduction (days) A 300 1 B 200 3 C 700 1 D 200 1 E 200 1 F 250 5 G 650 1 H 100 2
  • 85.
    Table 2.3 summarizesthe analysis and the resultant project duration and total cost. The critical path is C–F–H at 19 days, which is the longest path in the network. The cheapest activity to crash is H which, when combined with reduced penalty costs, saves $300 per day (200–Indirect cost+100-Penalty). Crashing this activity for two days gives A–D–G–H: 15 days, B–E–G–H: 15 days, and C–F–H: 17 days Crash activity F next. This makes all activities critical and no more crashing should be done as the cost of crashing exceeds the savings.
  • 86.
    TABLE 2.3 |PROJECT COST ANALYSIS Stage Crash Activity Time Reduction (days) Resulting Critical Path(s) Project Duration (days) Project Direct Costs, Last Trial ($) Crash Cost Added ($) Total Indirect Costs ($) Total Penalty Costs ($) Total Project Costs ($) 0 — — C-F-H 19 10,100 — 3,800 700 14,600 1 H 2 C-F-H 17 10,100 200 3,400 500 14,200 2 F 2 A-D-G-H 15 10,300 500 3,000 300 14,100 B-E-G-H C-F-H