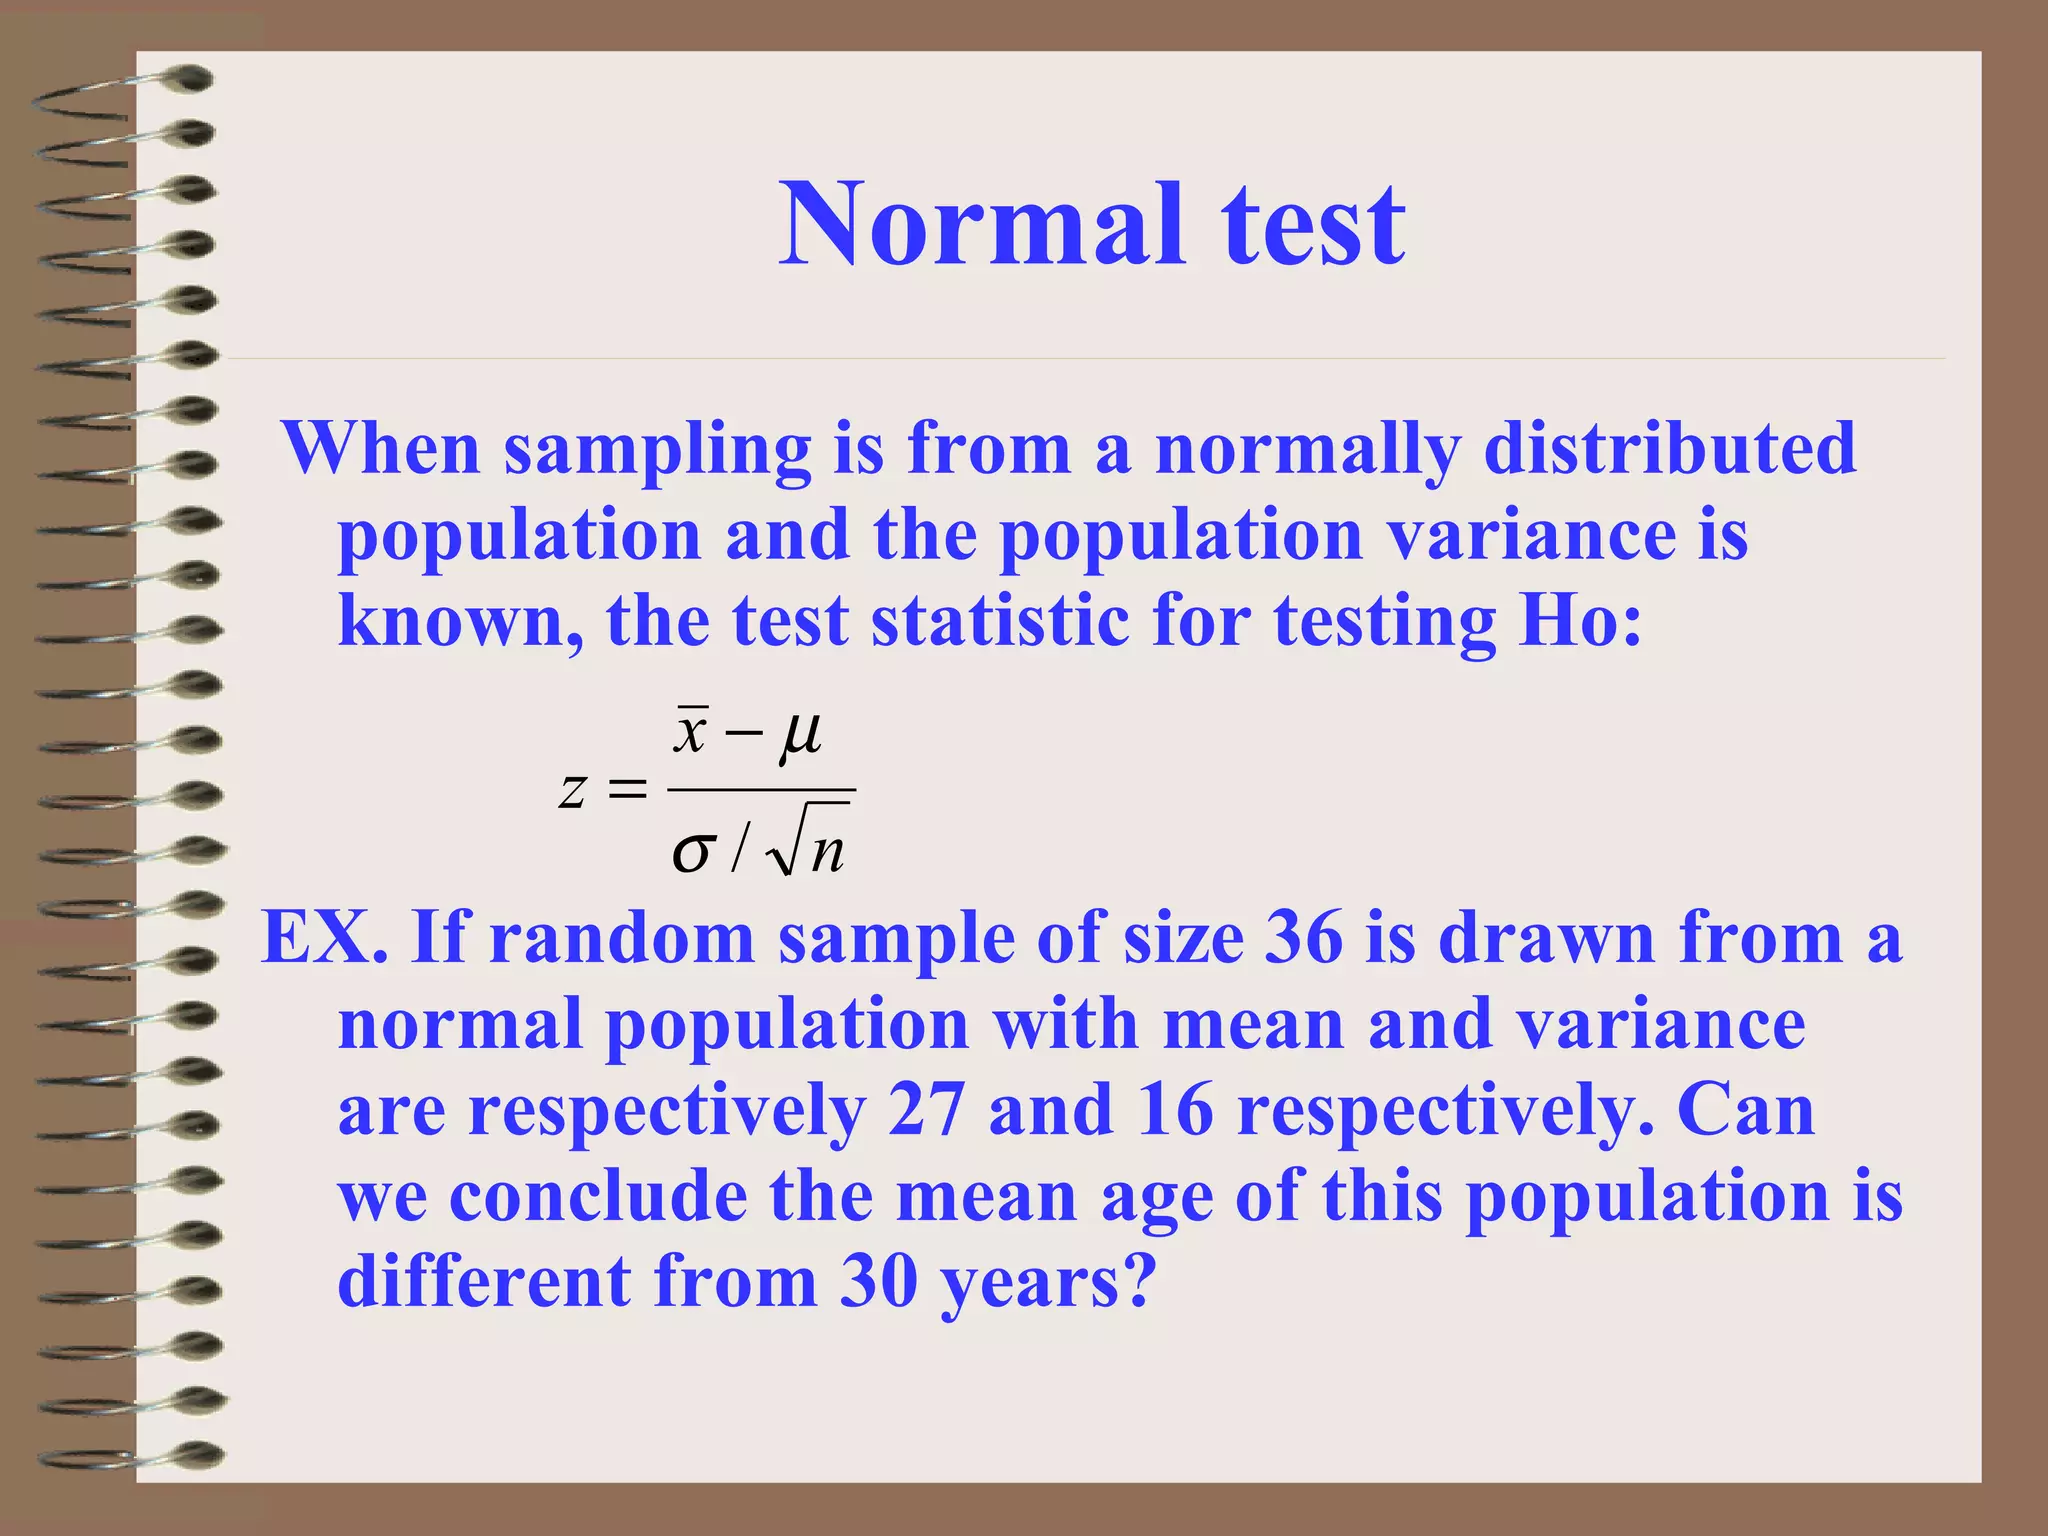
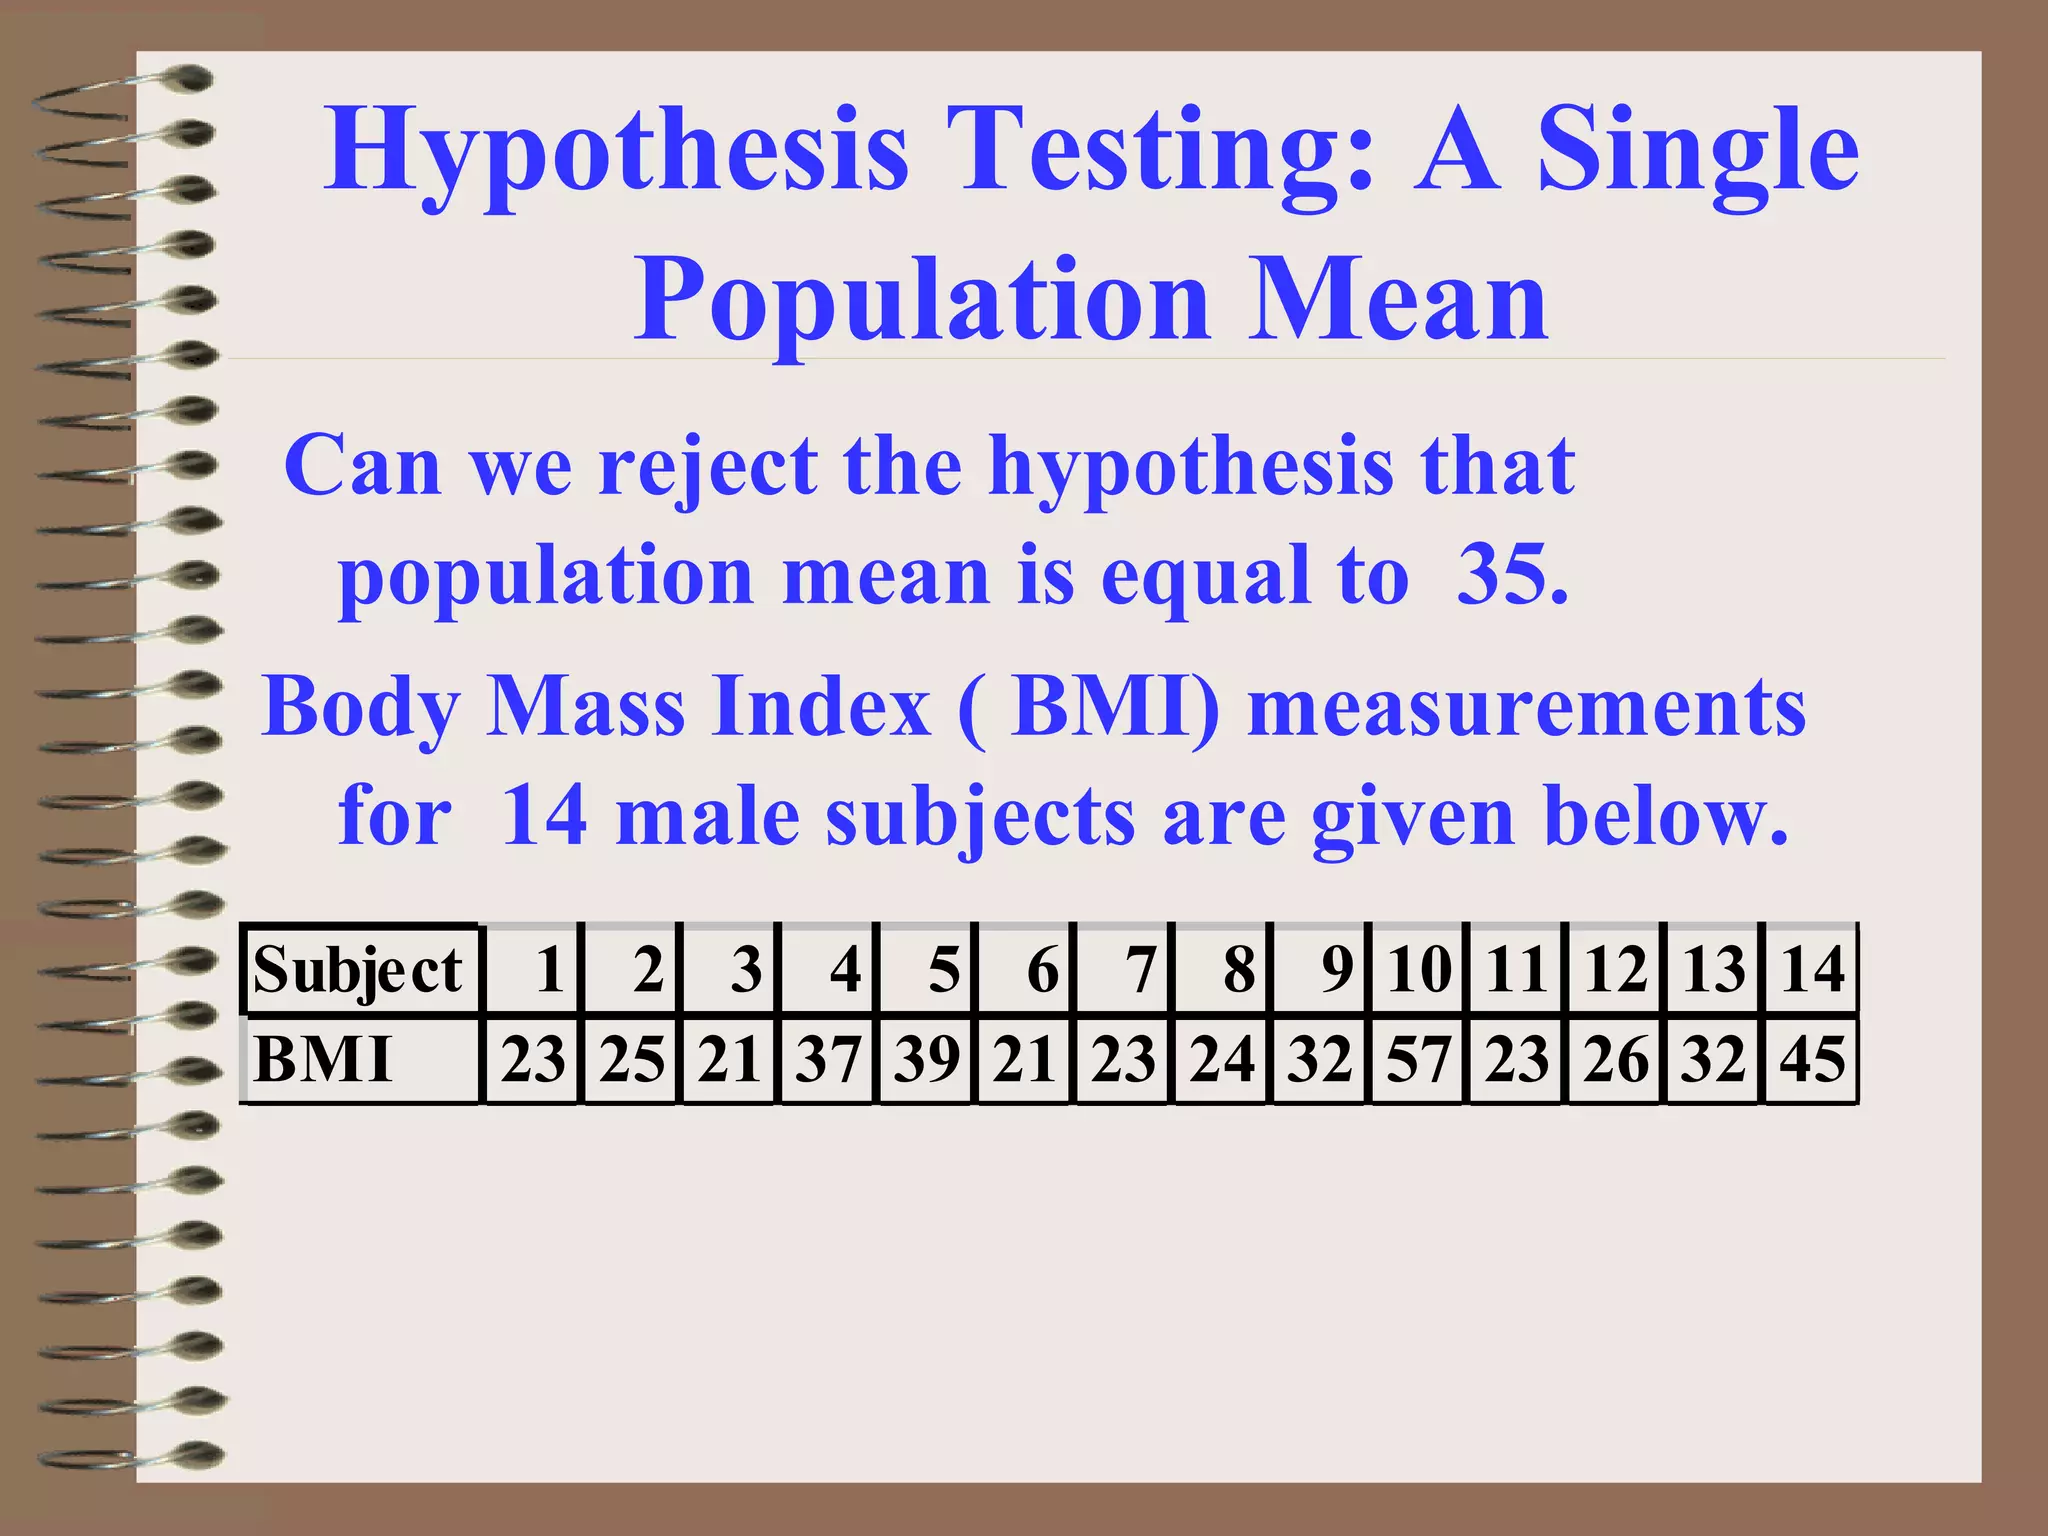
Normal & t-test
Confidence interval
Md. Saiful Islam
Dept. of Pharmaceutical Sciences
North South University
Confidence Interval
• Confidence Interval :Whenever we draw
a sample from population, we eventually
want to use the statistics to estimate
population values or population
parameters.
• There are two ways of estimating a
population parameter: a point estimate and
a confidence interval estimate.
• A point estimate of the population mean µ is
the sample mean, , computed from a random
sample of the population. A frequently used point
estimate for the population standard deviation σ
is s , the sample standard deviation.
• Confidence interval is the numbers in which
we have a specified degree of assurance that the
value of the parameter was captured. A
confidence interval allows us to estimate the
unknown parameter µ and give a margin of
error indicating how good our estimate is.
• CI for z test :95% CI of µ =
• CI for t test :95% CI of µ =
)/(
2
nzx σα±
)/(
2
nstx α±
x
Normal test
When sampling is from a normally distributed
population and the population variance is
known, the test statistic for testing Ho:
EX. If random sample of size 36 is drawn from a
normal population with mean and variance
are respectively 27 and 16 respectively. Can
we conclude the mean age of this population is
different from 30 years?
n
x
z
/σ
µ−
=
Hypothesis Testing: A Single
Population Mean
Calculation of test statistic
We have z= (27-30)/ 0.67 = - 4.5
We reject hypothesis. We conclude that
population mean is different from 30 years.
Hypothesis Testing: A Single
Population Mean
Testing Ho by means of a confidence
interval. The 95% confidence interval of
population mean is given by
Upper bound=27+ 1.31=28.31
Lower bound= 27-1.31=25.69
The age lies between 28.31 to 25.69 years
)/( nzx σα±
Hypothesis Testing: A Single
Population Mean
Sampling from a normally distributed
population: Population Variance is unknown
The test statistic for testing Ho: Population
mean= µ = µo is
Statistic is
Example: Will we be able to conclude that the
mean BMI for the population is 35 .
ns
x
t
/
µ−
=
Hypothesis Testing: A Single
Population Mean
Can we reject the hypothesis that
population mean is equal to 35.
Body Mass Index ( BMI) measurements
for 14 male subjects are given below.
Subject 1 2 3 4 5 6 7 8 9 10 11 12 13 14
BMI 23 25 21 37 39 21 23 24 32 57 23 26 32 45
Hypothesis Testing: A Single
Population Mean
Data: The data consist of BMI measurements on
14 subjects as given above.
Assumptions: The 14 subjects constitute a simple
random sample from a population of similar
subjects. We assume that BMI measurements
in this population are approximately normally
distributed.
Hypotheses: Population mean 35
Population is not equal to 35
Test statistic is with d.f is n-1,
t= (30.5-35)/2.8434
ns
x
t
/
µ−
=
ns
x
t
/
µ−
=
Hypothesis Testing: A Single
Population Mean
The calculated value of t = -1.58
With 13 degree of the value of t is –2.16
Since computed value of t is less than the table
value. We accept the hypothesis. Based on the
data the mean population from which the
sample drawn may be 35.
CI for t statistic:
Upper bound of CI=30.5+2.16*2.84=36.6.
Lower bound of CI=30.5-2.16*2.84=24.36
ns
x
t
/
µ−
=
)/( ntx σα±
Hypothesis Testing: A Single
Population Mean
Hypothesis Testing: population standard deviation is
not known
If the population standard deviation is not
known , the usual practice is to use the sample
standard deviation as an estimate. The test
statistic for testing Ho= µ = µo,
then , which when Ho is true , is
distributed approximately as the standard
normal distribution if n is large.
ns
x
t
/
µ−
=
ns
x
t
/
µ−
=
Hypothesis Testing: A Single
Population Mean
Ex. A study was conducted to describe the
menopausal status , menopausal symptoms,
energy expenditure, and aerobic fitness of
healthy midlife women and to determine the
relationship among these factors. The mean
score of maximum oxygen uptake for a sample
242 was 33.3 with a standard deviation of
12.14. The researcher wishes to know if, on the
basis of these data, one may conclude that the
mean score for a population of such women is
greater than 30
ns
x
t
/
µ−
=
Hypothesis Testing: A Single
Population Mean
Data Maximum oxygen uptake for 242
women with mean = 33.3 and s = 12.14
Assumptions: The data constitute a simple
random from a population of healthy
midlife women similar to those in the
sample.
Hypotheses Ho: µ grater than equal to 30
Ha: µ is greater than 30
ns
x
t
/
µ−
=
Hypothesis Testing: A Single
Population Mean
Given the above test statistic
We have z= ( 33.3-30)/0.7804= 3.3/0.7804
= 4.23
We reject the hypothesis since computed
value is greater than table value. We
conclude that the mean score for the
sampled population is greater than 30.
ns
x
t
/
µ−
=

Normal & t-test_confidence interval

  • 1.
    Normal & t-test Confidenceinterval Md. Saiful Islam Dept. of Pharmaceutical Sciences North South University
  • 2.
    Confidence Interval • ConfidenceInterval :Whenever we draw a sample from population, we eventually want to use the statistics to estimate population values or population parameters. • There are two ways of estimating a population parameter: a point estimate and a confidence interval estimate.
  • 3.
    • A pointestimate of the population mean µ is the sample mean, , computed from a random sample of the population. A frequently used point estimate for the population standard deviation σ is s , the sample standard deviation. • Confidence interval is the numbers in which we have a specified degree of assurance that the value of the parameter was captured. A confidence interval allows us to estimate the unknown parameter µ and give a margin of error indicating how good our estimate is. • CI for z test :95% CI of µ = • CI for t test :95% CI of µ = )/( 2 nzx σα± )/( 2 nstx α± x
  • 4.
    Normal test When samplingis from a normally distributed population and the population variance is known, the test statistic for testing Ho: EX. If random sample of size 36 is drawn from a normal population with mean and variance are respectively 27 and 16 respectively. Can we conclude the mean age of this population is different from 30 years? n x z /σ µ− =
  • 5.
    Hypothesis Testing: ASingle Population Mean Calculation of test statistic We have z= (27-30)/ 0.67 = - 4.5 We reject hypothesis. We conclude that population mean is different from 30 years.
  • 6.
    Hypothesis Testing: ASingle Population Mean Testing Ho by means of a confidence interval. The 95% confidence interval of population mean is given by Upper bound=27+ 1.31=28.31 Lower bound= 27-1.31=25.69 The age lies between 28.31 to 25.69 years )/( nzx σα±
  • 7.
    Hypothesis Testing: ASingle Population Mean Sampling from a normally distributed population: Population Variance is unknown The test statistic for testing Ho: Population mean= µ = µo is Statistic is Example: Will we be able to conclude that the mean BMI for the population is 35 . ns x t / µ− =
  • 8.
    Hypothesis Testing: ASingle Population Mean Can we reject the hypothesis that population mean is equal to 35. Body Mass Index ( BMI) measurements for 14 male subjects are given below. Subject 1 2 3 4 5 6 7 8 9 10 11 12 13 14 BMI 23 25 21 37 39 21 23 24 32 57 23 26 32 45
  • 9.
    Hypothesis Testing: ASingle Population Mean Data: The data consist of BMI measurements on 14 subjects as given above. Assumptions: The 14 subjects constitute a simple random sample from a population of similar subjects. We assume that BMI measurements in this population are approximately normally distributed. Hypotheses: Population mean 35 Population is not equal to 35 Test statistic is with d.f is n-1, t= (30.5-35)/2.8434 ns x t / µ− = ns x t / µ− =
  • 10.
    Hypothesis Testing: ASingle Population Mean The calculated value of t = -1.58 With 13 degree of the value of t is –2.16 Since computed value of t is less than the table value. We accept the hypothesis. Based on the data the mean population from which the sample drawn may be 35. CI for t statistic: Upper bound of CI=30.5+2.16*2.84=36.6. Lower bound of CI=30.5-2.16*2.84=24.36 ns x t / µ− = )/( ntx σα±
  • 11.
    Hypothesis Testing: ASingle Population Mean Hypothesis Testing: population standard deviation is not known If the population standard deviation is not known , the usual practice is to use the sample standard deviation as an estimate. The test statistic for testing Ho= µ = µo, then , which when Ho is true , is distributed approximately as the standard normal distribution if n is large. ns x t / µ− = ns x t / µ− =
  • 12.
    Hypothesis Testing: ASingle Population Mean Ex. A study was conducted to describe the menopausal status , menopausal symptoms, energy expenditure, and aerobic fitness of healthy midlife women and to determine the relationship among these factors. The mean score of maximum oxygen uptake for a sample 242 was 33.3 with a standard deviation of 12.14. The researcher wishes to know if, on the basis of these data, one may conclude that the mean score for a population of such women is greater than 30 ns x t / µ− =
  • 13.
    Hypothesis Testing: ASingle Population Mean Data Maximum oxygen uptake for 242 women with mean = 33.3 and s = 12.14 Assumptions: The data constitute a simple random from a population of healthy midlife women similar to those in the sample. Hypotheses Ho: µ grater than equal to 30 Ha: µ is greater than 30 ns x t / µ− =
  • 14.
    Hypothesis Testing: ASingle Population Mean Data Maximum oxygen uptake for 242 women with mean = 33.3 and s = 12.14 Assumptions: The data constitute a simple random from a population of healthy midlife women similar to those in the sample. Hypotheses Ho: µ grater than equal to 30 Ha: µ is greater than 30 ns x t / µ− =
  • 15.
    Hypothesis Testing: ASingle Population Mean Given the above test statistic We have z= ( 33.3-30)/0.7804= 3.3/0.7804 = 4.23 We reject the hypothesis since computed value is greater than table value. We conclude that the mean score for the sampled population is greater than 30. ns x t / µ− =