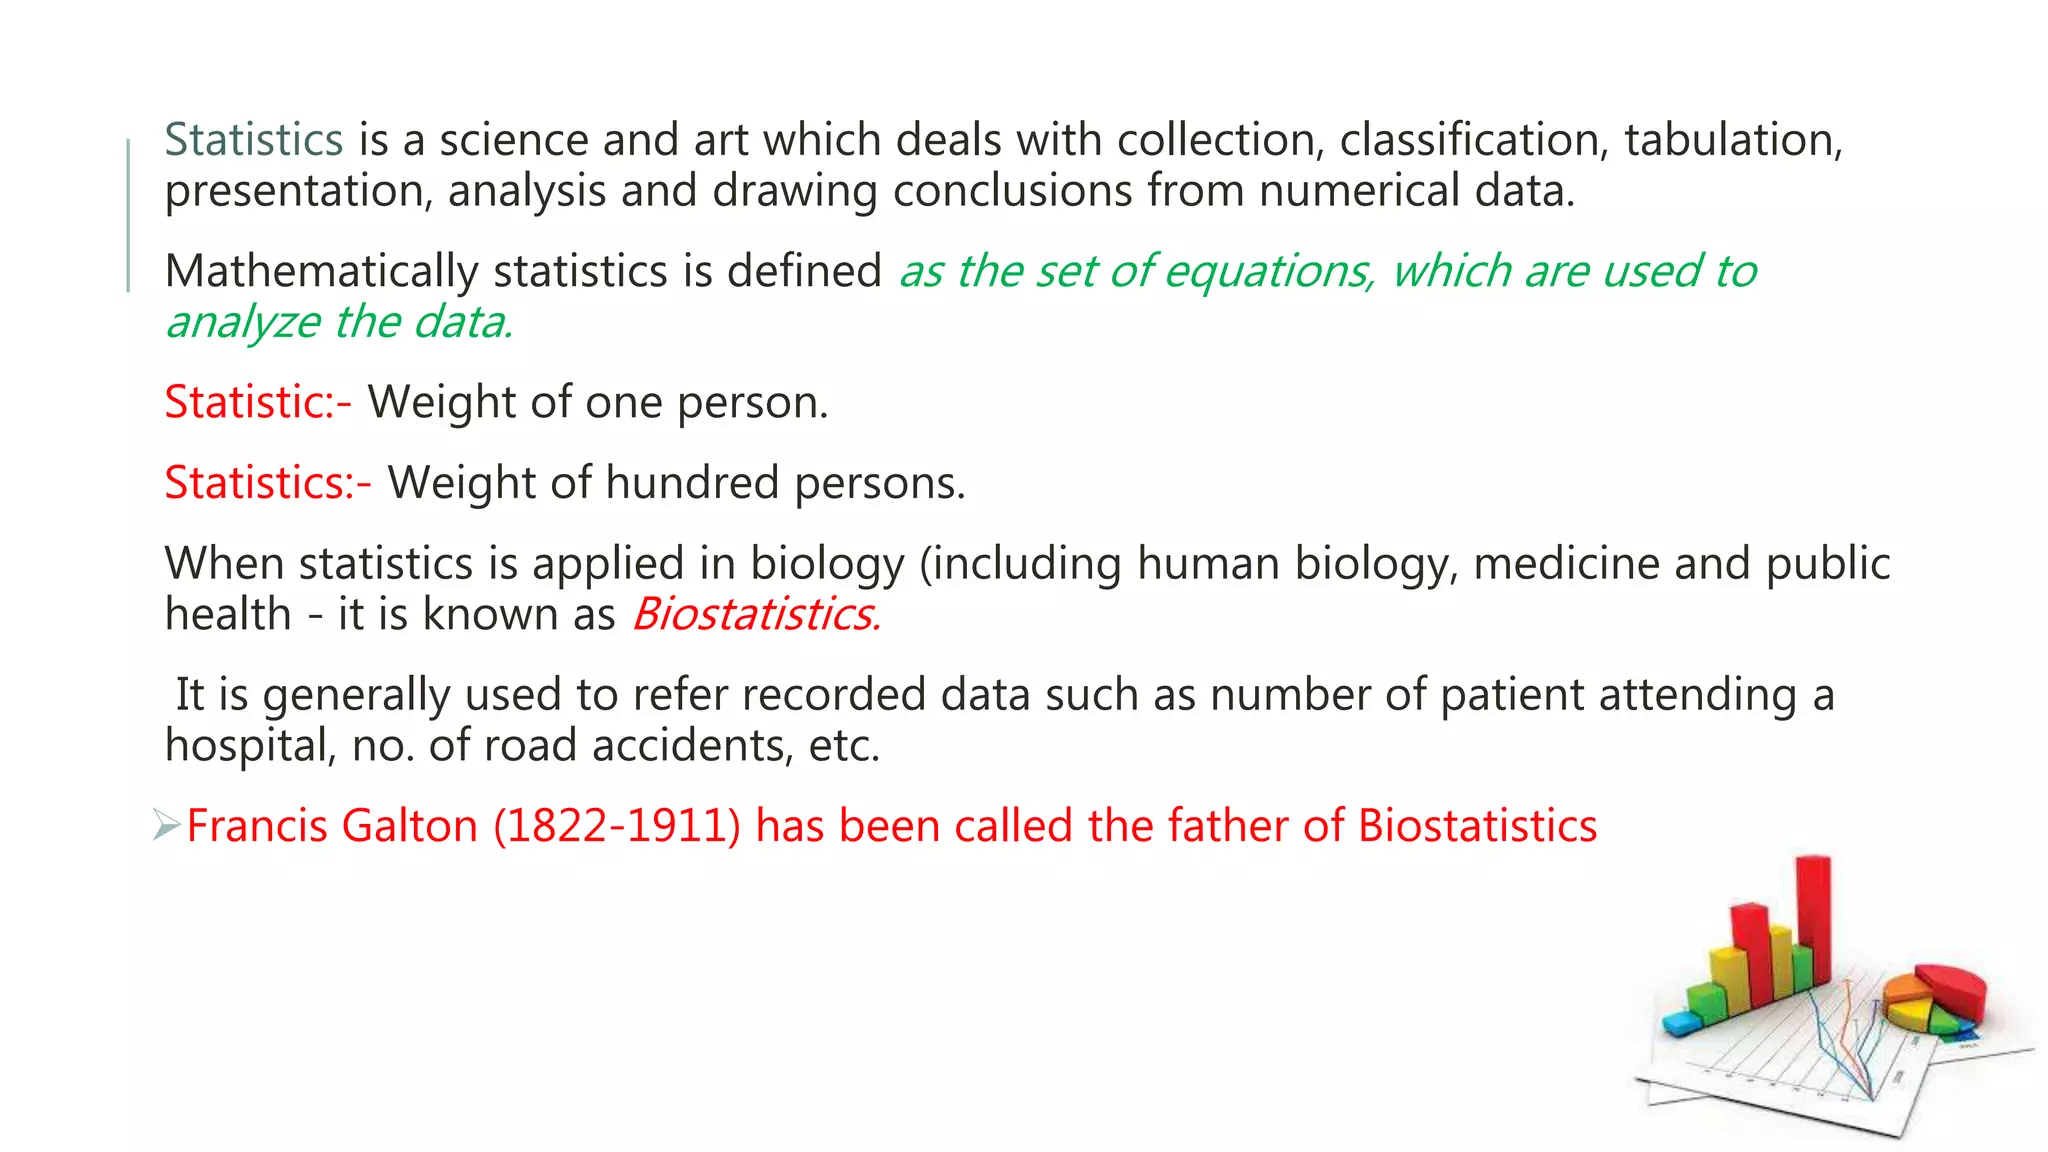
2. Statistics is a science and art which deals with collection, classification, tabulation,
presentation, analysis and drawing conclusions from numerical data.
Mathematically statistics is defined as the set of equations, which are used to
analyze the data.
Statistic:- Weight of one person.
Statistics:- Weight of hundred persons.
When statistics is applied in biology (including human biology, medicine and public
health - it is known as Biostatistics.
It is generally used to refer recorded data such as number of patient attending a
hospital, no. of road accidents, etc.
Francis Galton (1822-1911) has been called the father of Biostatistics
3. Based on its applications in different fields it is classified as:
1. Medical Statistics: deals with application of statistical methods to the study of
disease, efficacy of vaccine etc.
2. Health Statistics:- Health Statistics deals with application of statistical methods
to varied information of public health importance.
3. Vital Statistics:- Vital statistics is the ongoing collection by government agencies
of data relating to vital event such as births, deaths, marriage, divorces, which
are deemed reportable by local health authorities.
4. They are also classified as:
Descriptive statistics :Numbers that are used to summarize and describe data
Inductive or inferential statistics: Produce statistical interferences about population
based on information from a sample derived from the population.
5. IMPORTANCE OF STATISTICS
Essential for people into research management or graduate study in a specialized area.
Persons active in research will find that a basic statistics is useful in conducting clinical
studies and field surveys.
Also effective presentation of their finding in report in journals, and at professional
meeting.
Statistical tools are applied in all industry for planning, production, administration, growth
and development.
In medical sciences, statistical tools are necessary to collect facts relating to use of various
medicines in controlling diseases and analyses of data. It is also used in clinical and pre –
clinical studies of new drugs.
Statistical data and statistical methods are commonly used in social sciences.
7. Biostatistics is a branch of statistics applied to biological or medical sciences.
It covers not only health, medicines but also from filed such as genetics, biology, drug
discovery, epidemiology and many others.
It consists of
1. Generation of hypothesis
2. Collection of data
3. Application of statistical analysis.
Statistical tools comprises a set of principles and methods for generating and using quantitative
evidence to address scientific questions.
Biostatistics represent a key element of successful translational processes that often generate an
abundance of data on in-vitro tests, animal and clinical biomarkers and clinical endpoints.
8. FREQUENCY DISTRIBUTION
A frequency distribution is a representation, either in a graphical or tabular format,
that displays the number of observations within a given interval.
The interval size depends on the data being analyzed and the goals of the analyst.
Frequency distribution provides a visual representation for the distribution of
observations within a particular test.
9. KEYPOINTS
Frequency distribution in statistics is a representation that displays the
number of observations within a given interval.
The representation of a frequency distribution can be graphical or tabular so
that it is easier to understand.
Frequency distributions are particularly useful for normal distributions, which
show the observations of probabilities divided among standard deviations.
In finance, traders use frequency distributions to take note of price action
and identify trends.
10. NOTE:
Class size: Size of the class.
Difference or total no.of values that fit into it. (upper limit – lower limit)
Total frequency: Add on of all the values.
Mid value: That is to control.
Centre point of the given data.
Upper limit + lower limit/2.
Cumulative Frequency Distribution: It is a form of frequency distribution
that represents the sum of a class and all classes below it. Remember
that frequency distribution is an overview of all distinct values (or classes
of values) and their respective number of occurrences.
11. CUMULATIVE FREQUENCY
DISTRIBUTION
Consider the following example. As a financial analyst in an e-commerce
company, you want to understand how frequently customers purchase your
products that are priced up to $500.
Your problem can be solved using the cumulative frequency table. The table can
be easily built by following the steps below:
Find the individual frequencies for each distinct value or category.
Arrange the obtained data in ascending order.
12. The cumulative frequency of a distinct category (in our example, a price range) is calculated by
finding the sum of a category’s frequency and the total frequencies of all categories below it. Note
that the cumulative frequency of the first category equals the category’s individual frequency.
Let’s find the cumulative frequencies for a few categories in our example:
Cumulative Frequency ($0-$50) = 800
Cumulative Frequency ($50-$100) = 800 + 1200 = 2000
Cumulative Frequency ($100-$500) = 800 + 1200 + 700 = 2700
13. Using this table we can easily identify that customers 2,700 times purchased
products with prices up to $500.
14. CUMULATIVE RELATIVE FREQUENCY DISTRIBUTION
The cumulative relative frequency distribution of a quantitative
variable is a summary of frequency proportion below a given level.
The relationship between cumulative frequency and relative
cumulative frequency is:
15. Example:
Jane is fond of playing games with dice.
She throws the dice and notes the observations each time.
These are her observations:
4, 6, 1, 2, 2, 5, 6, 6, 5, 4, 2, 3
To know the exact number of times she got each digit (1, 2, 3, 4, 5, 6) as
the outcome, she classifies them into categories.
An easy way is to use tally marks.
Note that a diagonal line across 4 vertical lines counts as 5
17. The table is known as a frequency distribution table.
We can observe that all the data that was gathered has been organized under two
columns.
Thus, a frequency distribution table is a chart summarizing the values and their
frequencies.
In other words, it is a tool to organize data.
This makes it easy for us to understand the given set of information.
Thus, frequency distribution in statistics helps us condense data in a simpler form
so that it is easy for us to observe its features at a glance.
18. Example 2:
The height of 50 paracetamol tablets are between 480-520 mg.
The frequency distribution table shows measurement categories and the number of
observations in each category.
The range divided into intervals called “class interval”
The width of the class is determined by dividing the range of observations by the
number of classes.
Frequency distribution table gives the cumulative and relative frequency that helps
to interpret the data more easily.
19. FREQUENCY DISTRIBUTION OF
WEIGHT OF 50 TABLETS
Weight of tablet
(mg)
Frequency Cumulative
frequency
Relative cumulative
frequency
percentage
480-484 5 5 10
485-489 5 10 20
490-494 7 17 34
495-499 9 26 52
500-504 8 34 68
505-509 6 40 80
510-514 5 45 90
515- 519 5 50 100
20. 5
5
7
9
8
6
5
5
5
10
17
26
34
40
45
50
10
20
34
52
68
80
90
100
0 20 40 60 80 100 120 140 160 180
480-
484
485-
489
490-
494
495-
499
500-
504
505-
509
510-
514
515-
519
frequency cumulative frequency relative cumulative frequency (%)
Histogram chart generally shows a normal distribution, which means that the majority of
occurrences fall in the middle columns.