Download as PDF, PPTX


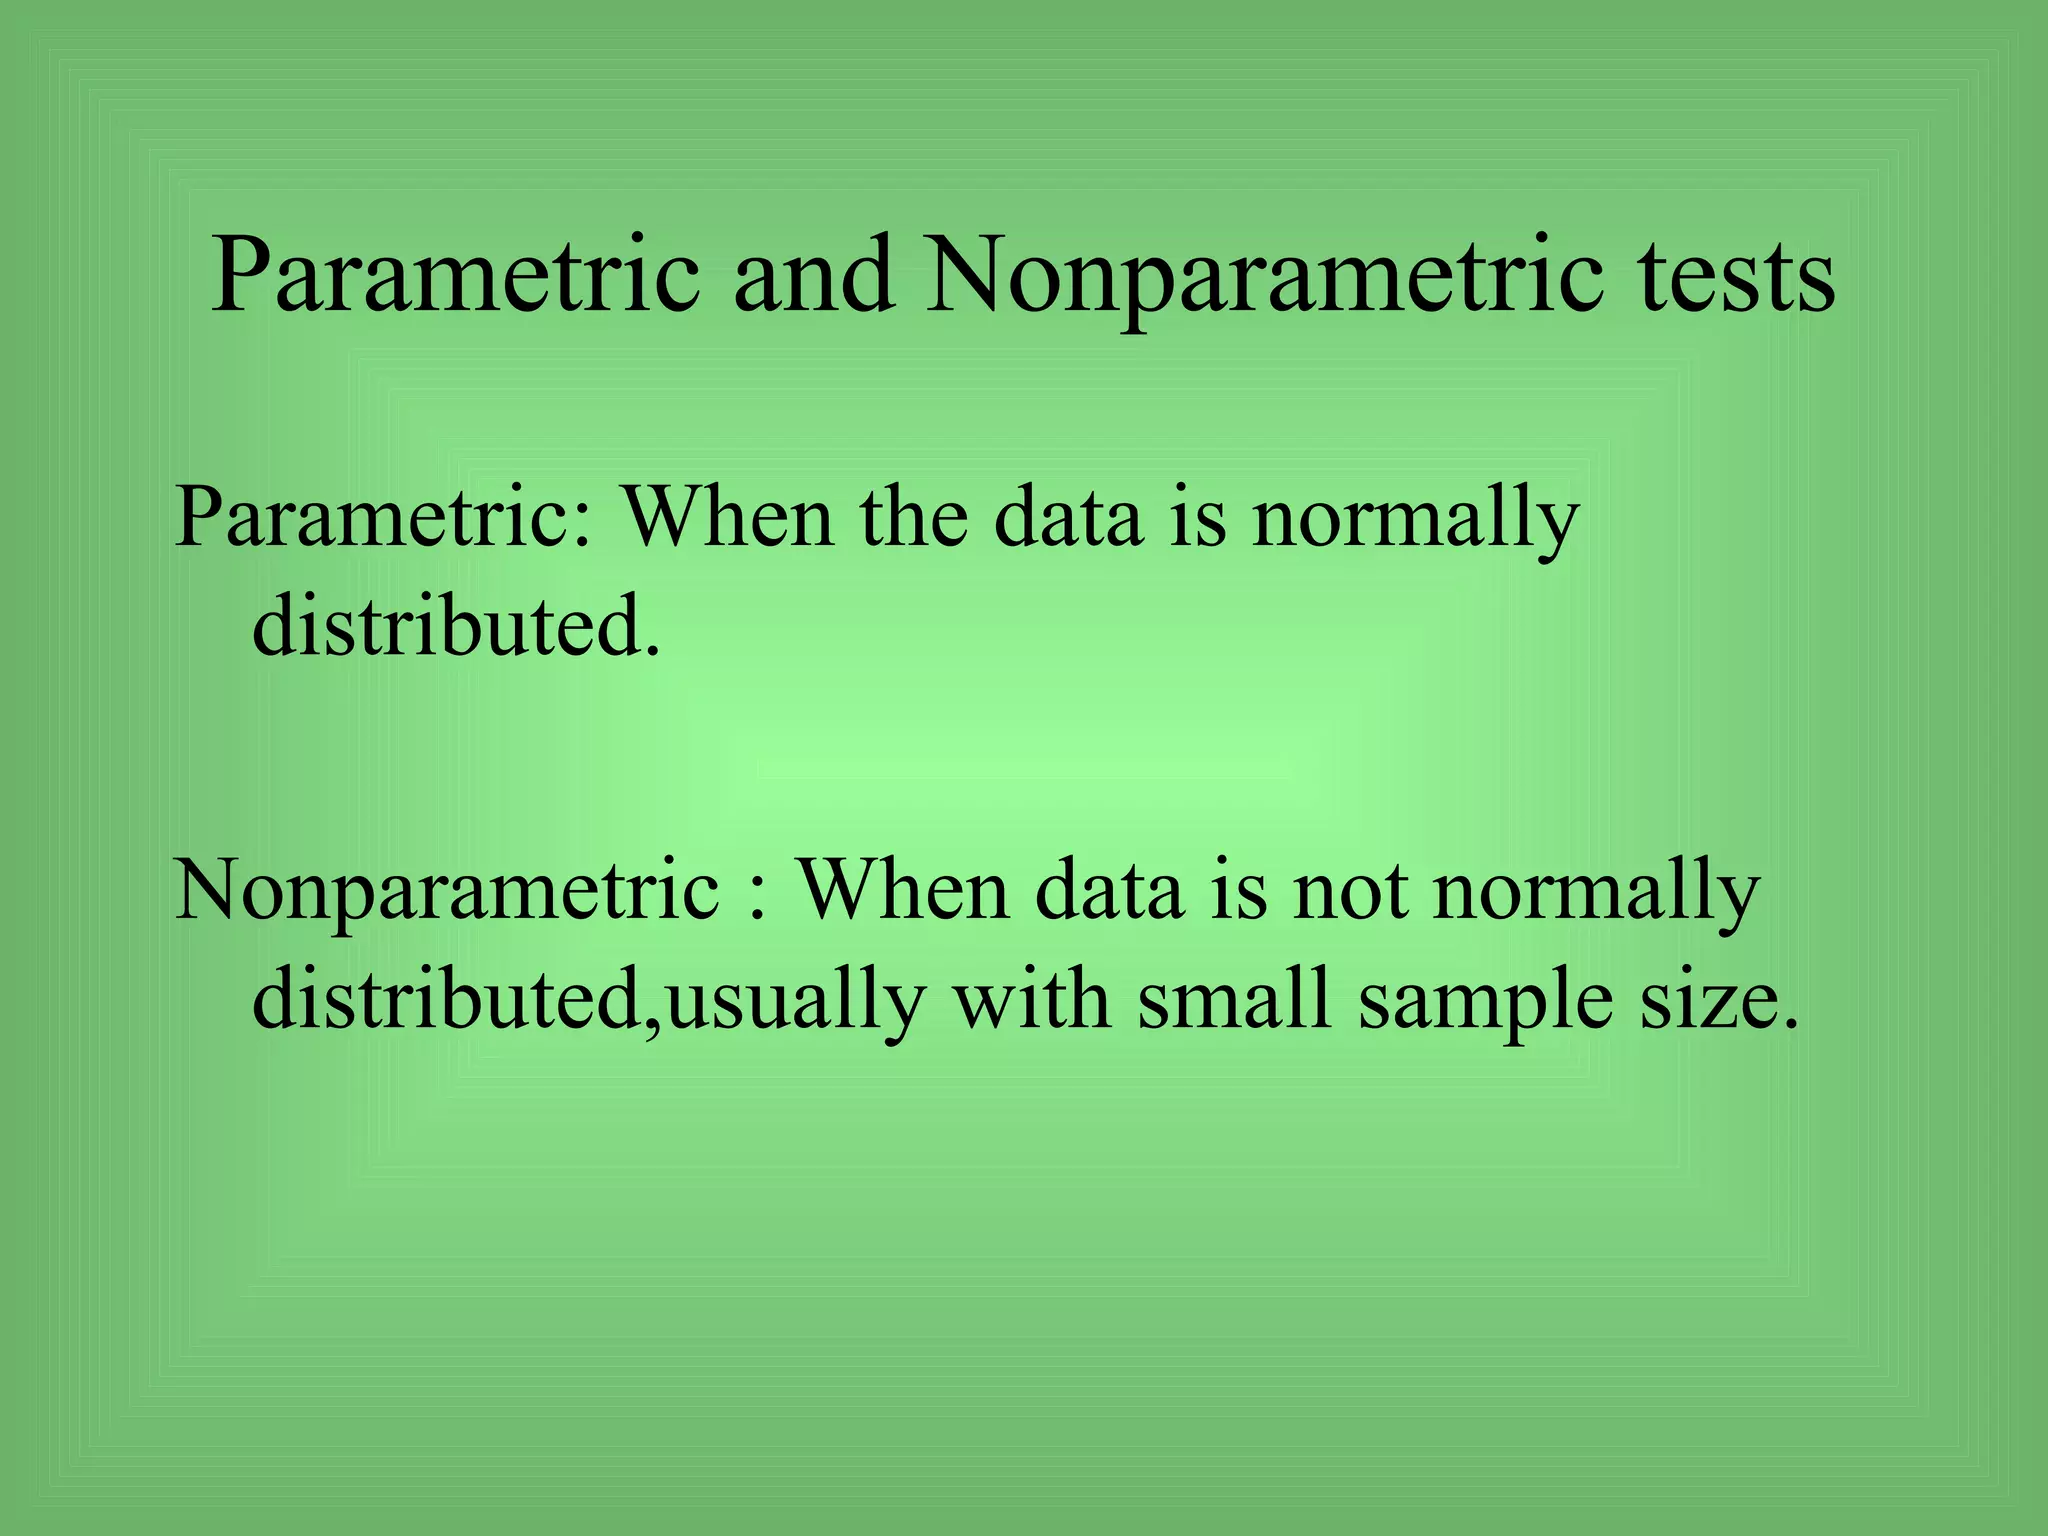
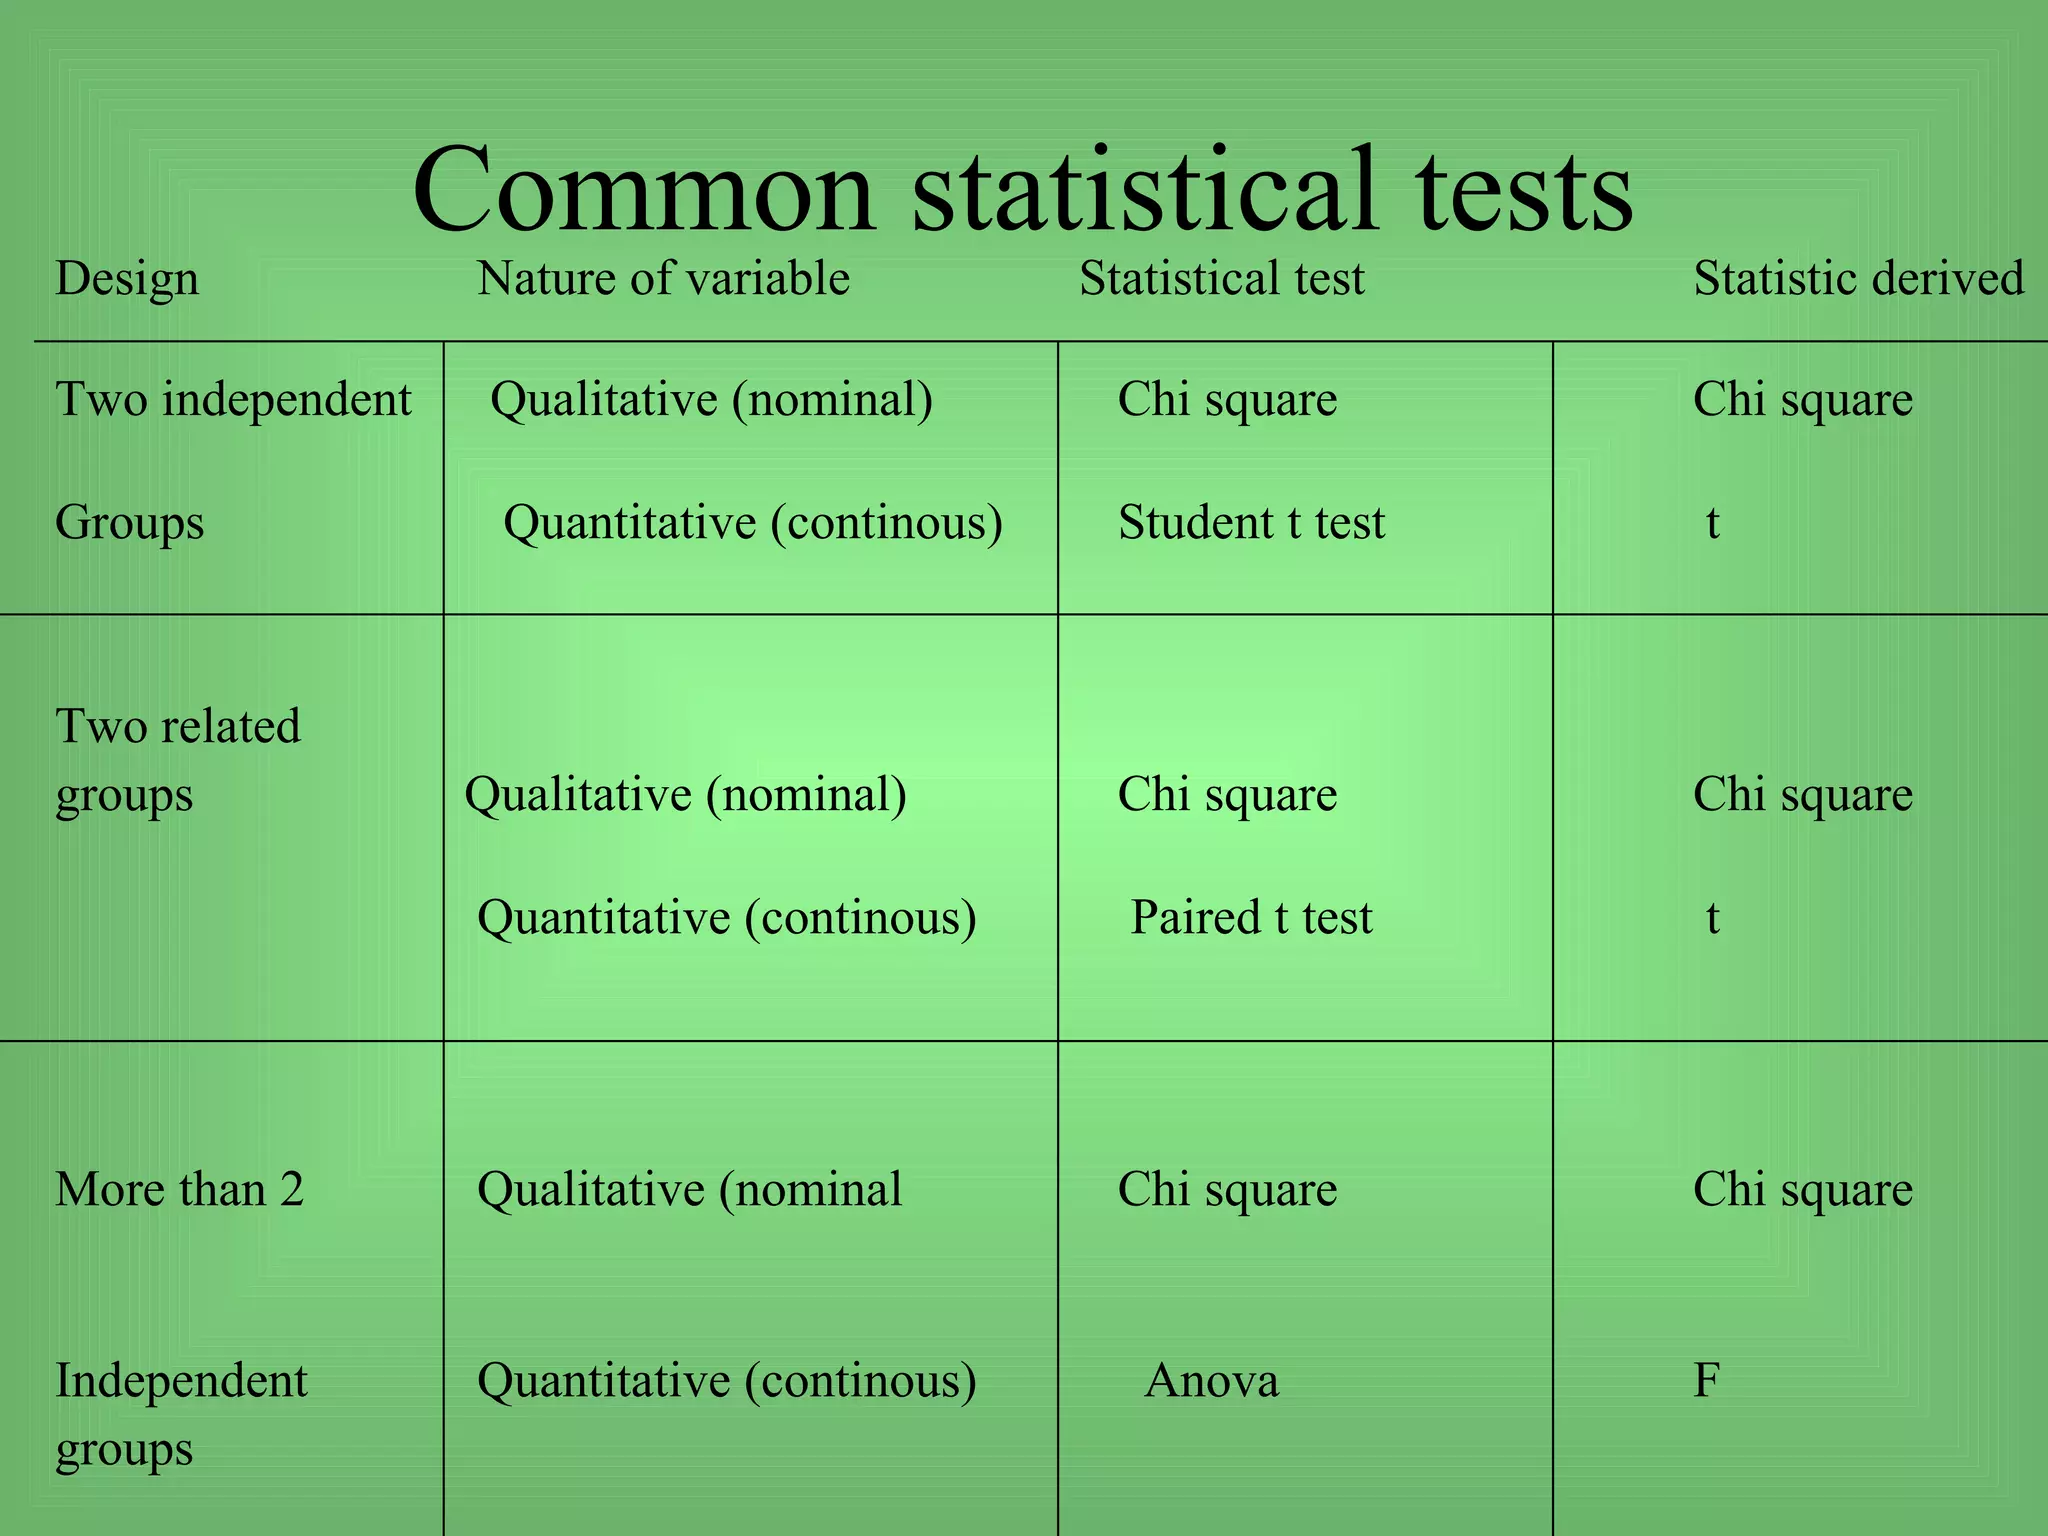
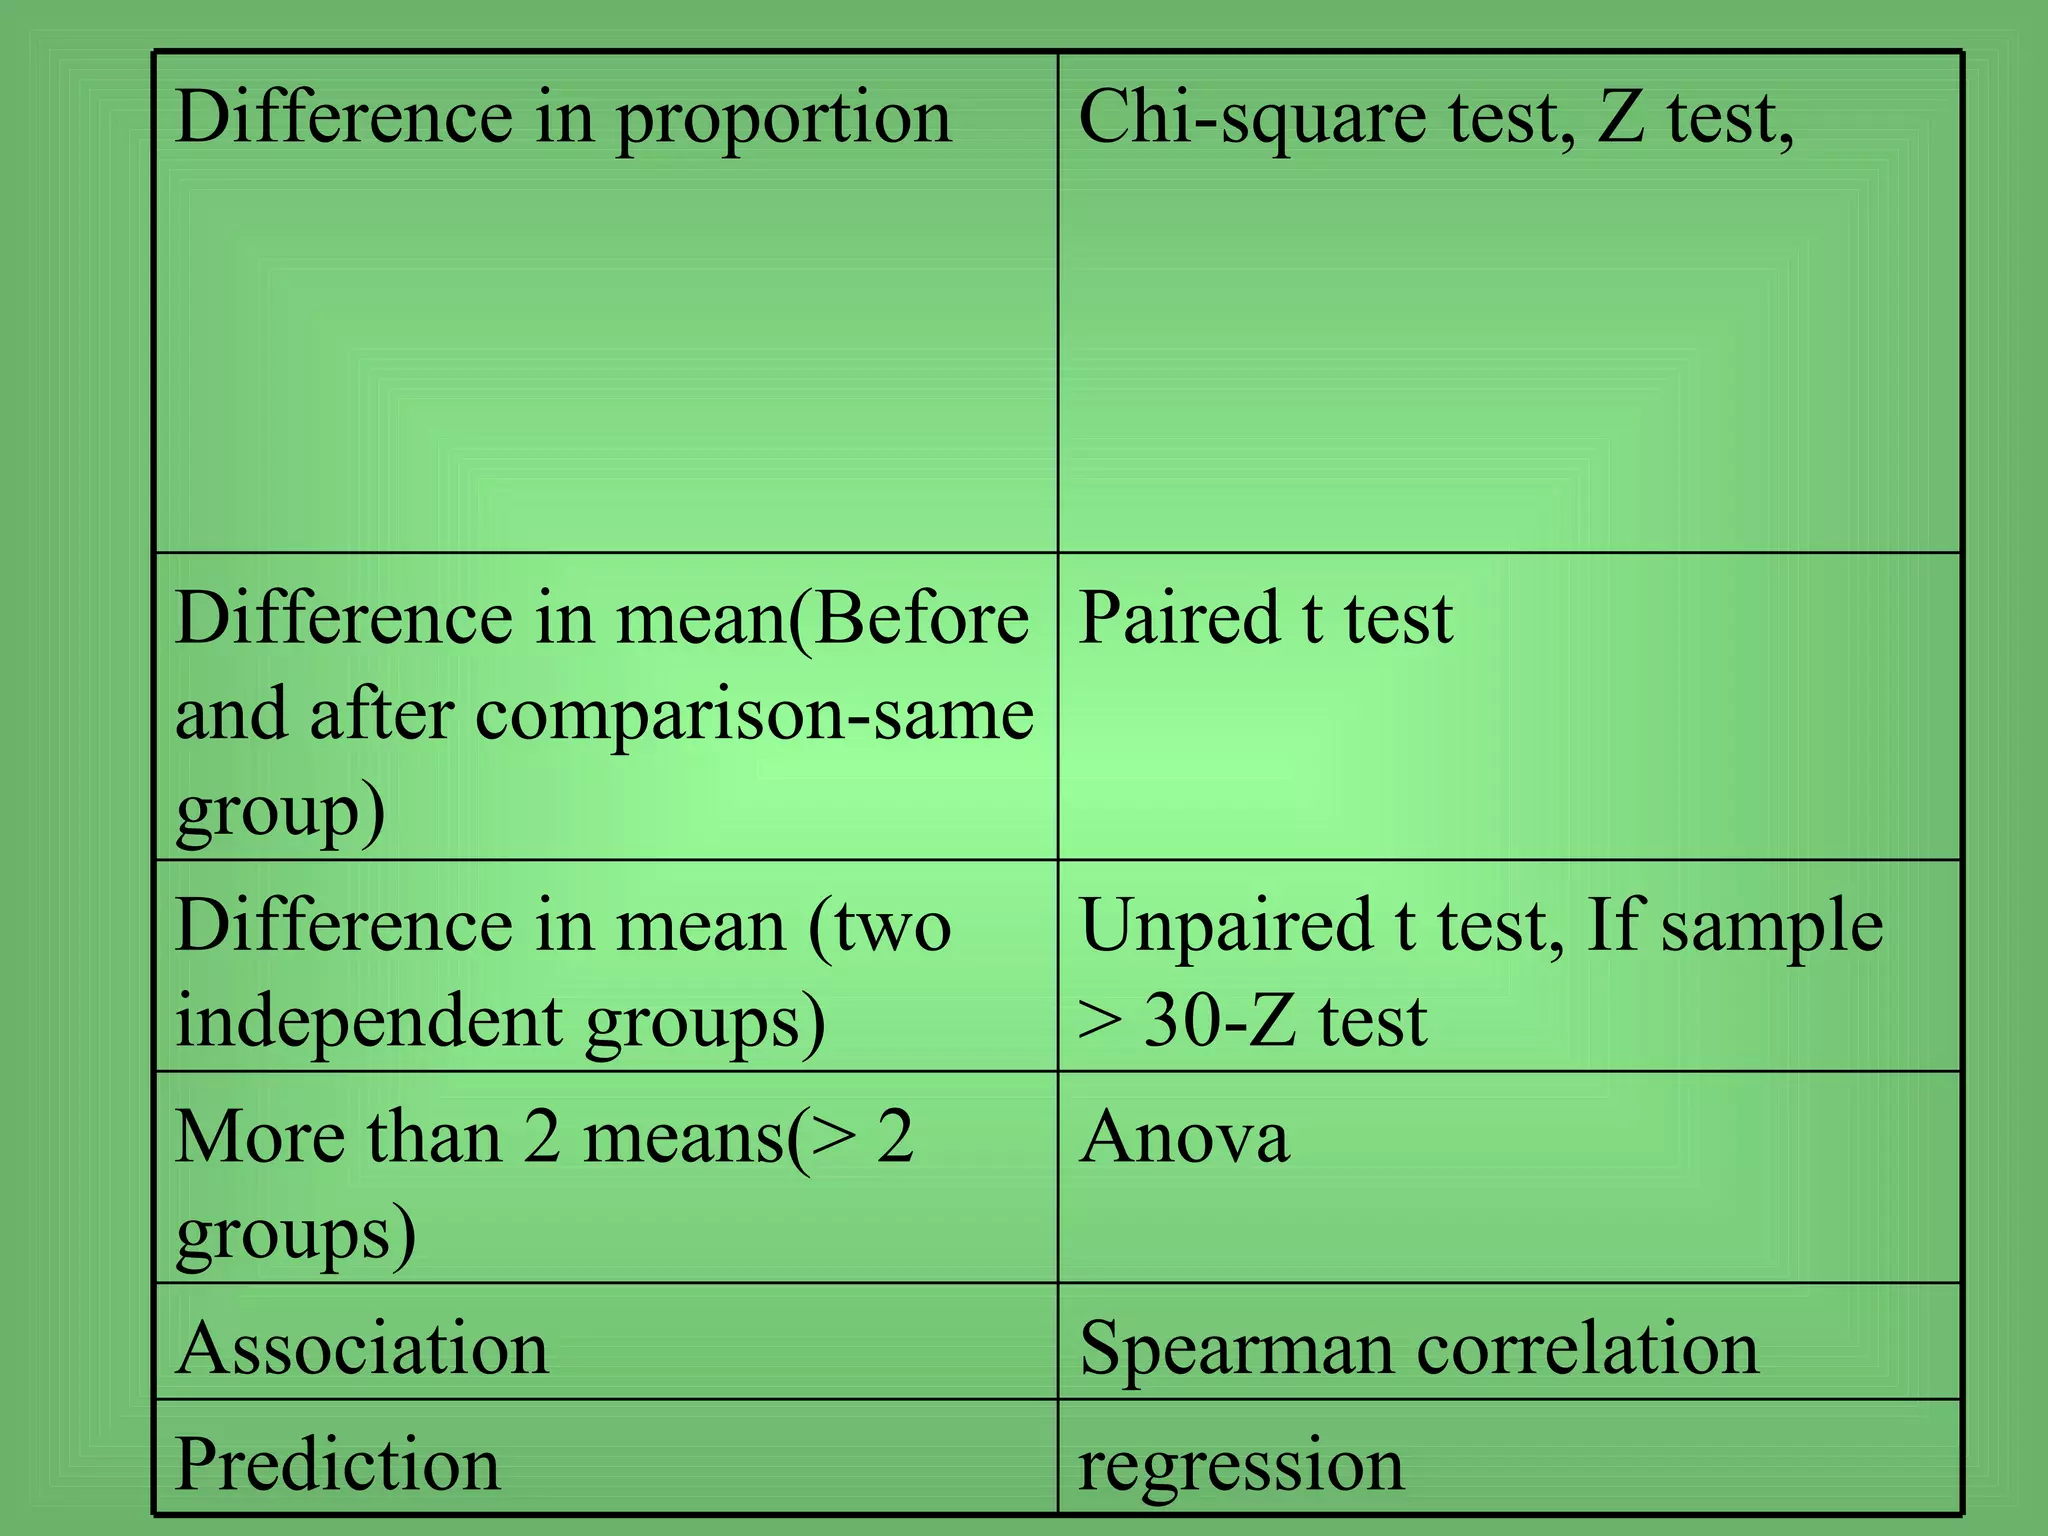

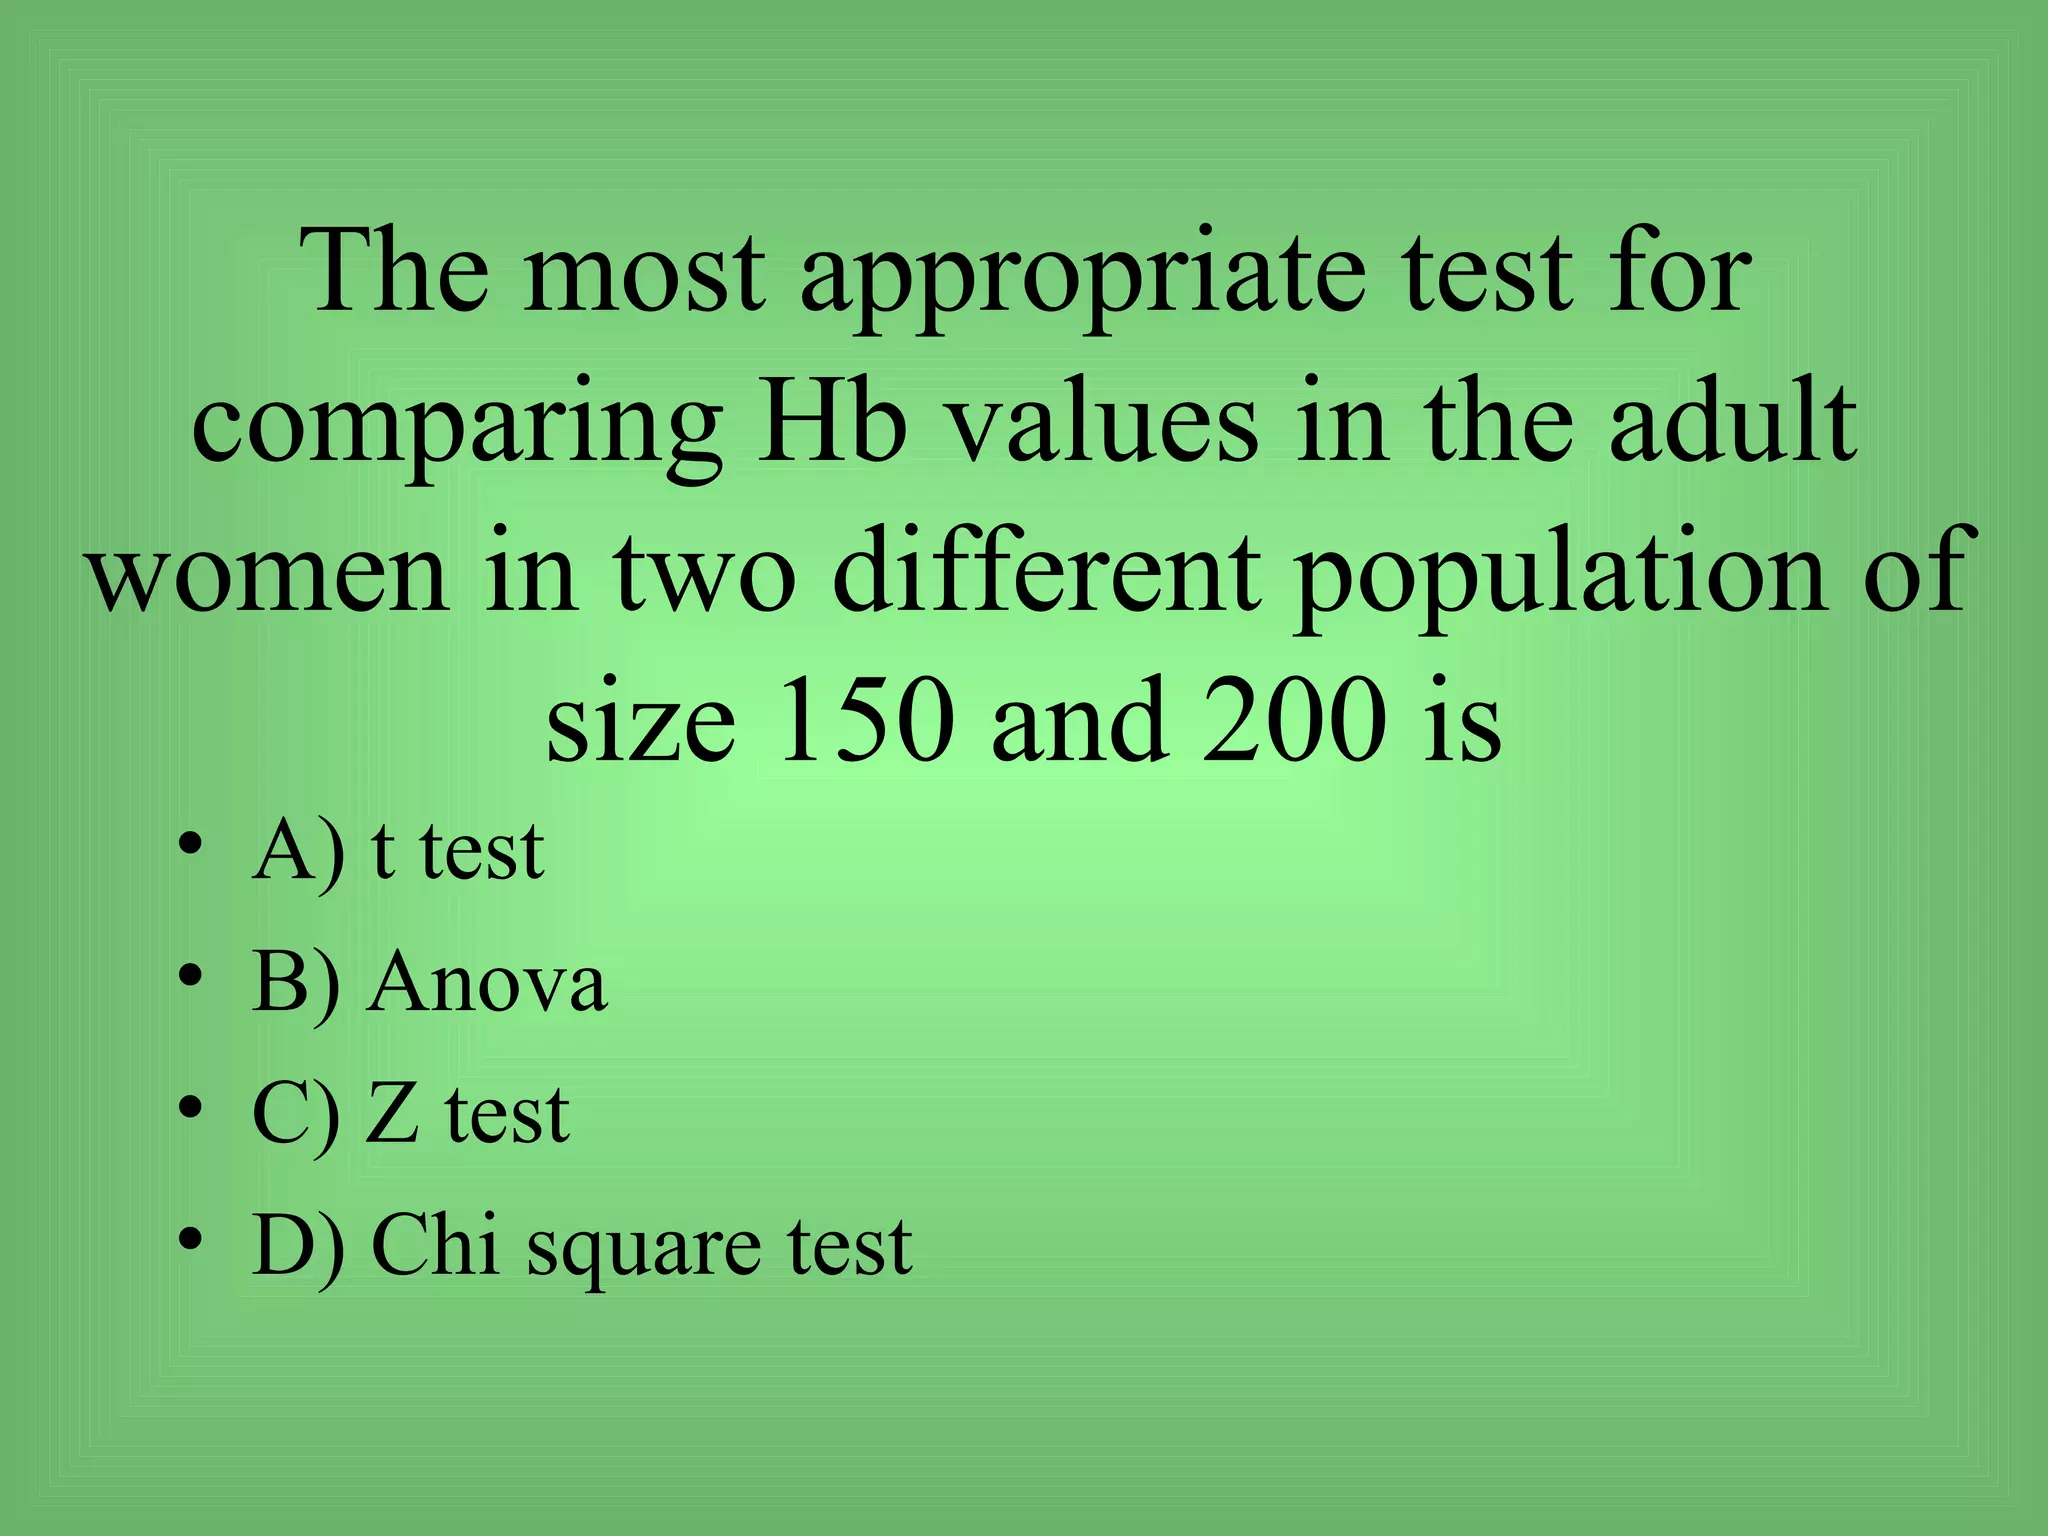


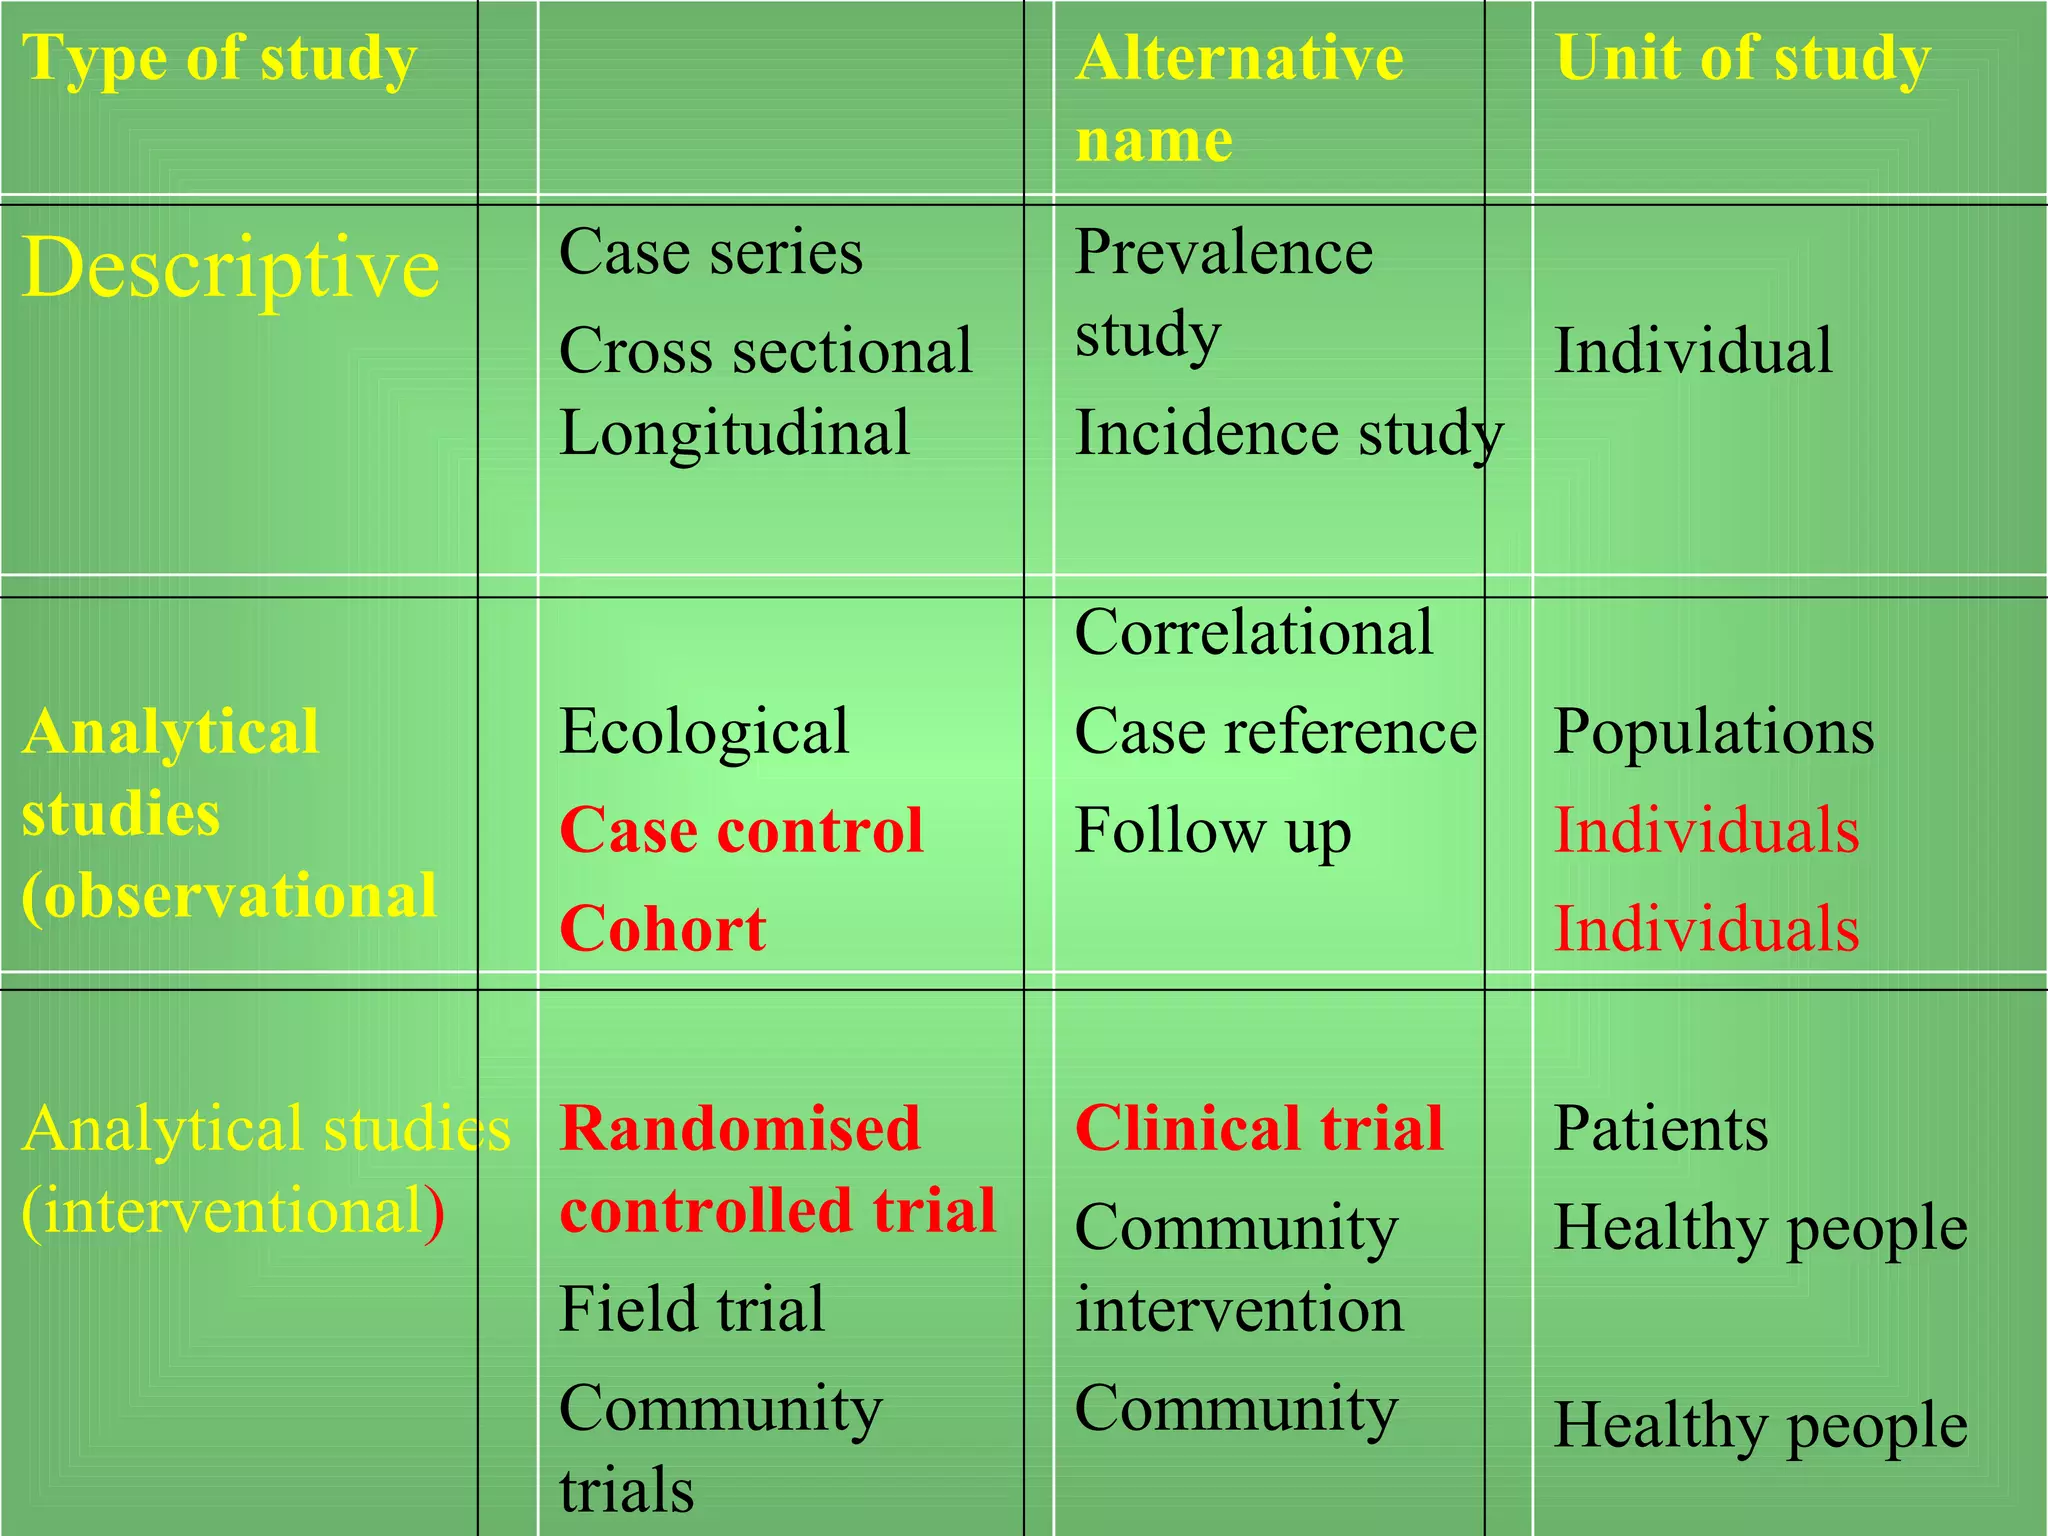
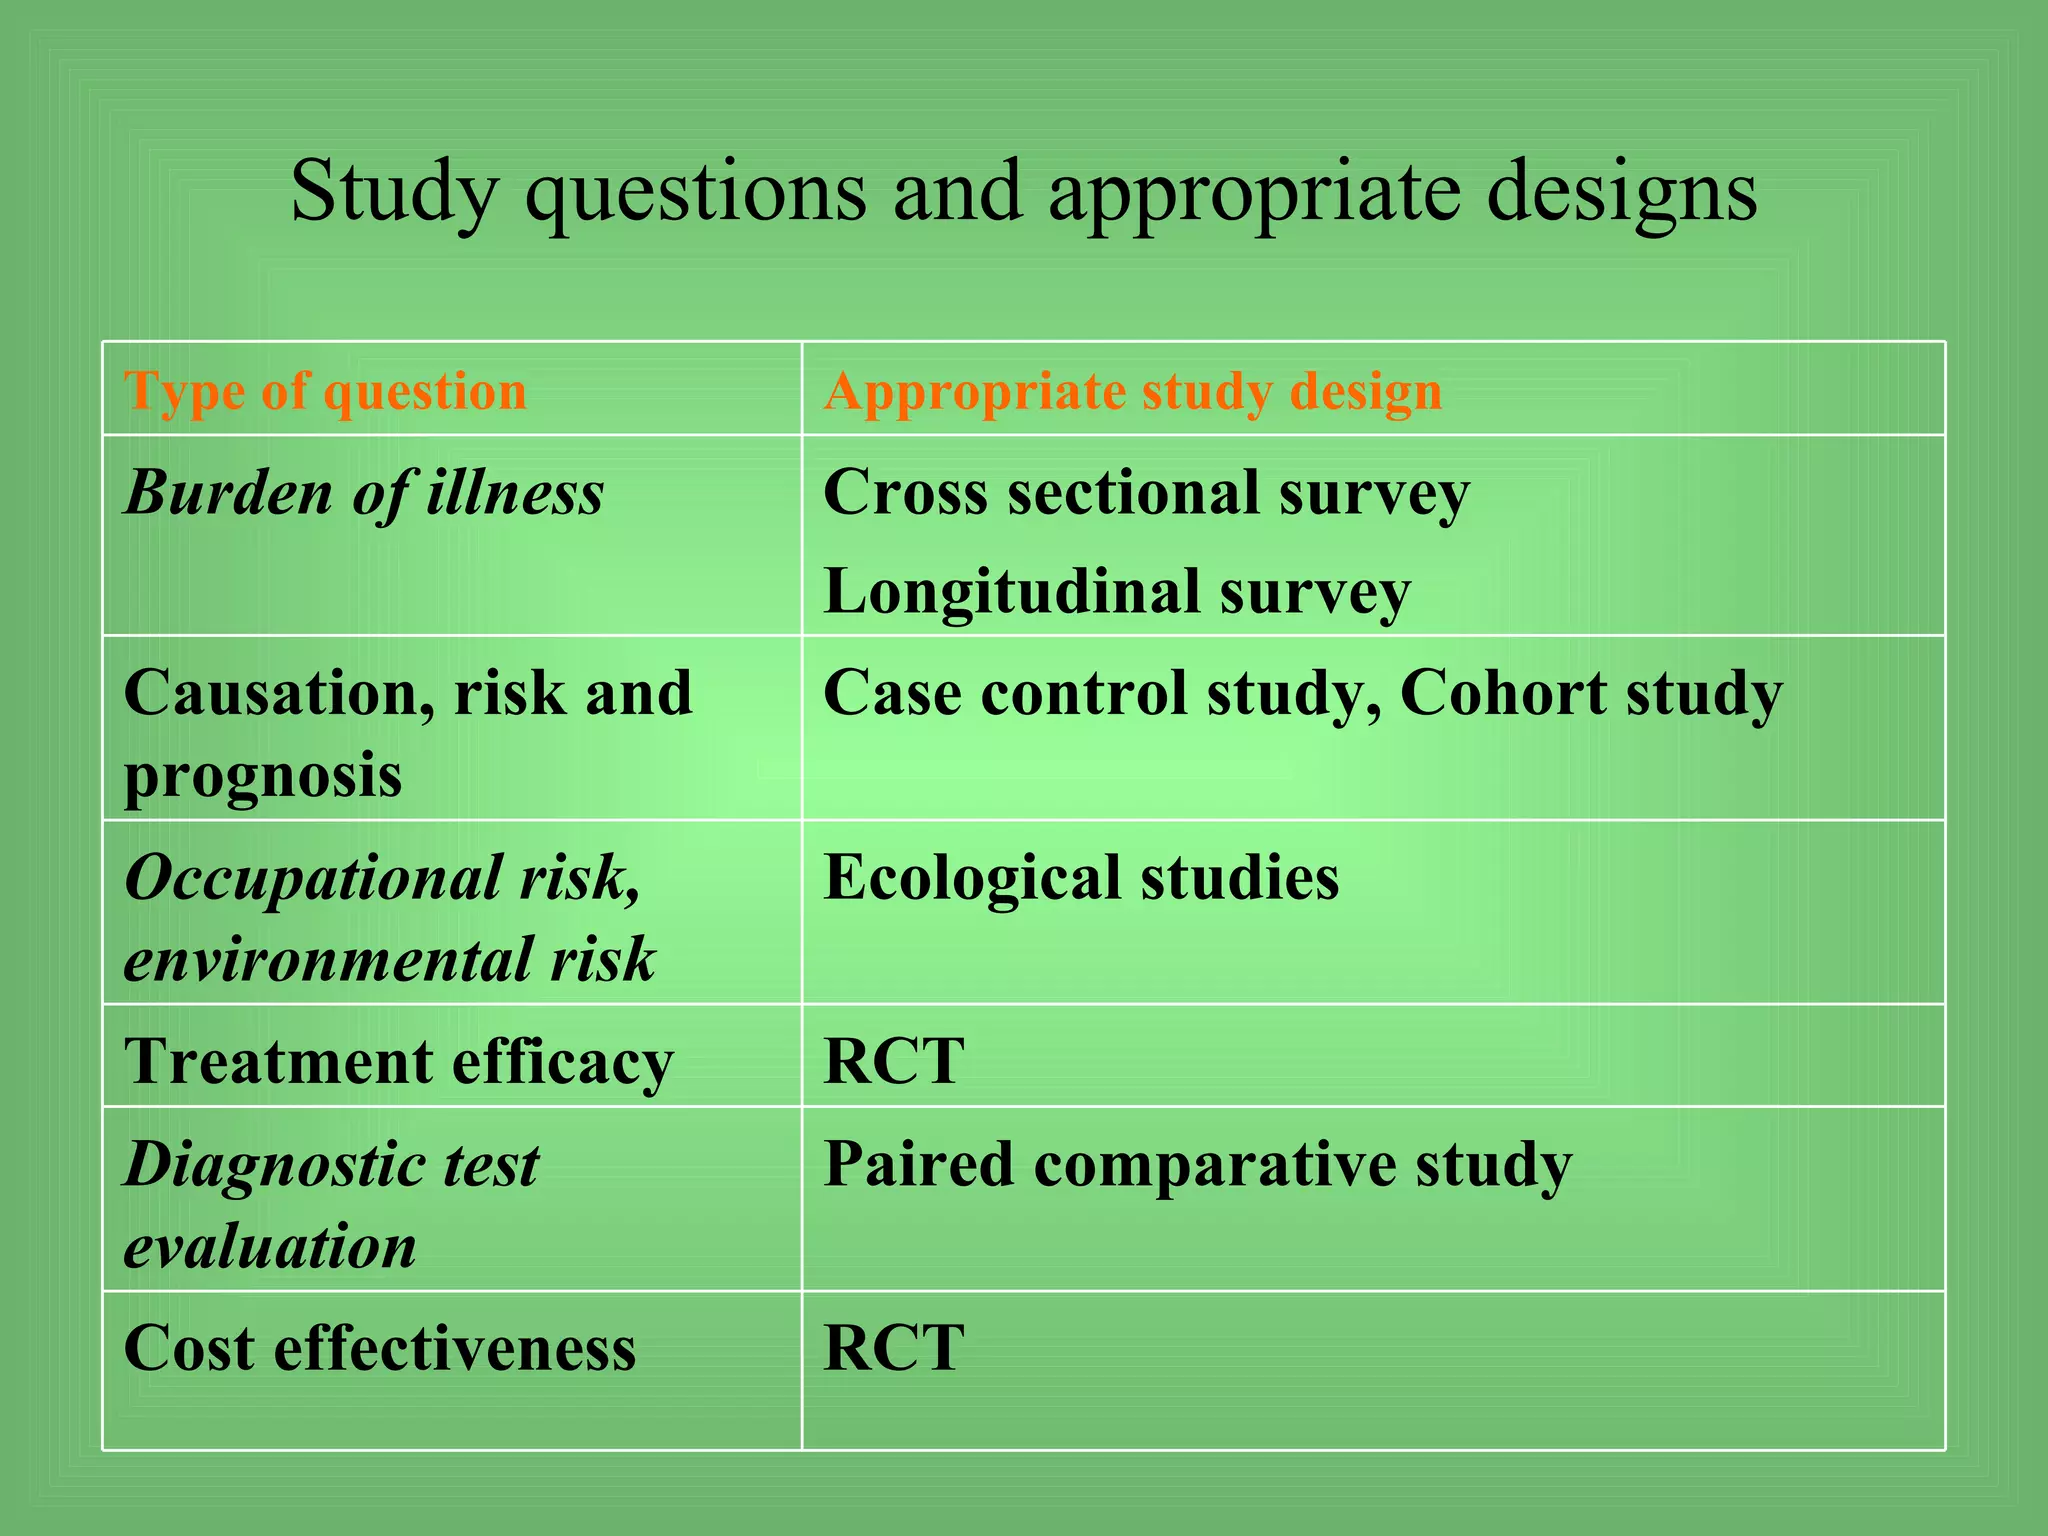


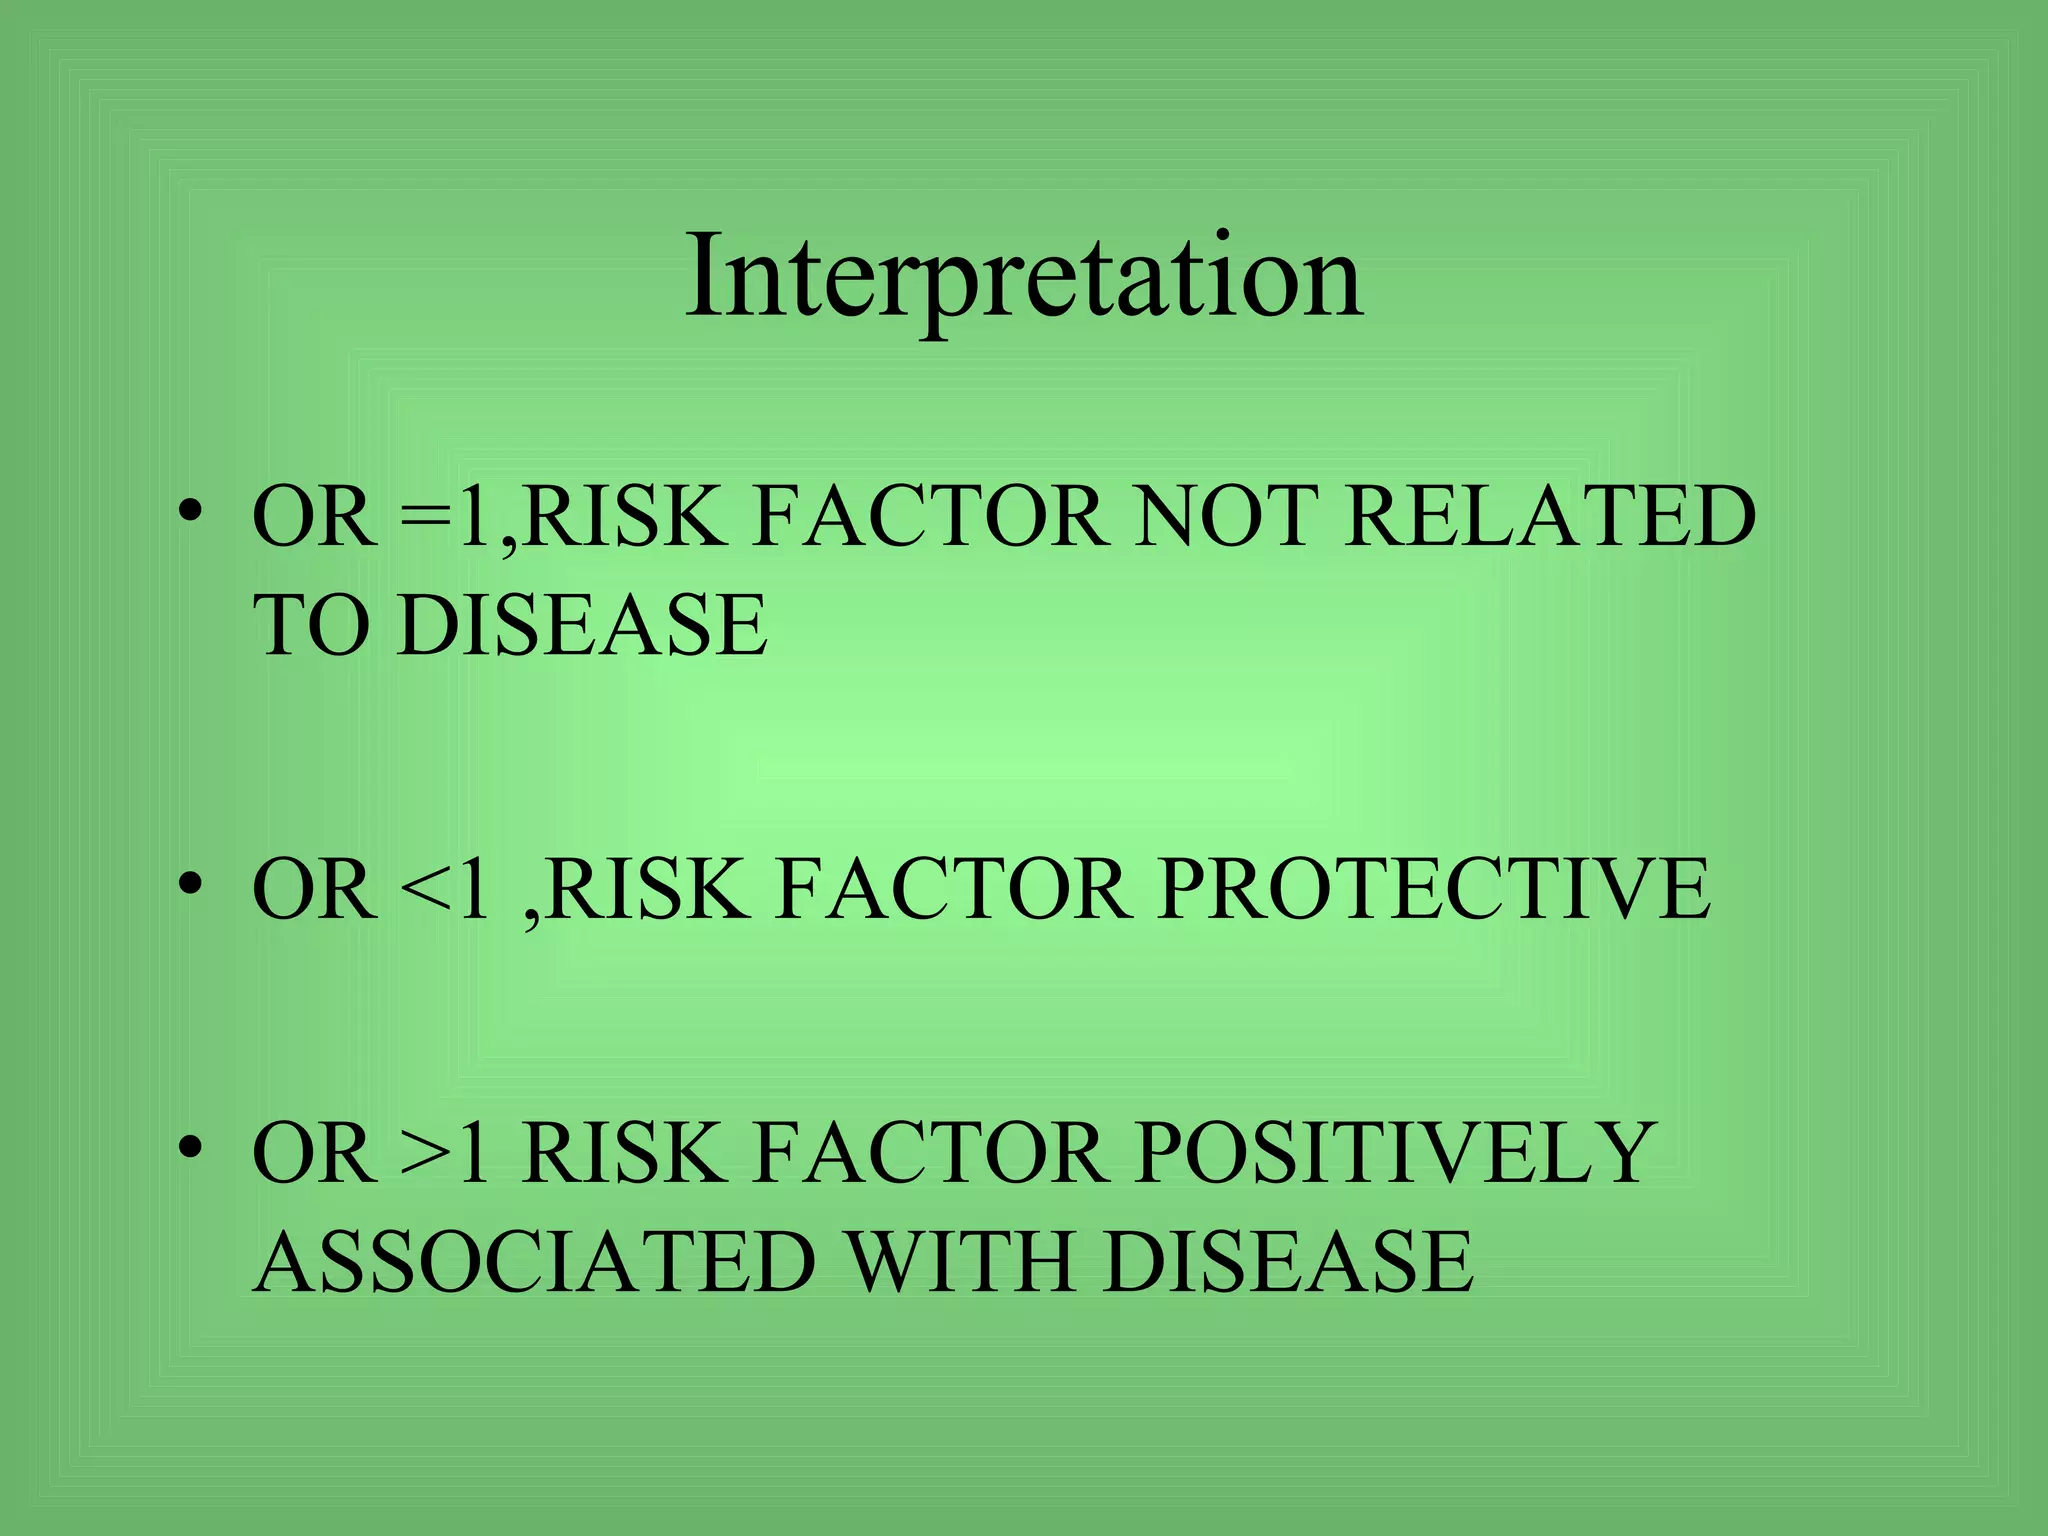
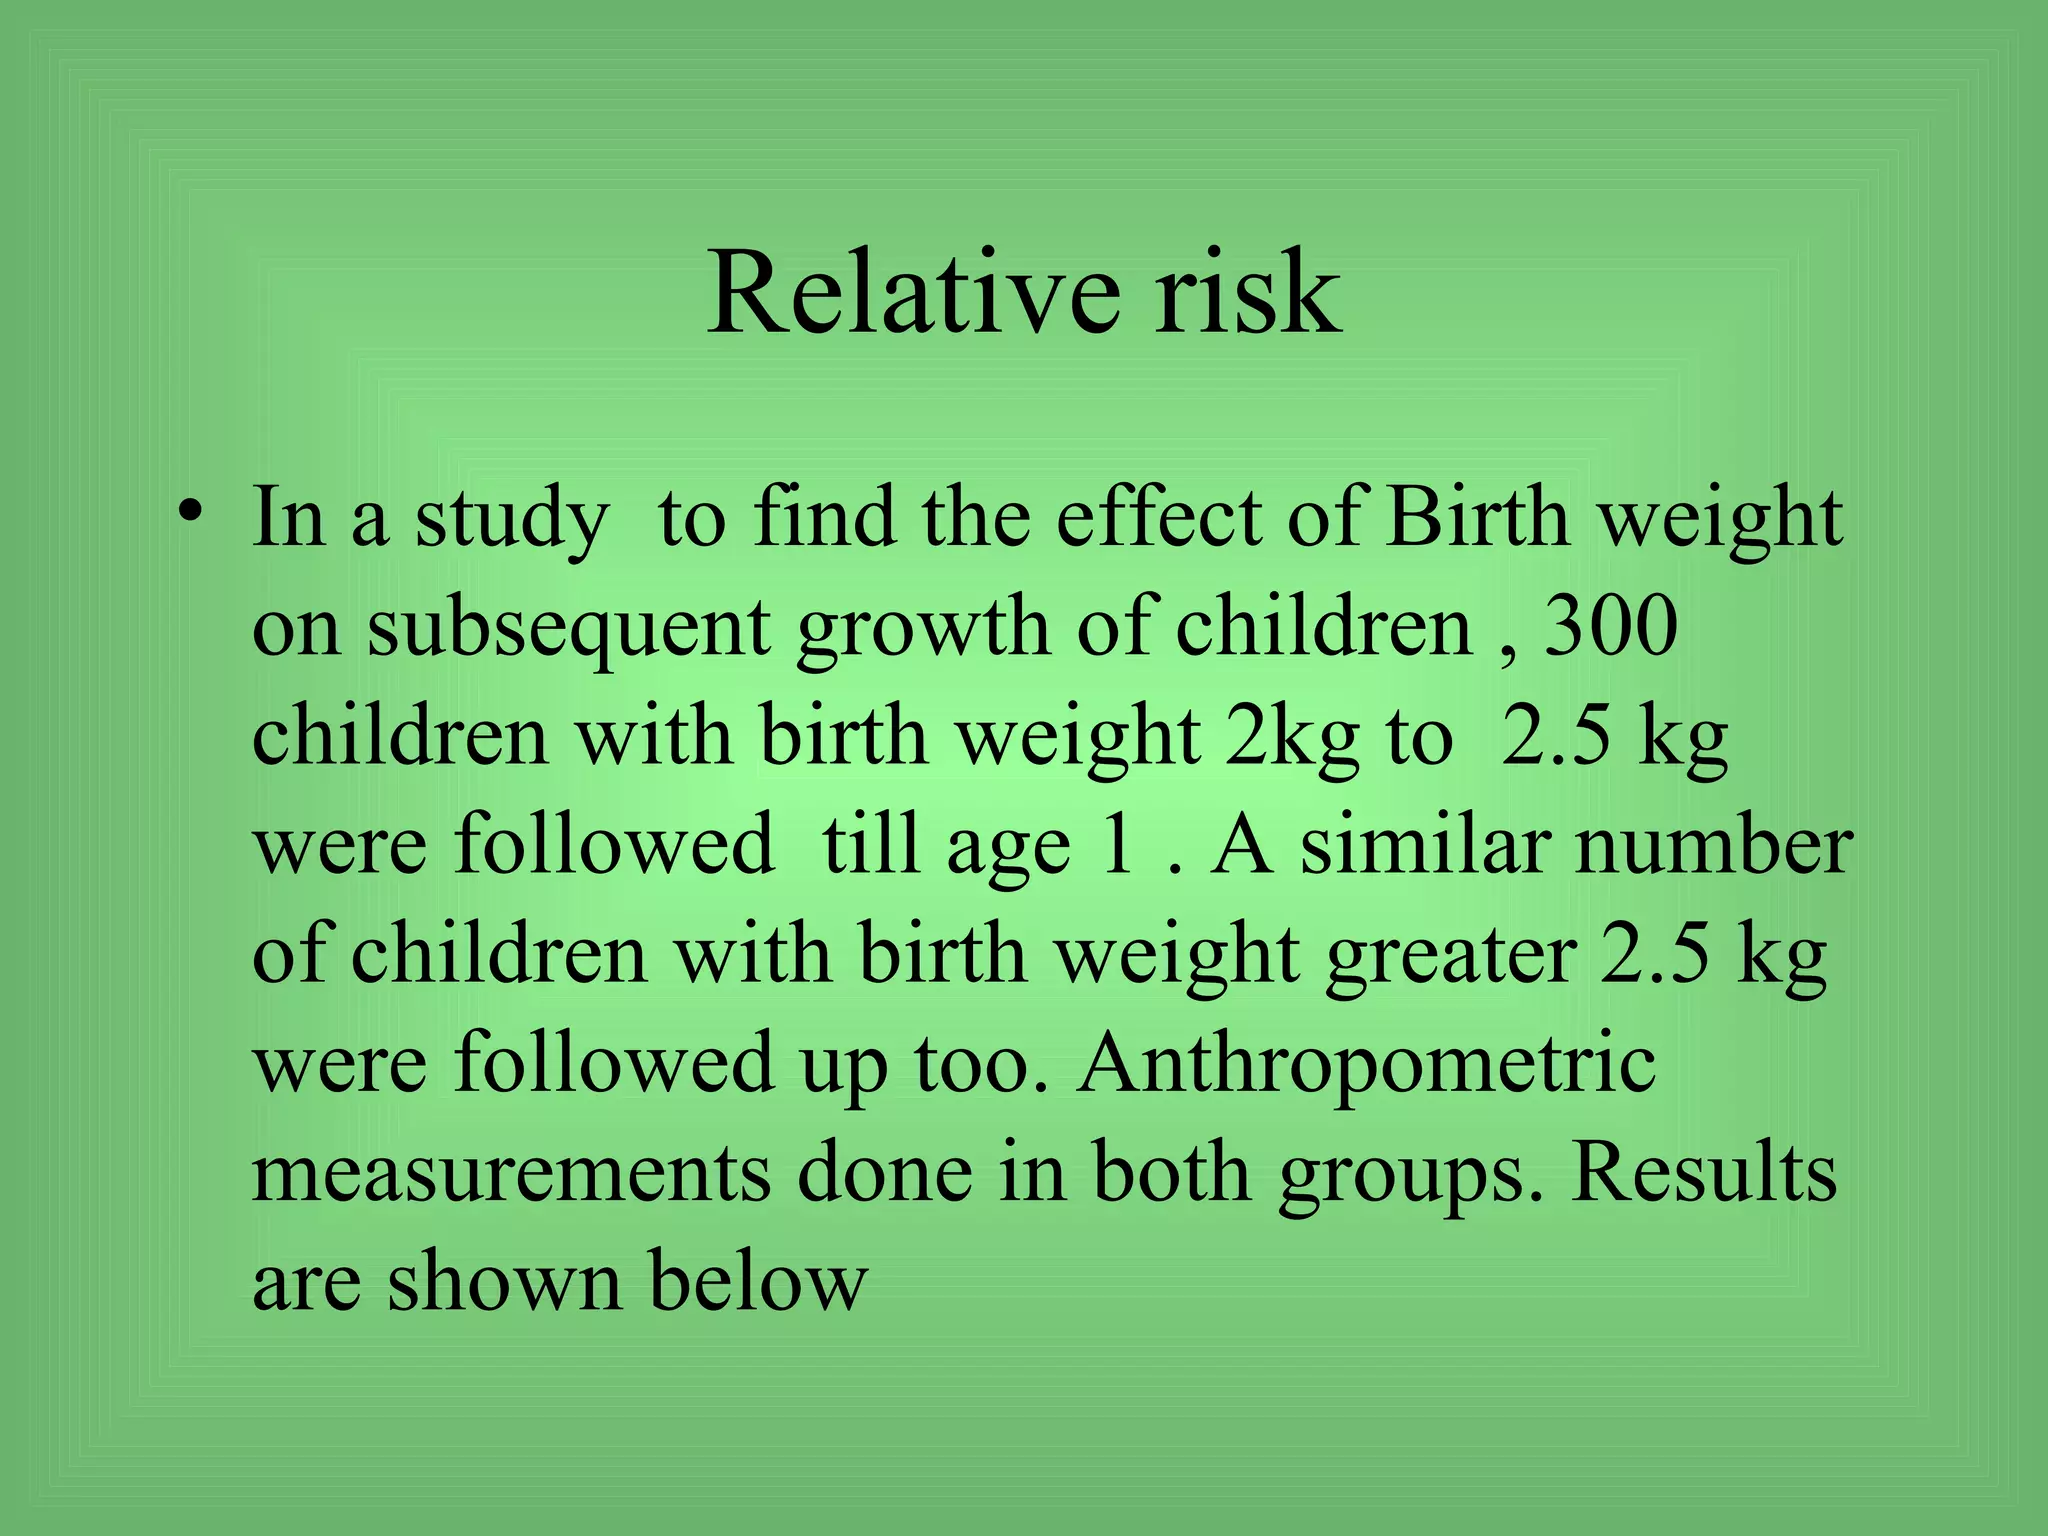


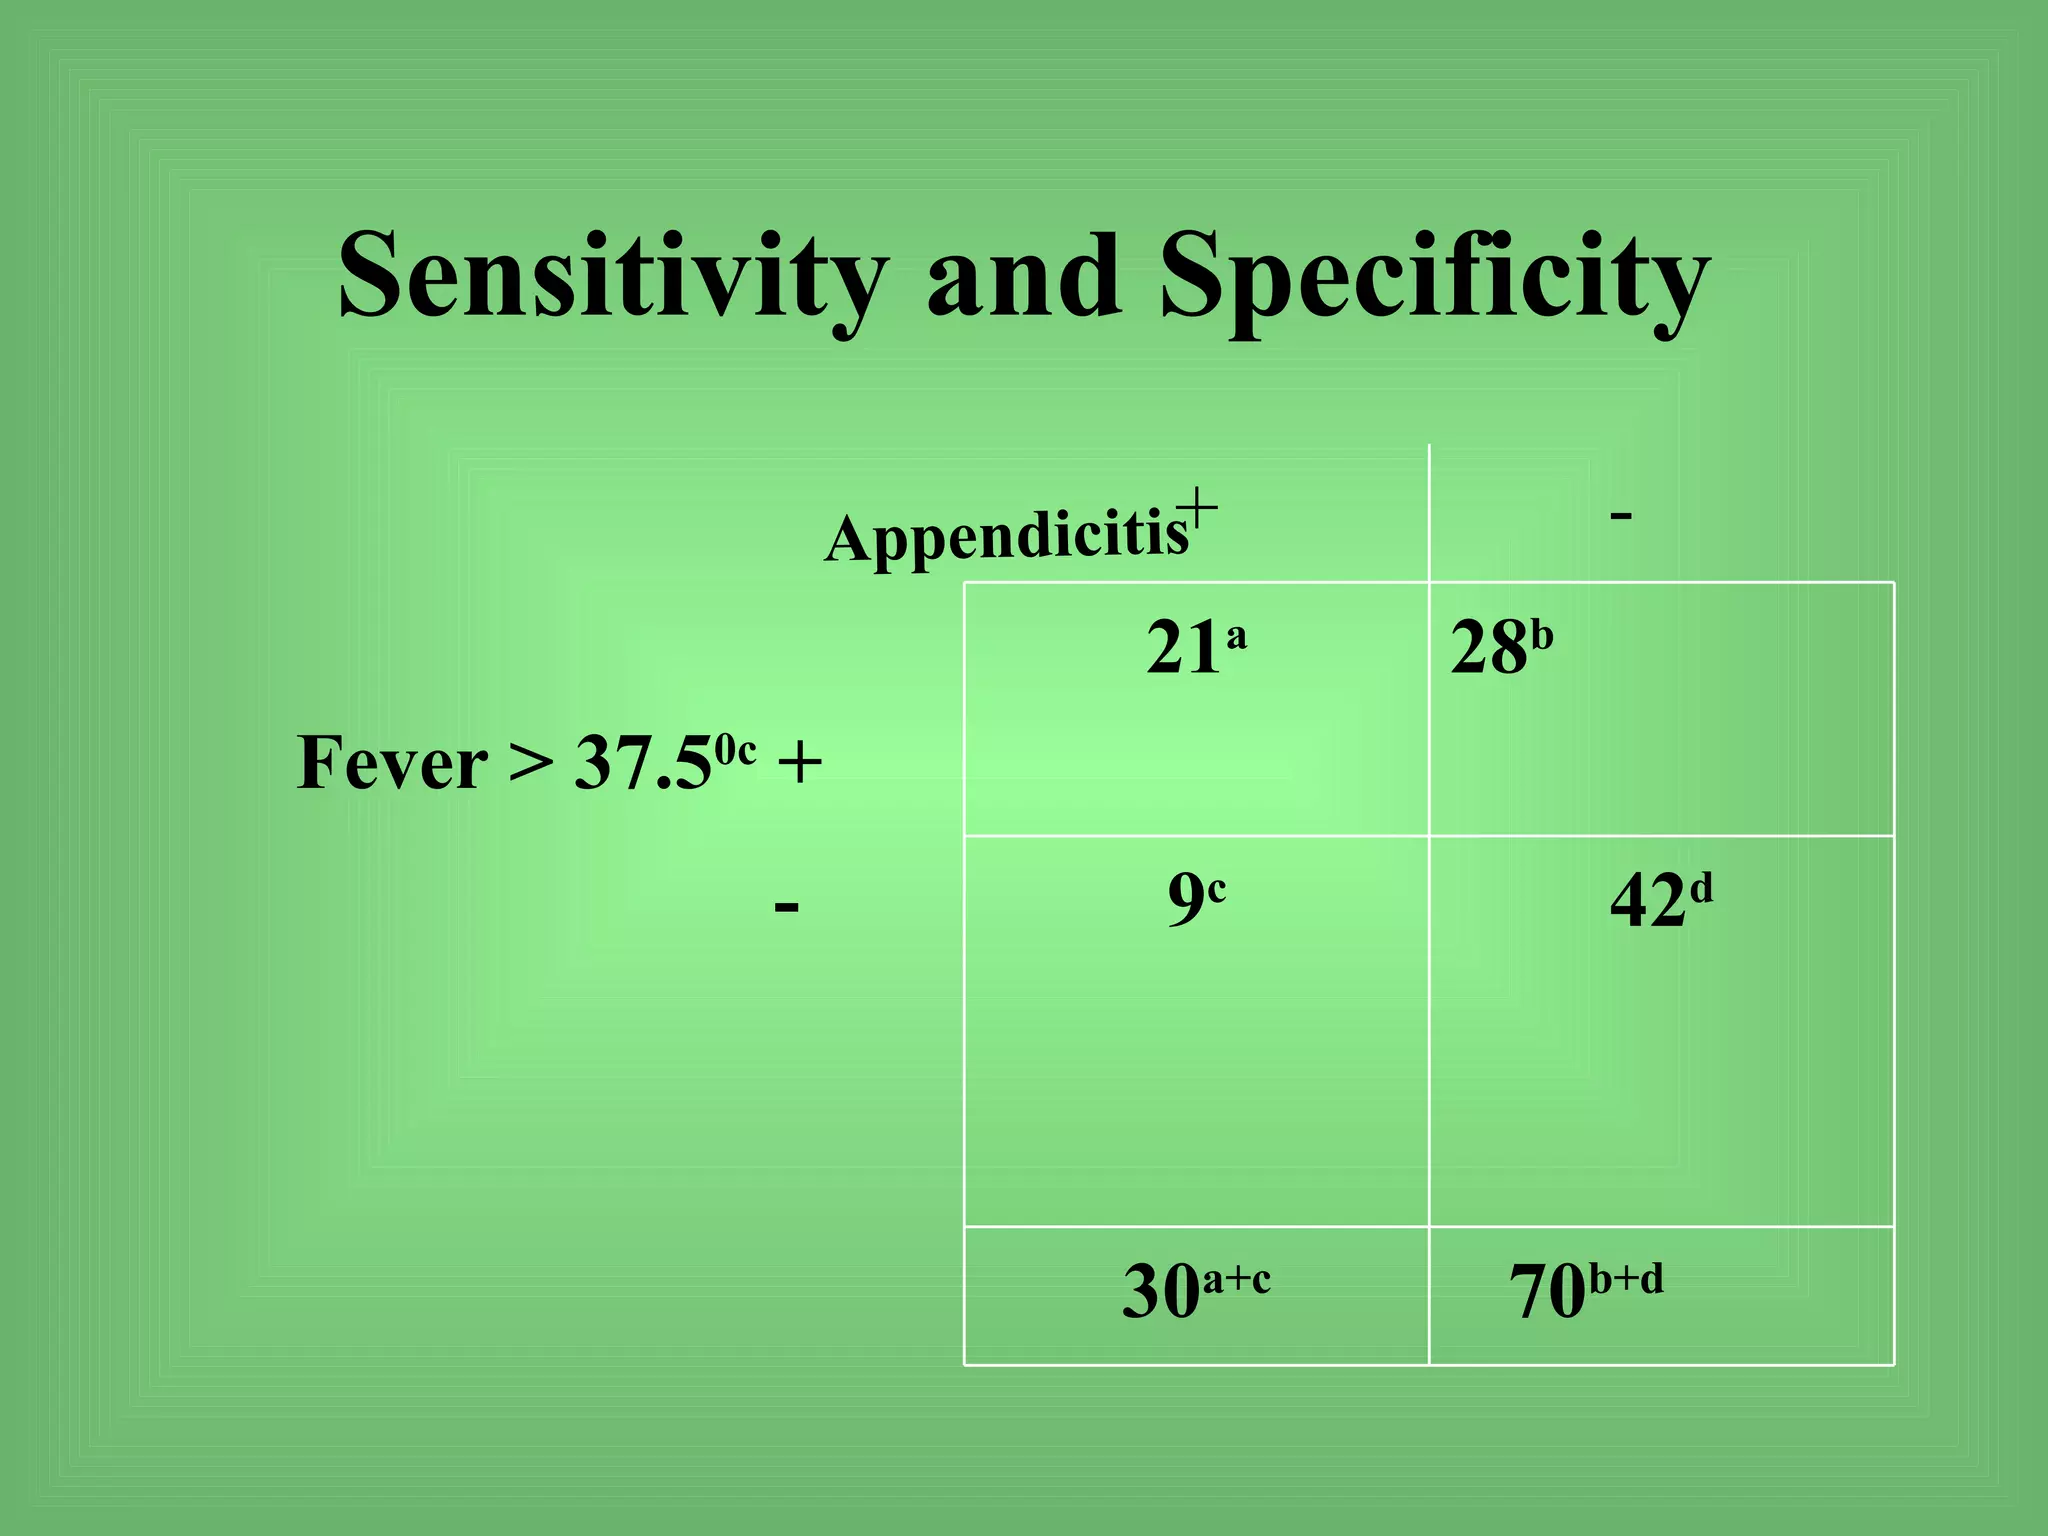

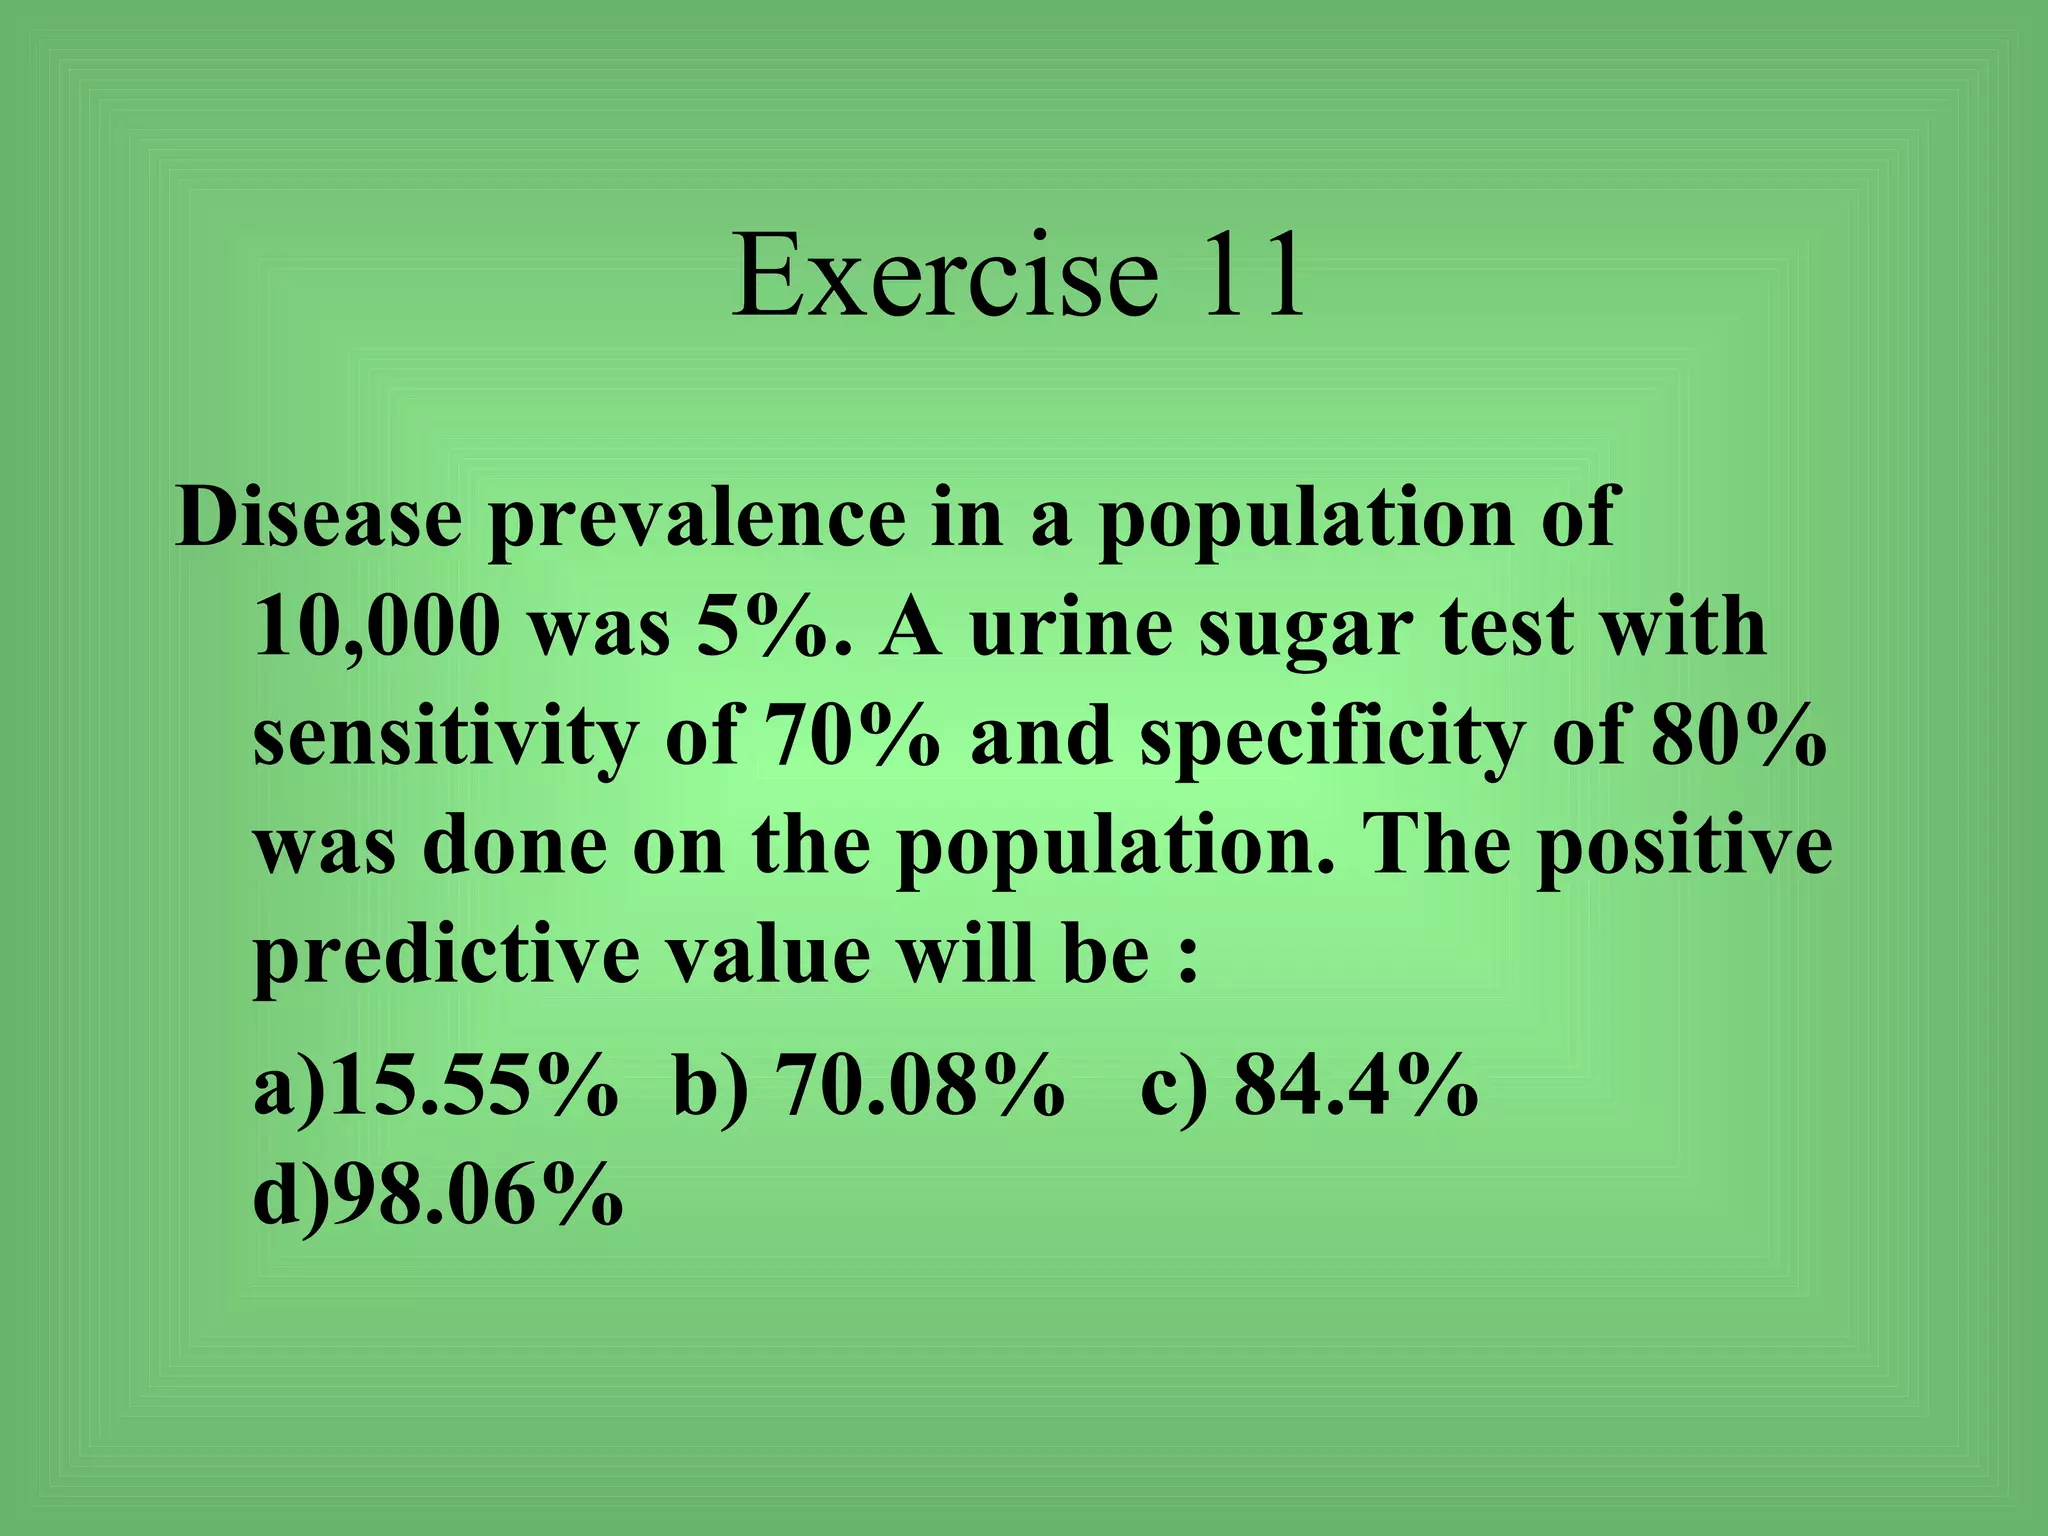


This document provides an overview of key statistical concepts for medical research including: - Common measures like mean, standard deviation, confidence intervals, and p-values. - Study designs such as randomized controlled trials. - Tests for comparing groups like t-tests, ANOVA, and chi-square tests. - Measures of disease frequency and test accuracy like sensitivity and specificity. - The importance of understanding statistics for medical research and exams. - Examples of choosing the appropriate statistical tests based on the study design and variables. In 3 sentences or less, it orients the reader to fundamental epidemiological and biostatistical concepts for medical research and exam preparation.