The document discusses the application of confidence intervals and normal distribution in conservation biology, particularly focusing on bear populations. It defines key concepts like confidence intervals, population mean, variance, point estimates, and critical values, illustrating their significance with examples related to bear data. The importance of these statistical tools in estimating population characteristics and improving understanding of bear demographics is emphasized.
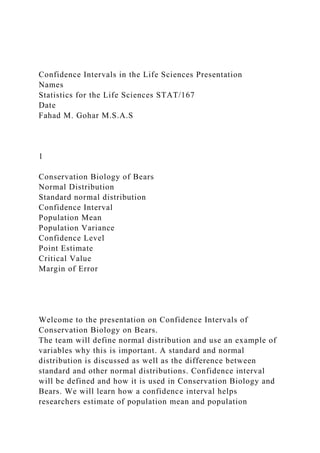
![a standard deviation of, and the total area under its density
curve equals 1.(M Triola, F. Triola)
By subtracting the mean from the chosen variable x and divide
by the standard deviation, you get the standard normal
distribution of z. (lbowen11235, 2010)
Applying this to the age of bears in our population, I’ll take the
total sample group of 54 bears and subtract the mean of
43.51852 and then divide by the standard deviation of 33.72068,
which then gives us a z score of 0.3108324, a mean of zero, and
a standard deviation of 1.
lbowen11235. (2010, October 22). Theory of Normal
Probability Calculations Using the Standard Normal Table
[Video file]. Retrieved from YouTube website:
http://www.youtube.com/watch?v=zCormwRIP9s
4
Confidence Interval
A confidence interval (or interval estimate) is a range (or an
interval) of values used to estimate the true value of a
population parameter.
A confidence interval is sometimes abbreviated as CI.
5
Confidence Interval (Population Mean)
The confidence interval can tell us what values the population](https://image.slidesharecdn.com/confidenceintervalsinthelifesciencespresentationnamess-221112184526-e8454b3c/85/Confidence-Intervals-in-the-Life-Sciences-PresentationNamesS-docx-4-320.jpg)
![be constructed. The presenter has passed out more information
and a larger picture of the Statdisk information for the audience
to see what the presenter is discussing.
13
References (ALL)
Admin. (2006) Six Sigma Tutorial, Confidence Interval.
Retrieved October 3, 2011 from http://sixsigmatutorial.com/six-
sigma-confidence-intervals-tutorial/411/
Harris, R. B., White, G. C., Schwartz, C. C., & Haroldson, M.
A. (2007). Population growth of Yellowstone grizzly bears:
uncertainty and future monitoring. Ursus, 18(2), 168-178.
Retrieved from EBSCOhost.
lbowen11235. (2010, October 22). Theory of Normal
Probability Calculations Using the Standard Normal Table
[Video file]. Retrieved from YouTube website:
http://www.youtube.com/watch?v=zCormwRIP9s
Psomas, N. (2003).Chapter 6 Point Estimation. Retrieved
October 1, 2011, from
http://www.marin.edu/~npsomas/Lectures/ch6_confidence_inter
vals.htm
Triola, M. M., & Triola, M. F. (2006). Biostatistics for the
biological and health sciences. Boston, MA: Addison
Wesley/Pearson.
14](https://image.slidesharecdn.com/confidenceintervalsinthelifesciencespresentationnamess-221112184526-e8454b3c/85/Confidence-Intervals-in-the-Life-Sciences-PresentationNamesS-docx-11-320.jpg)