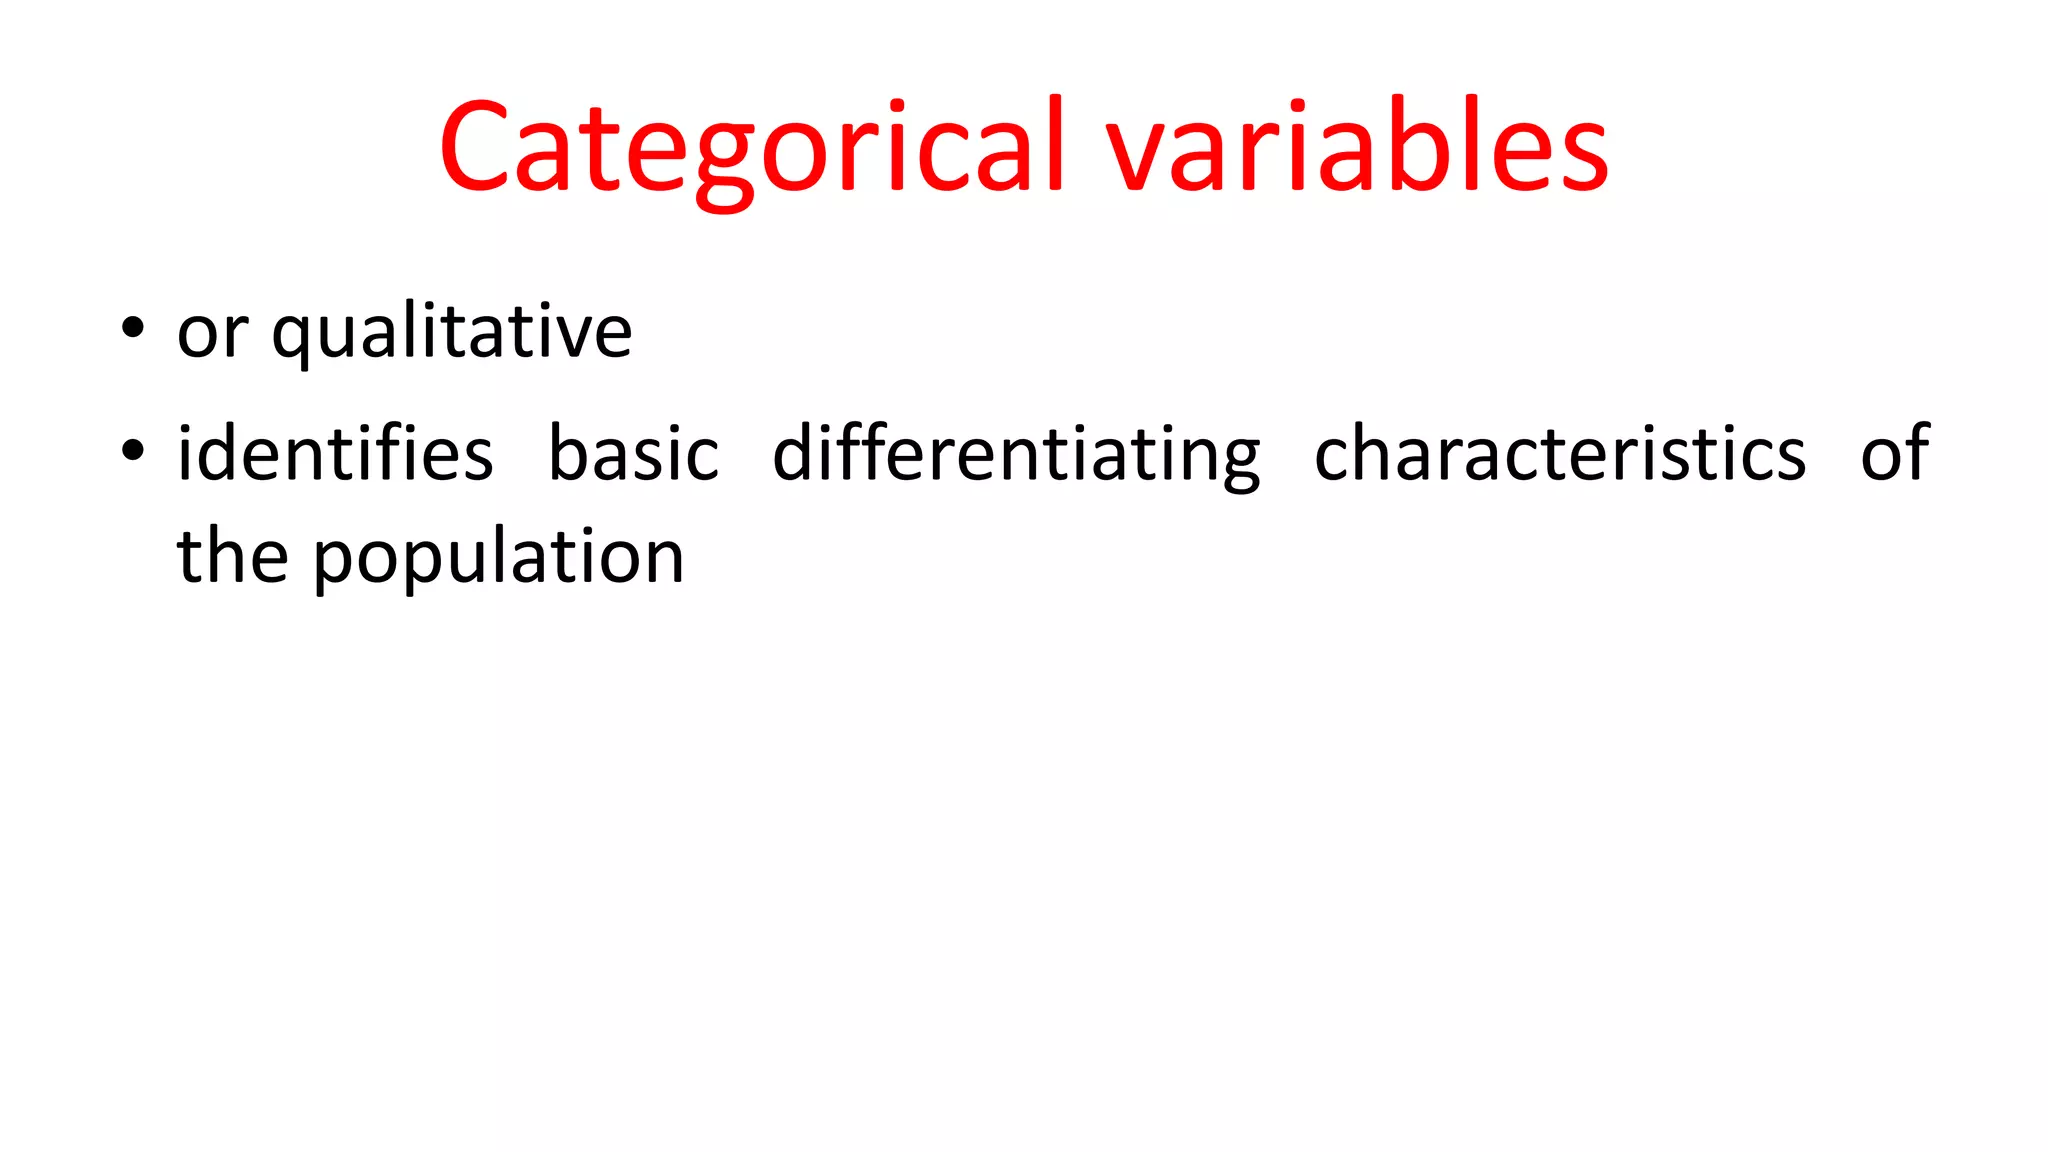
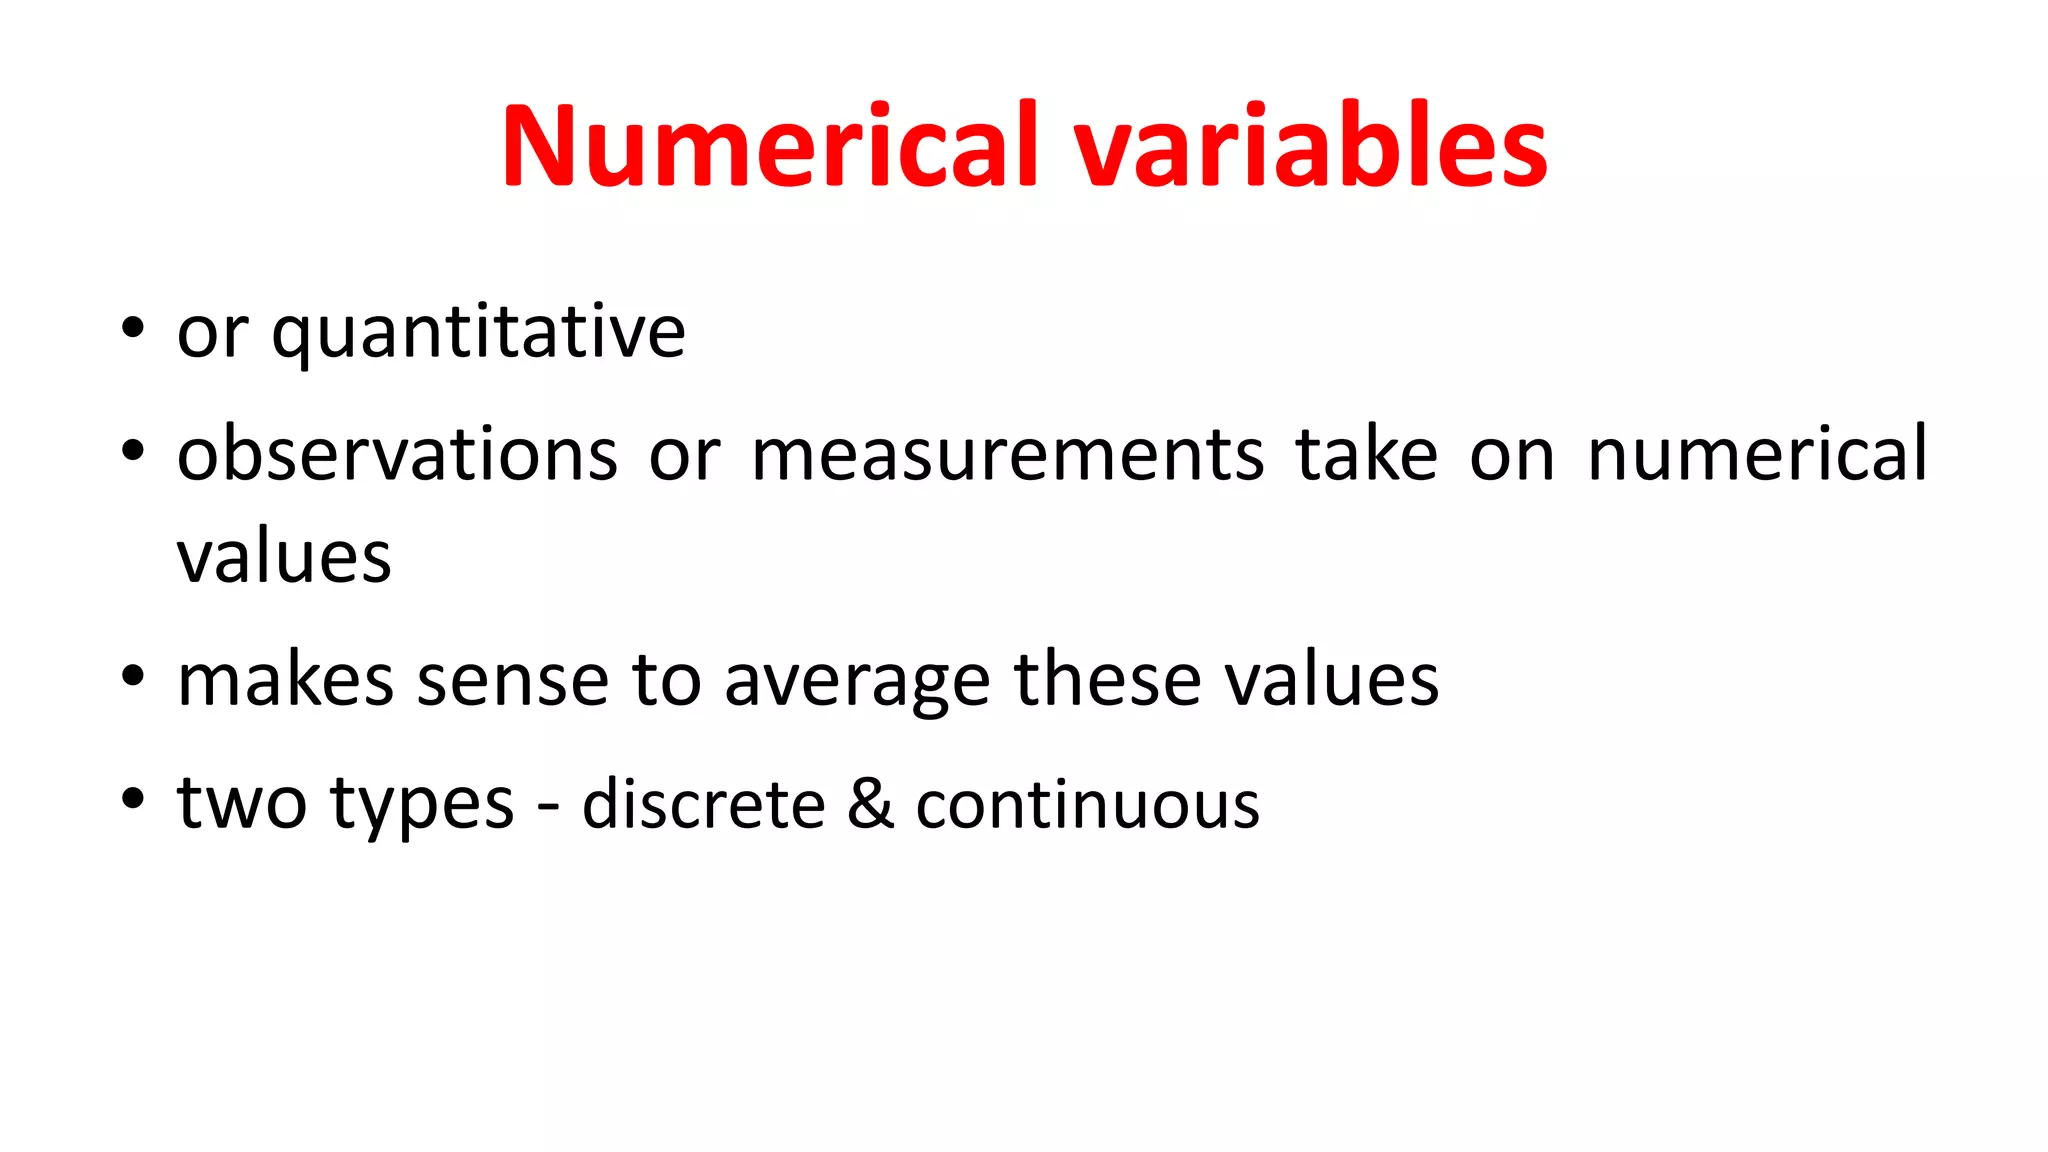
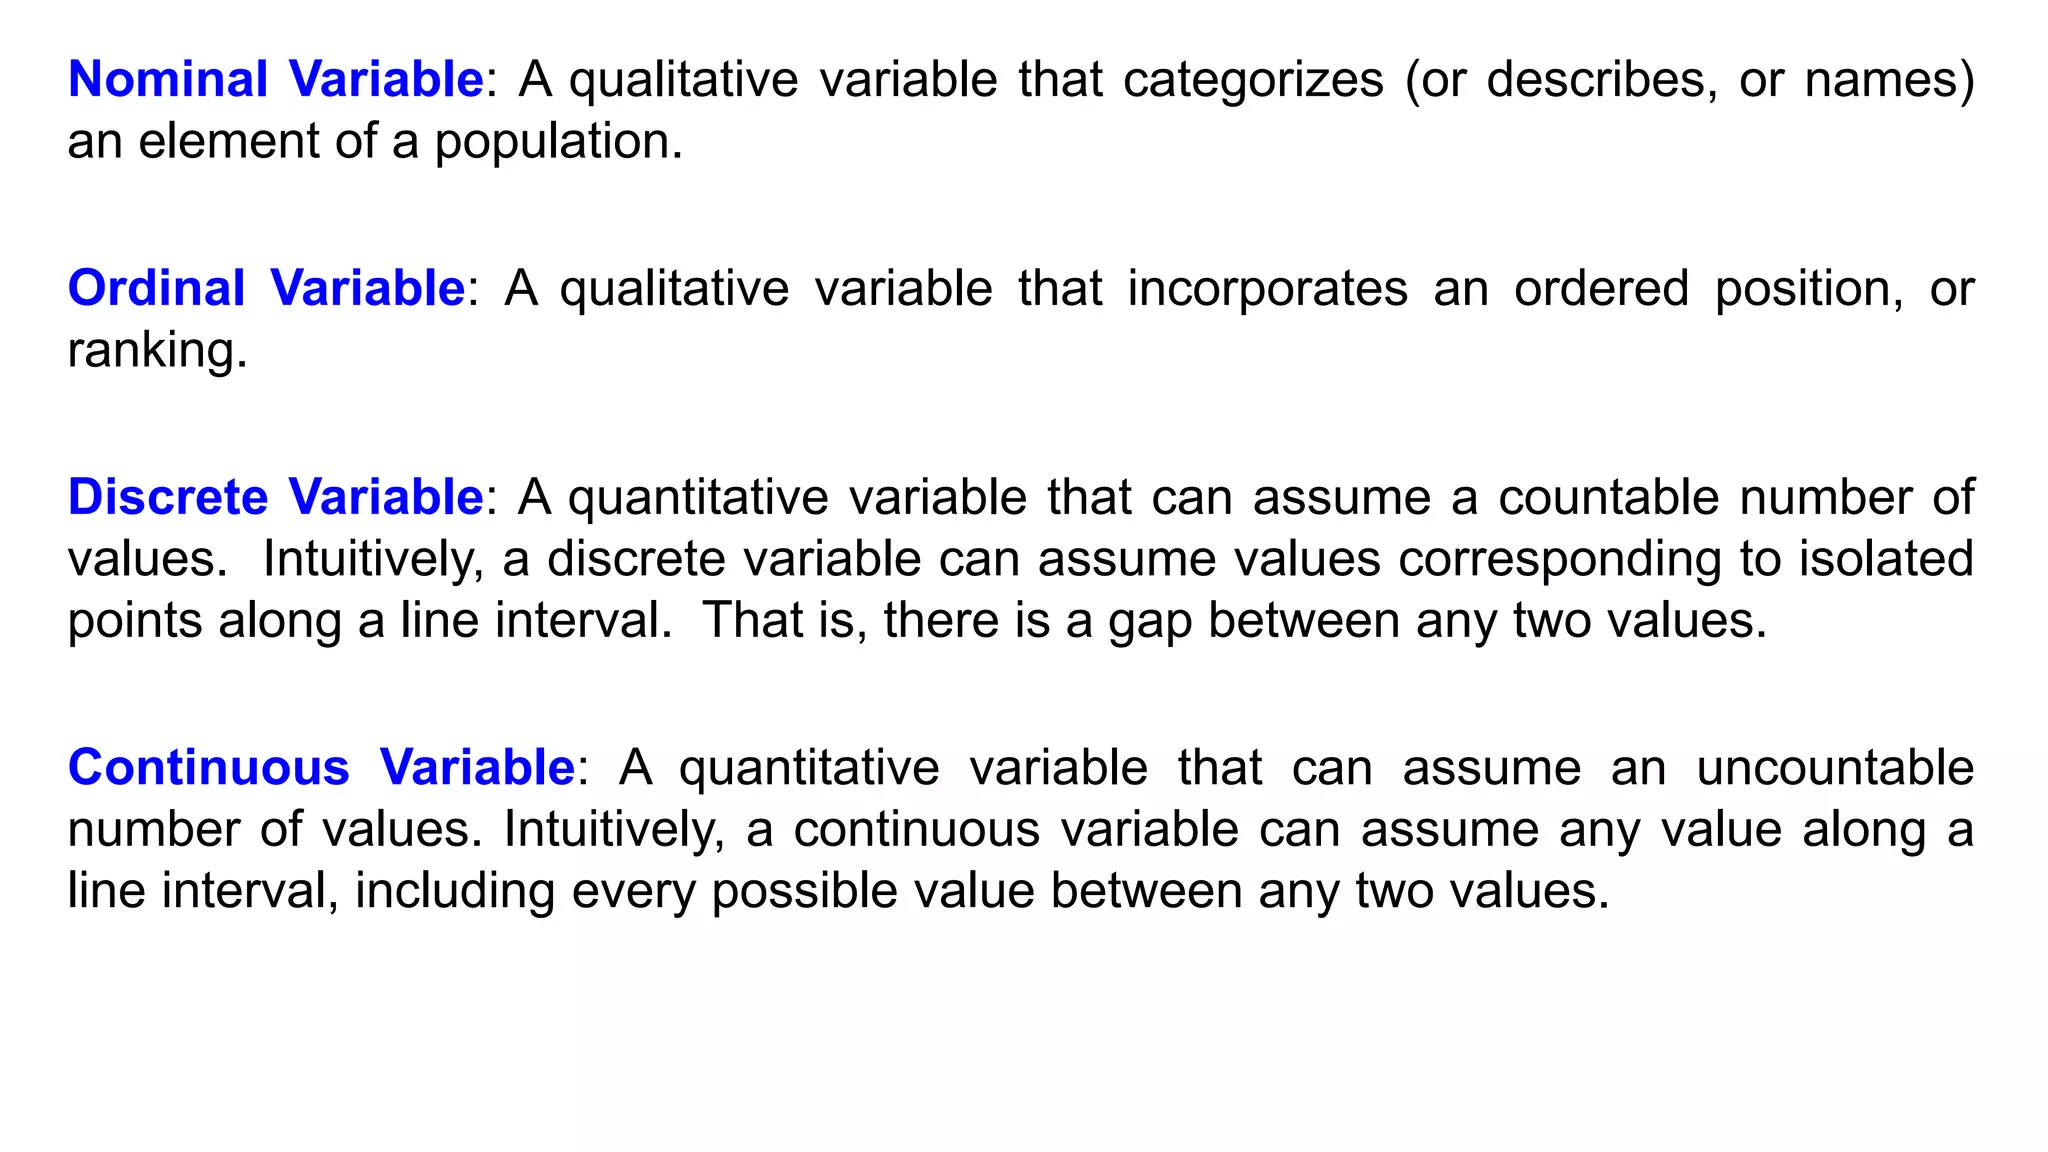
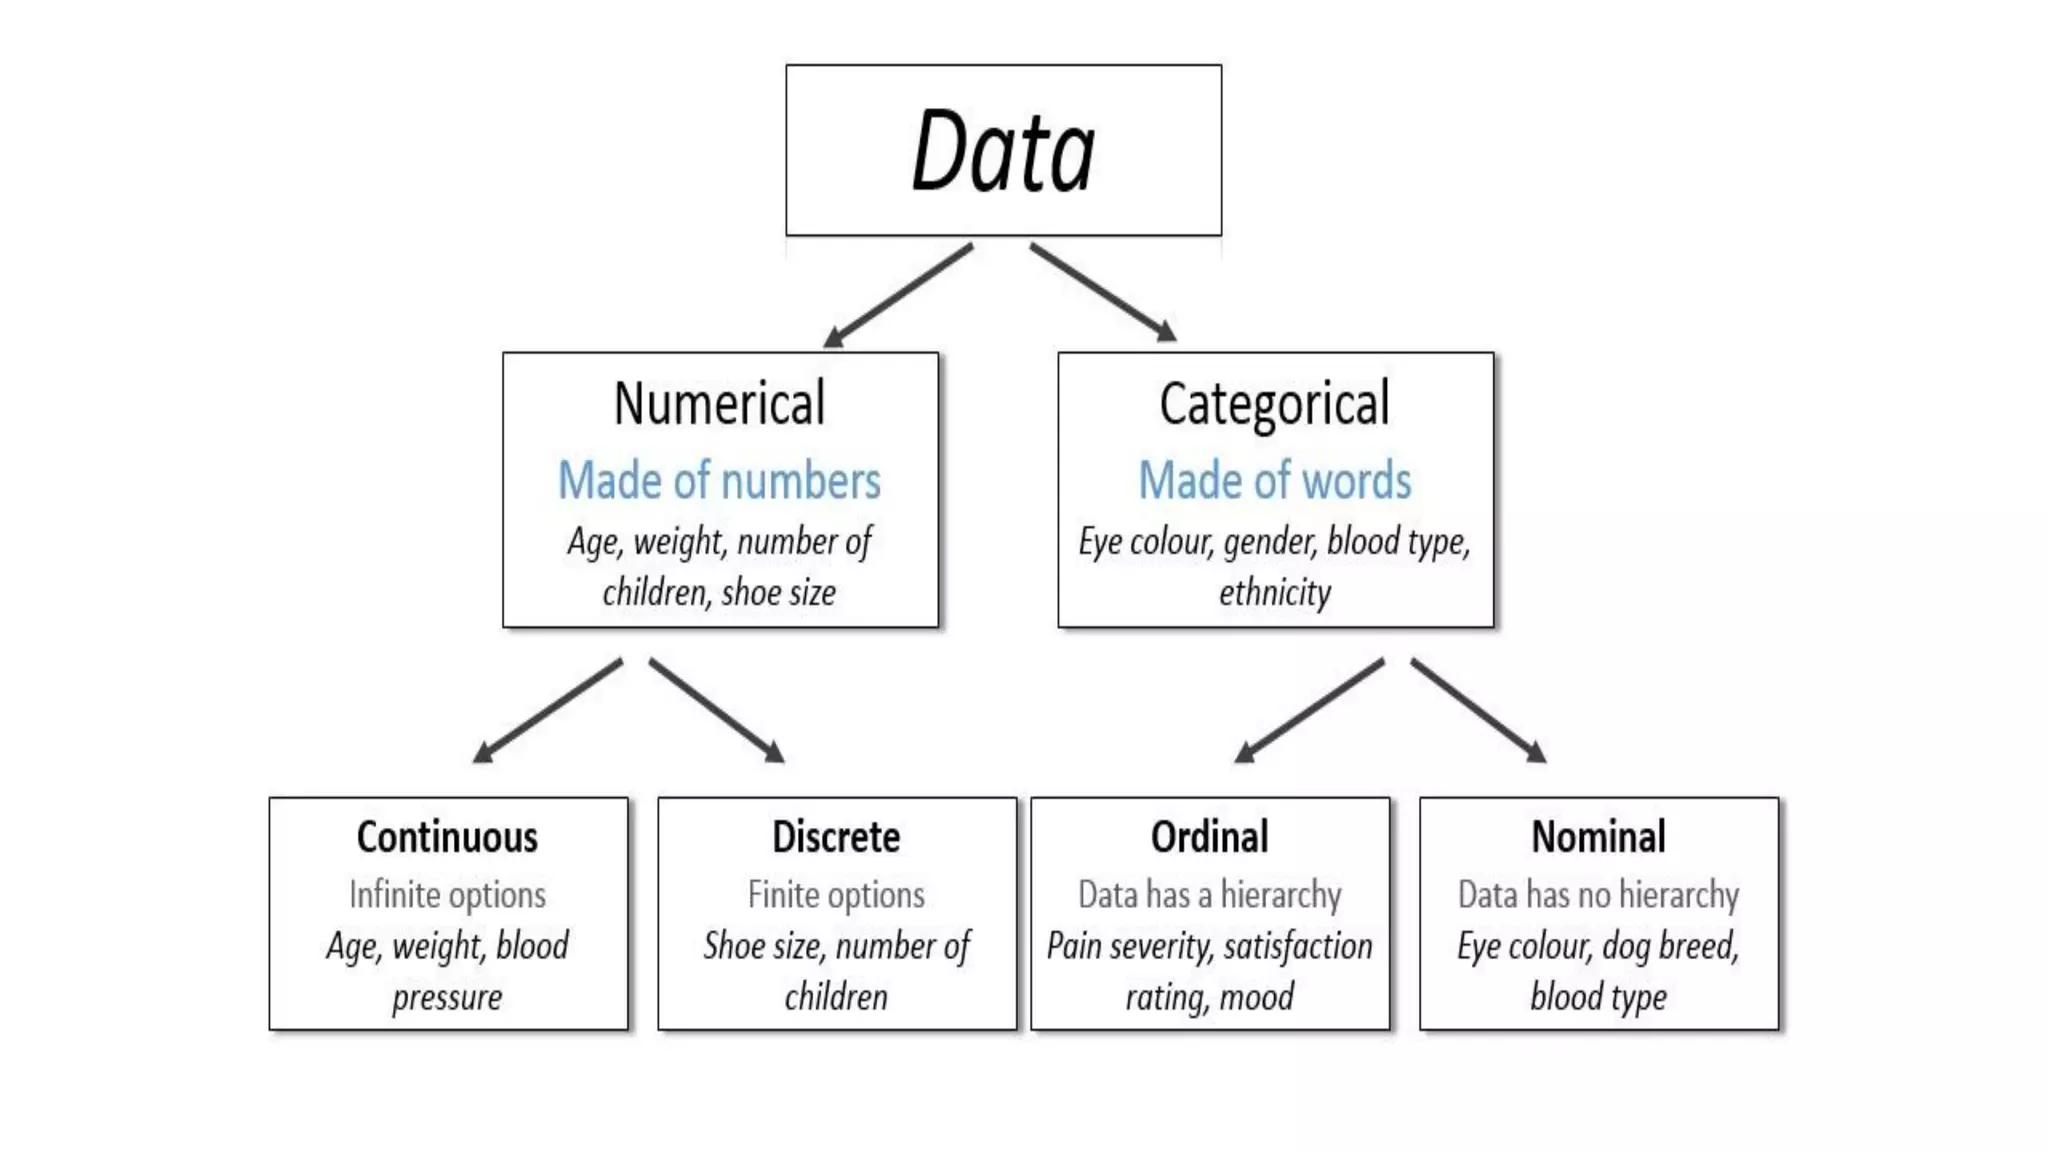
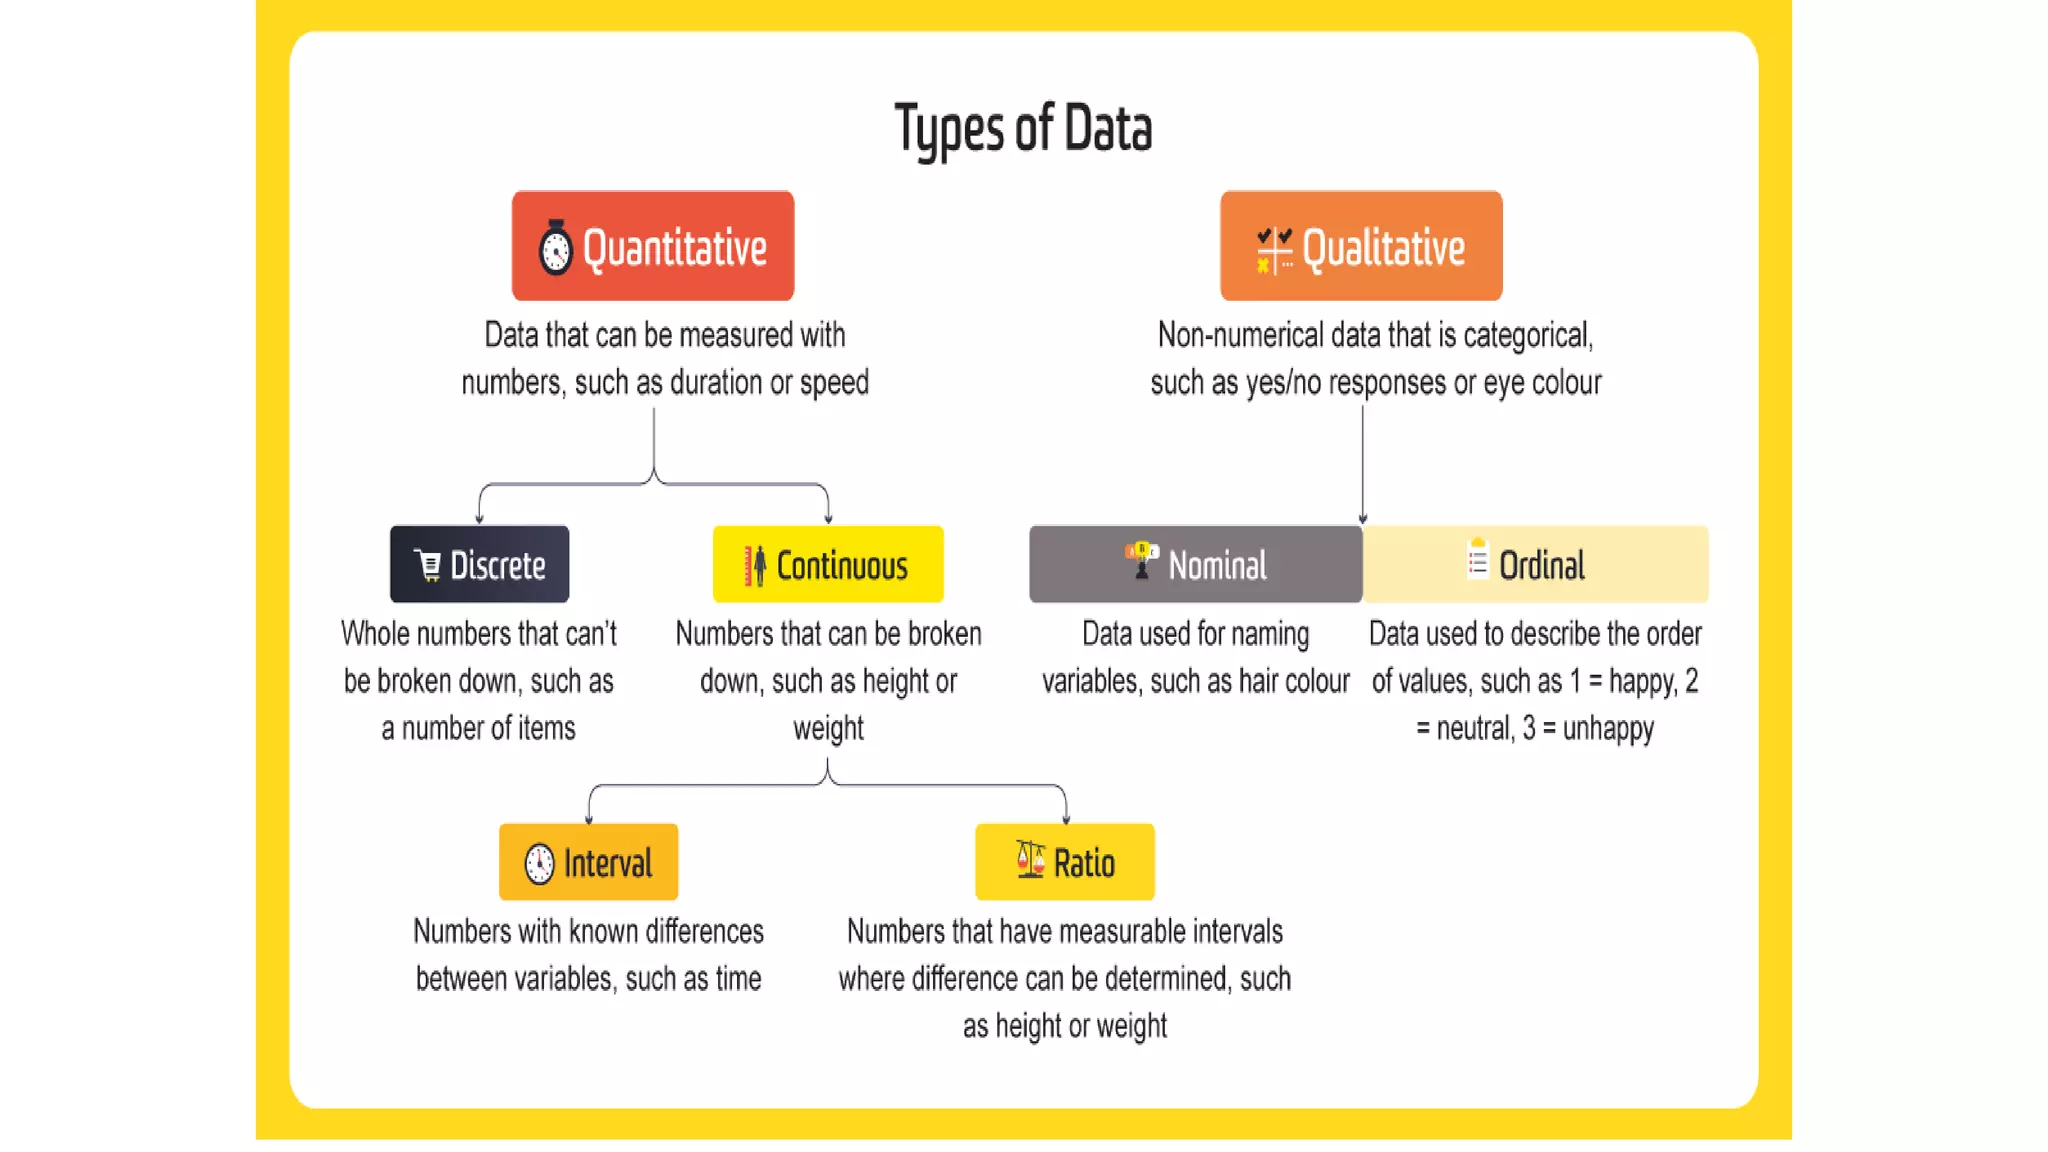
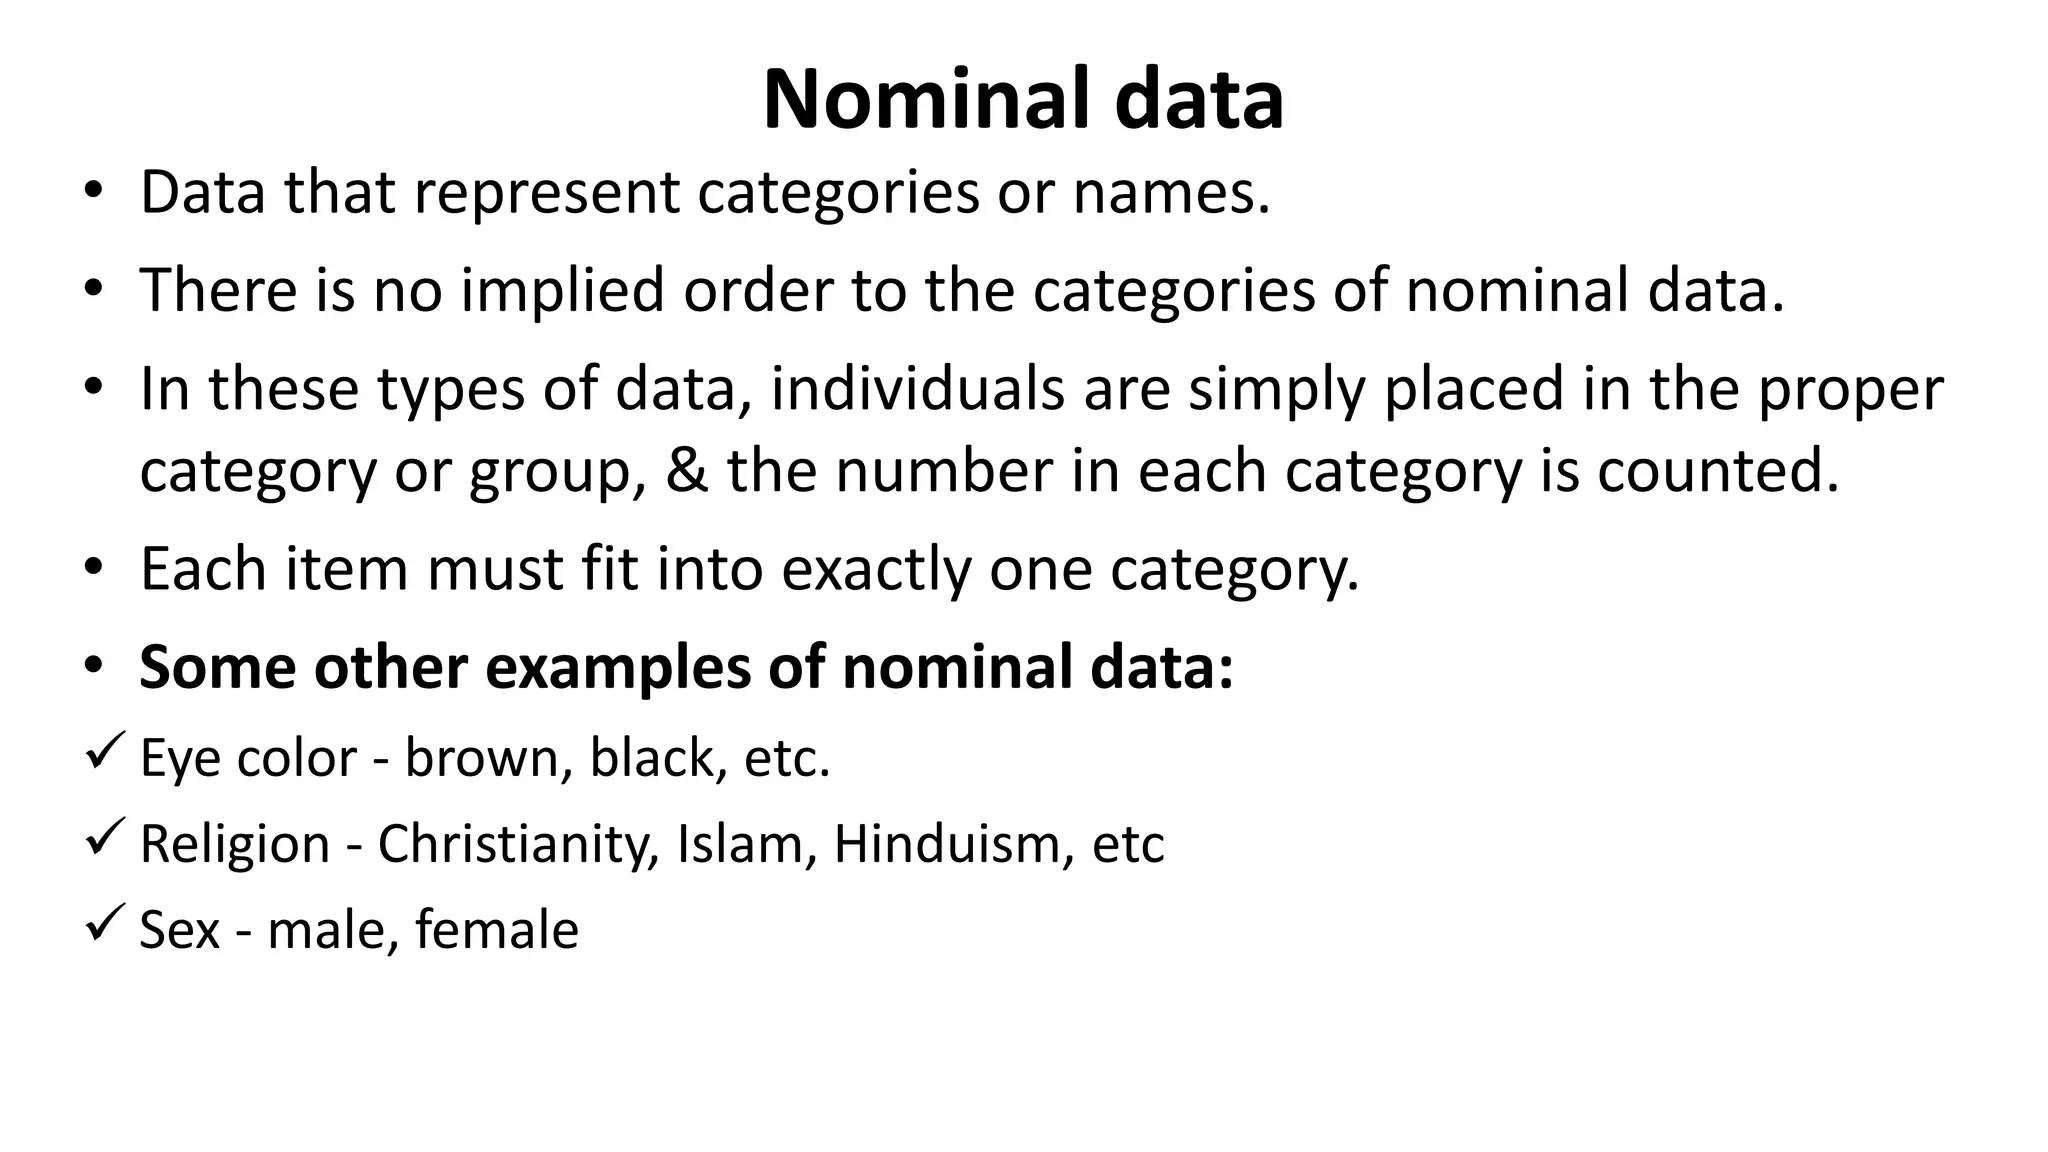
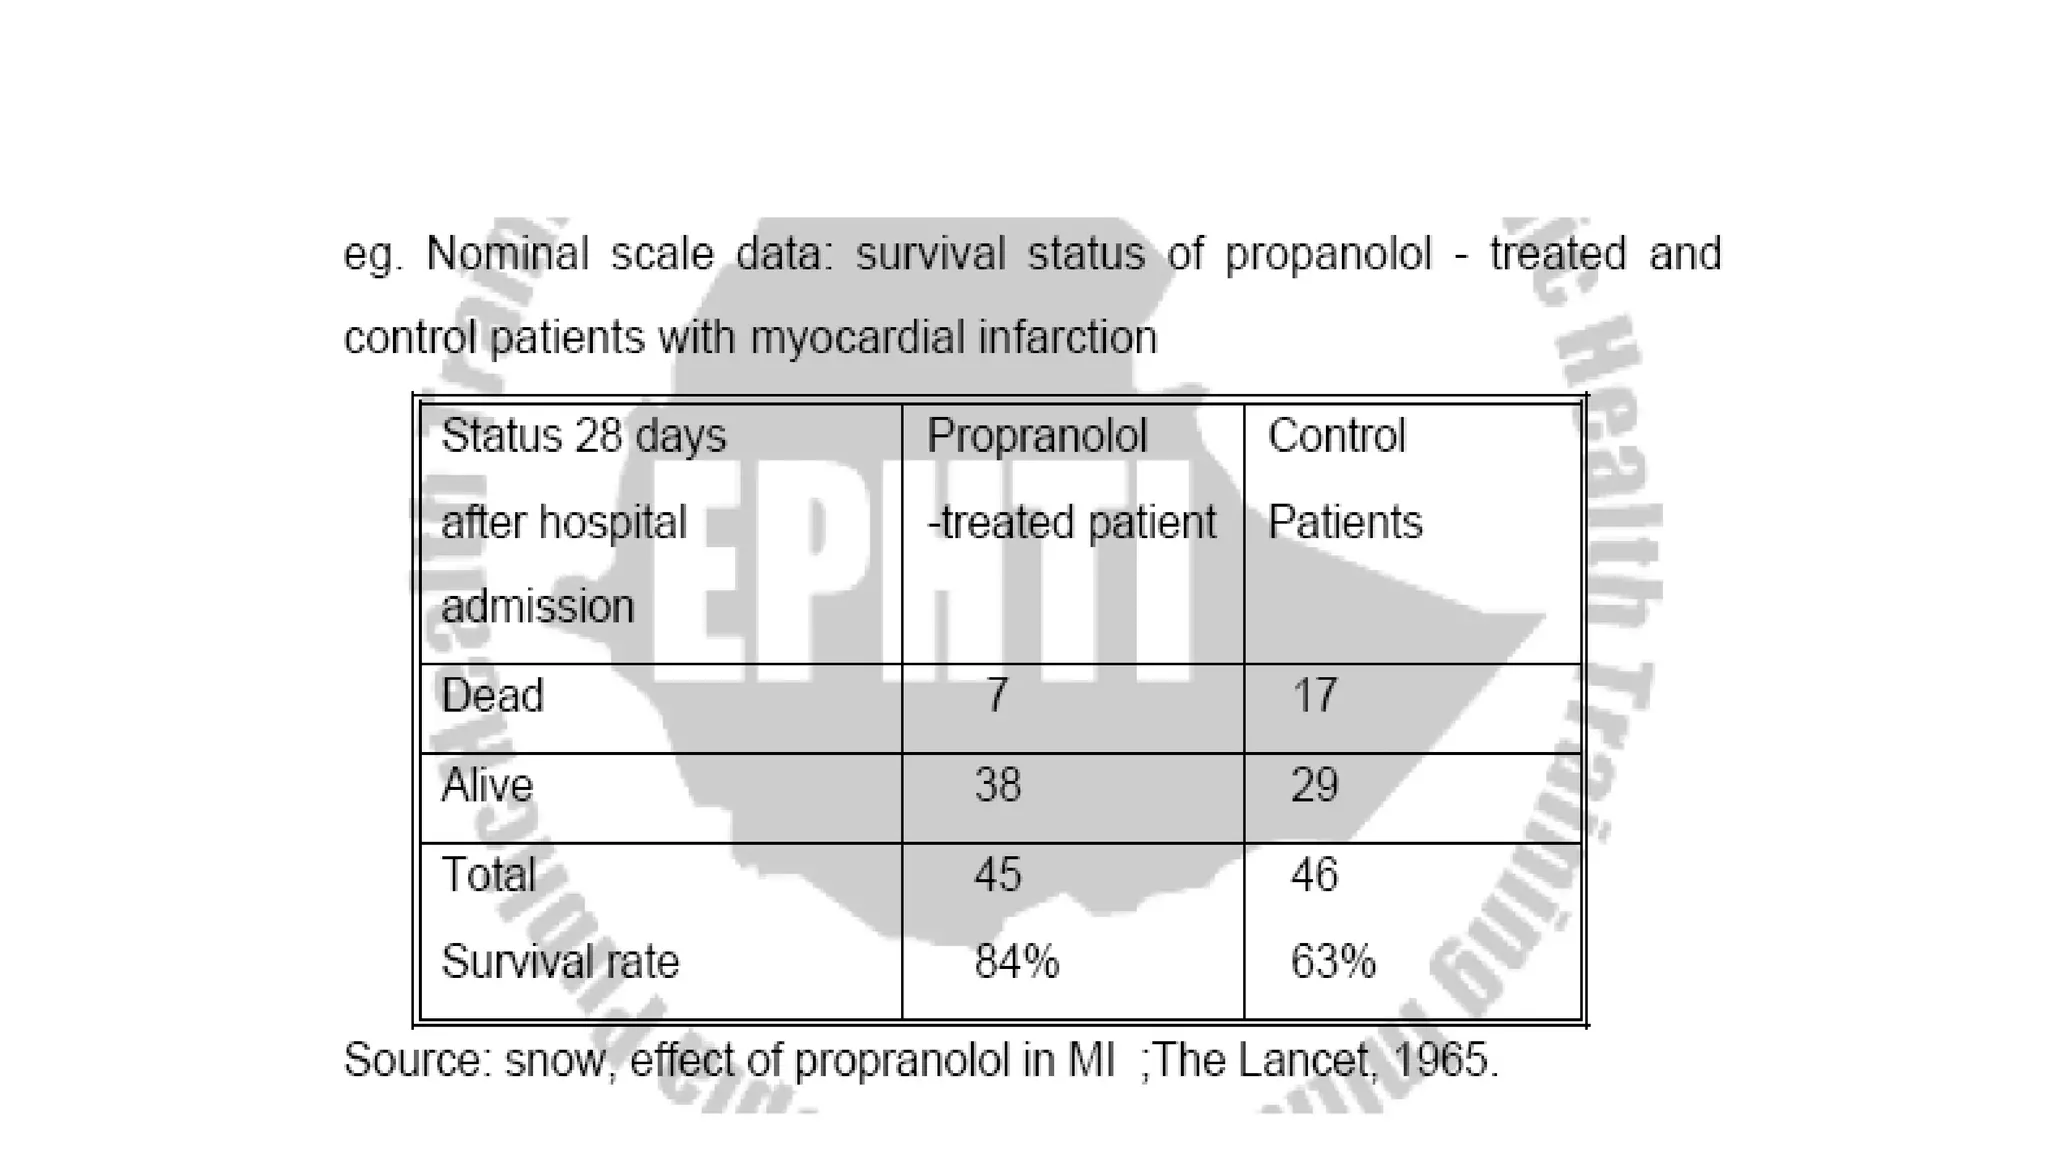
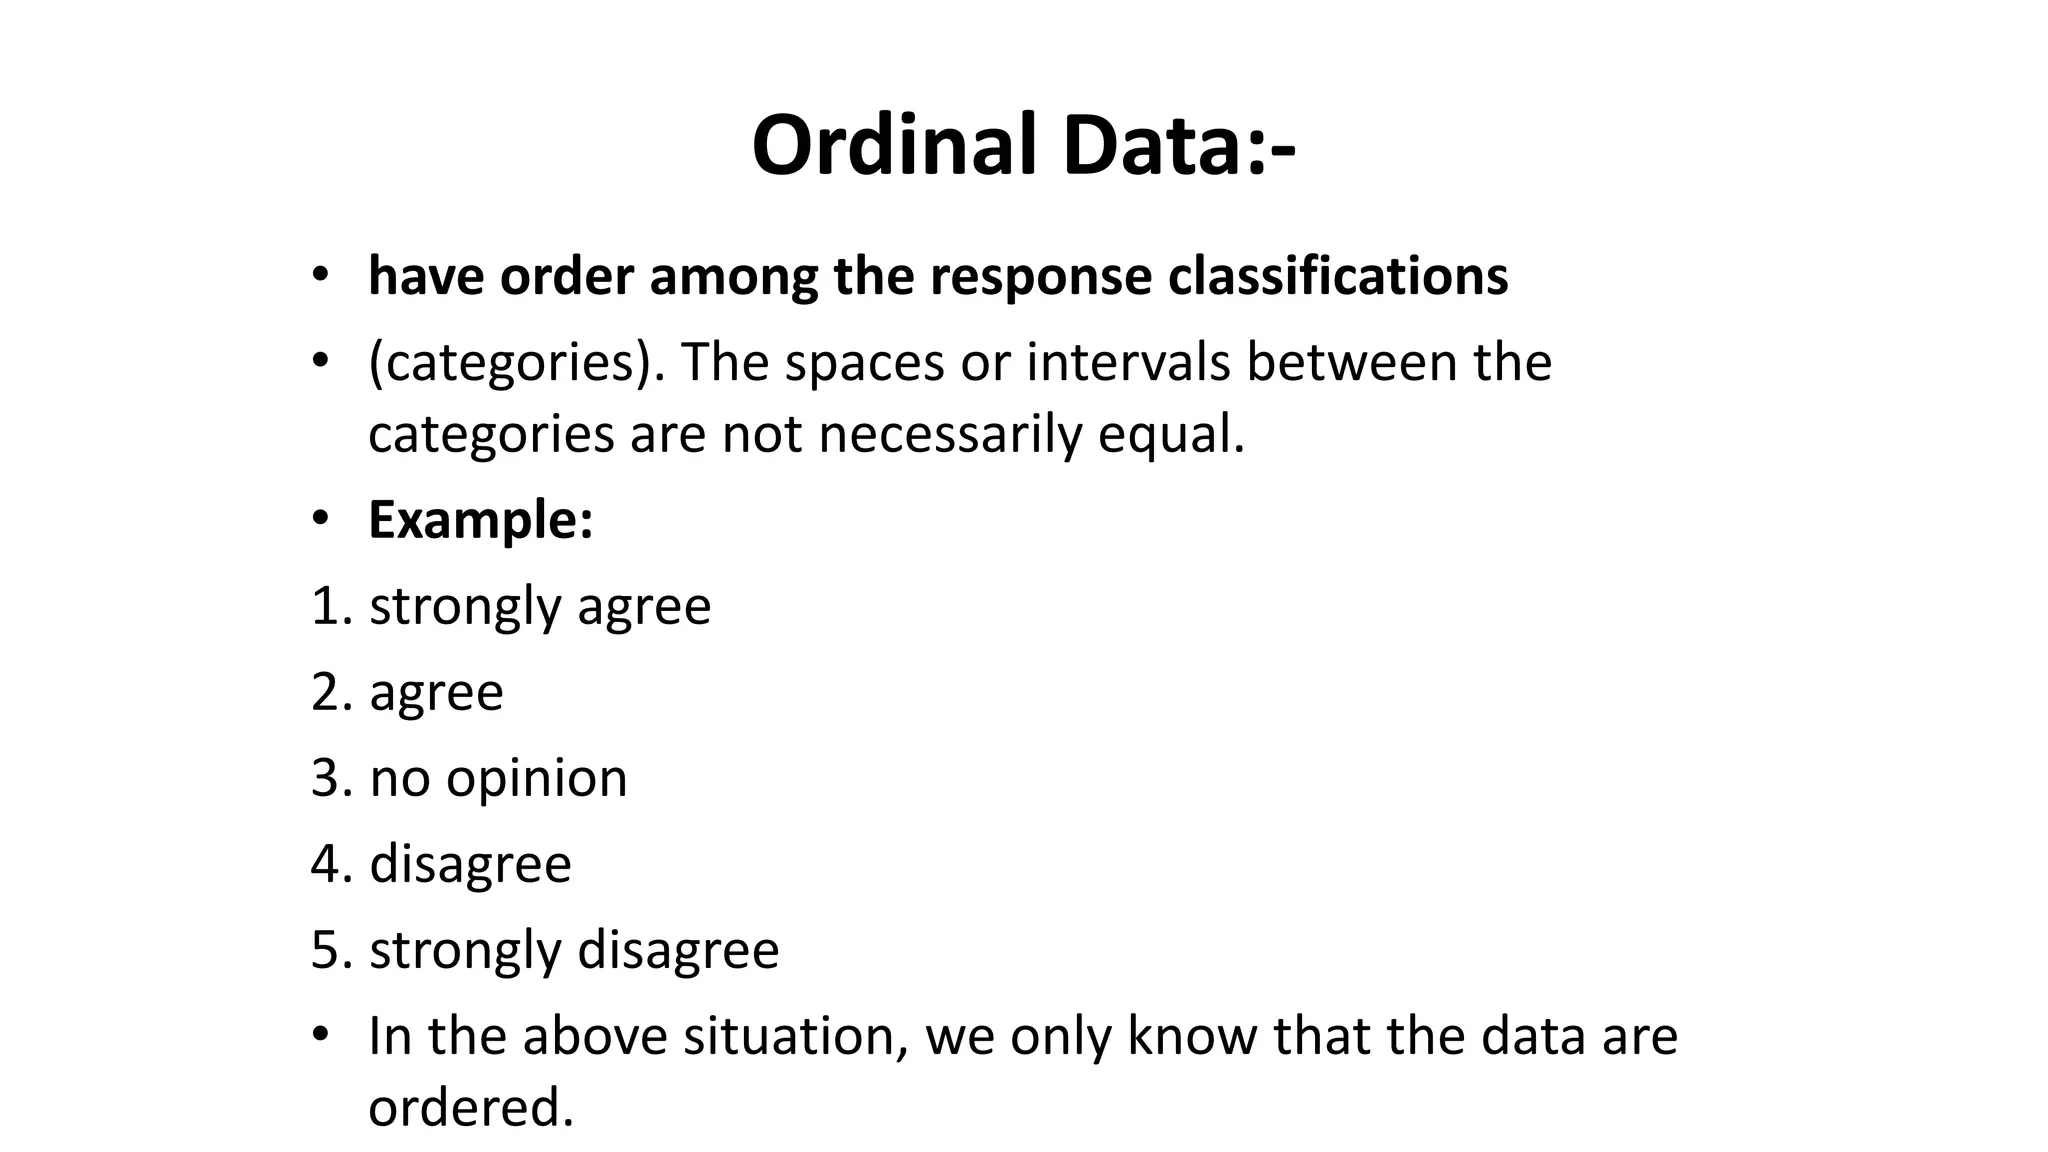
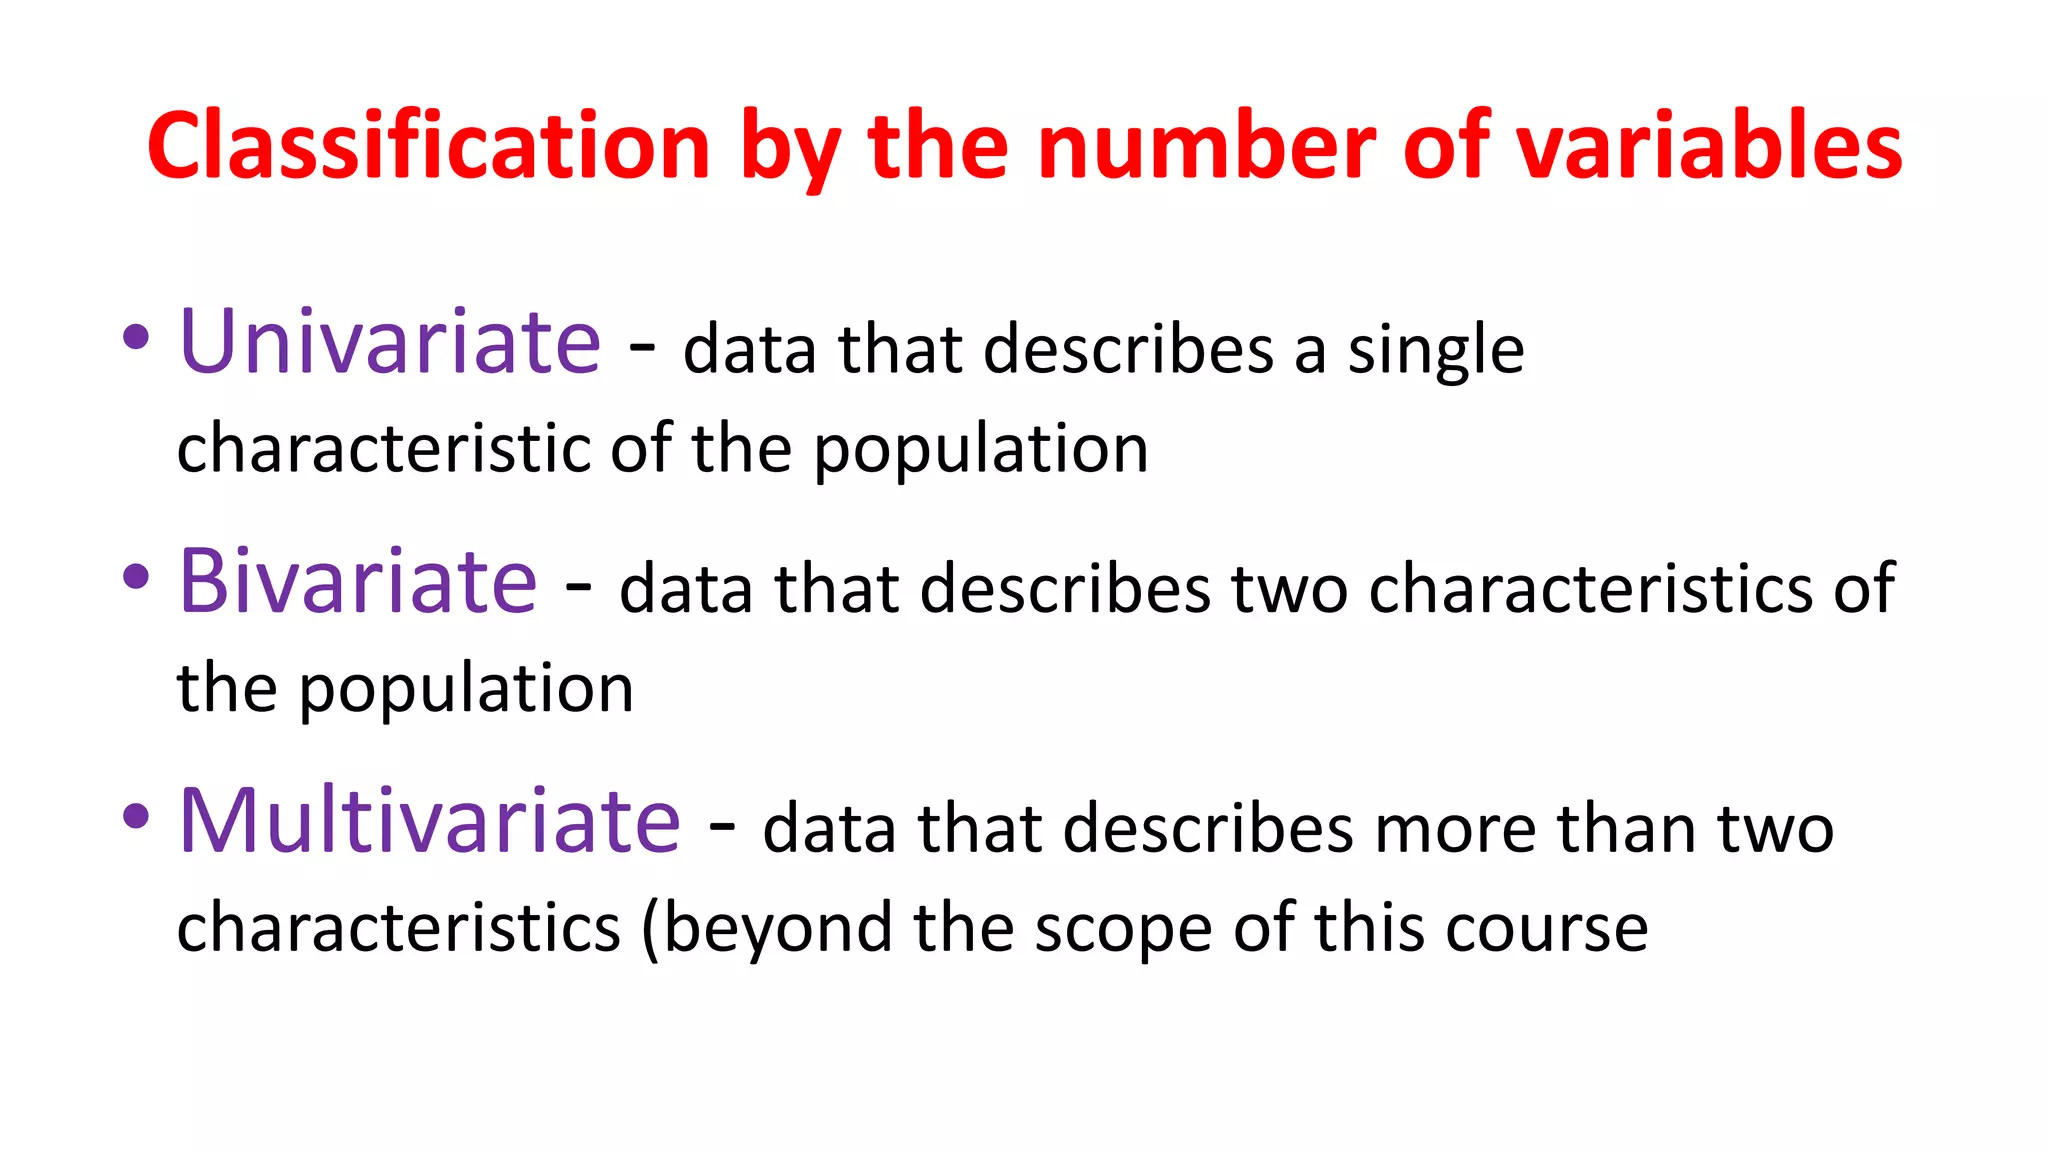
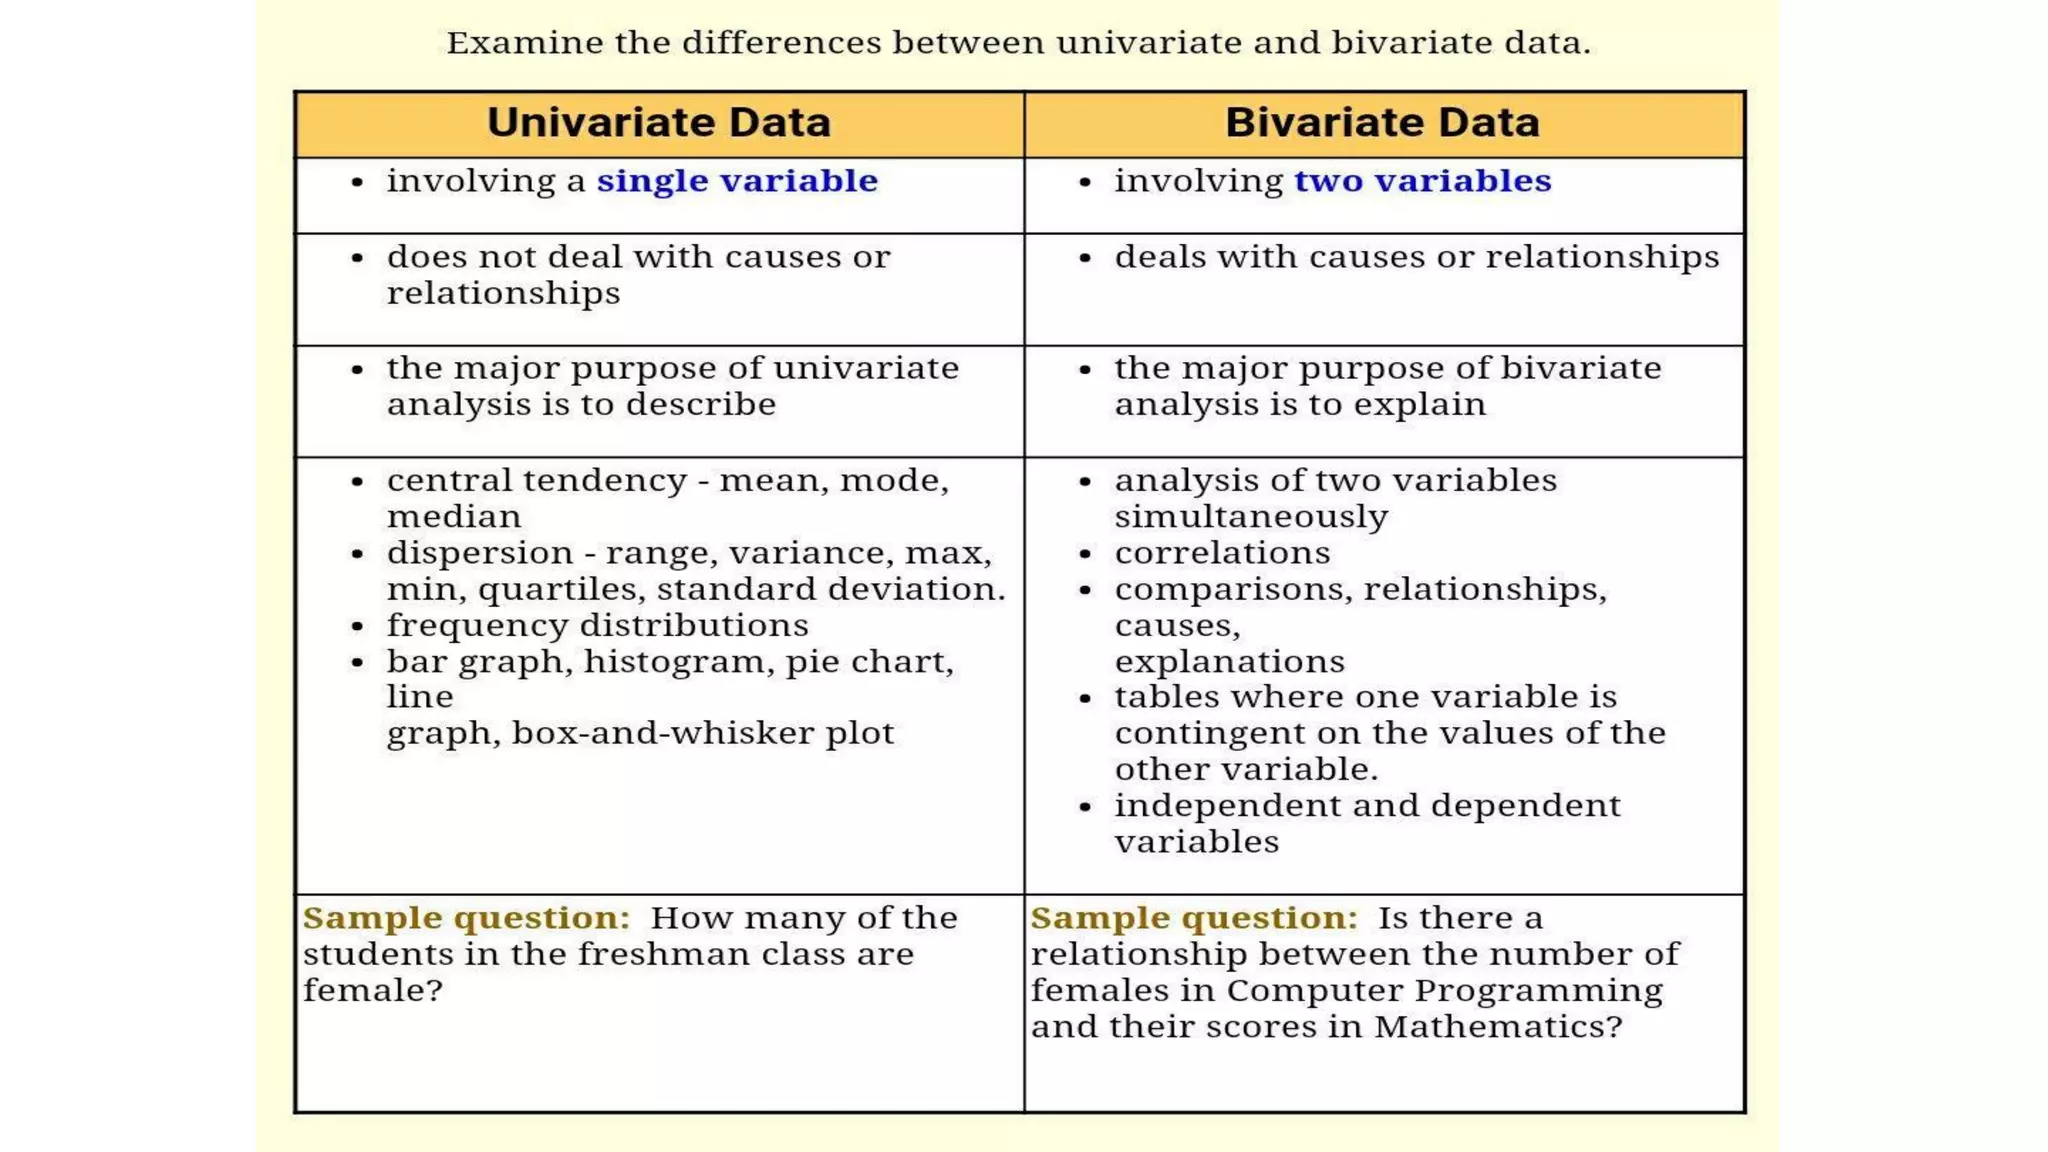
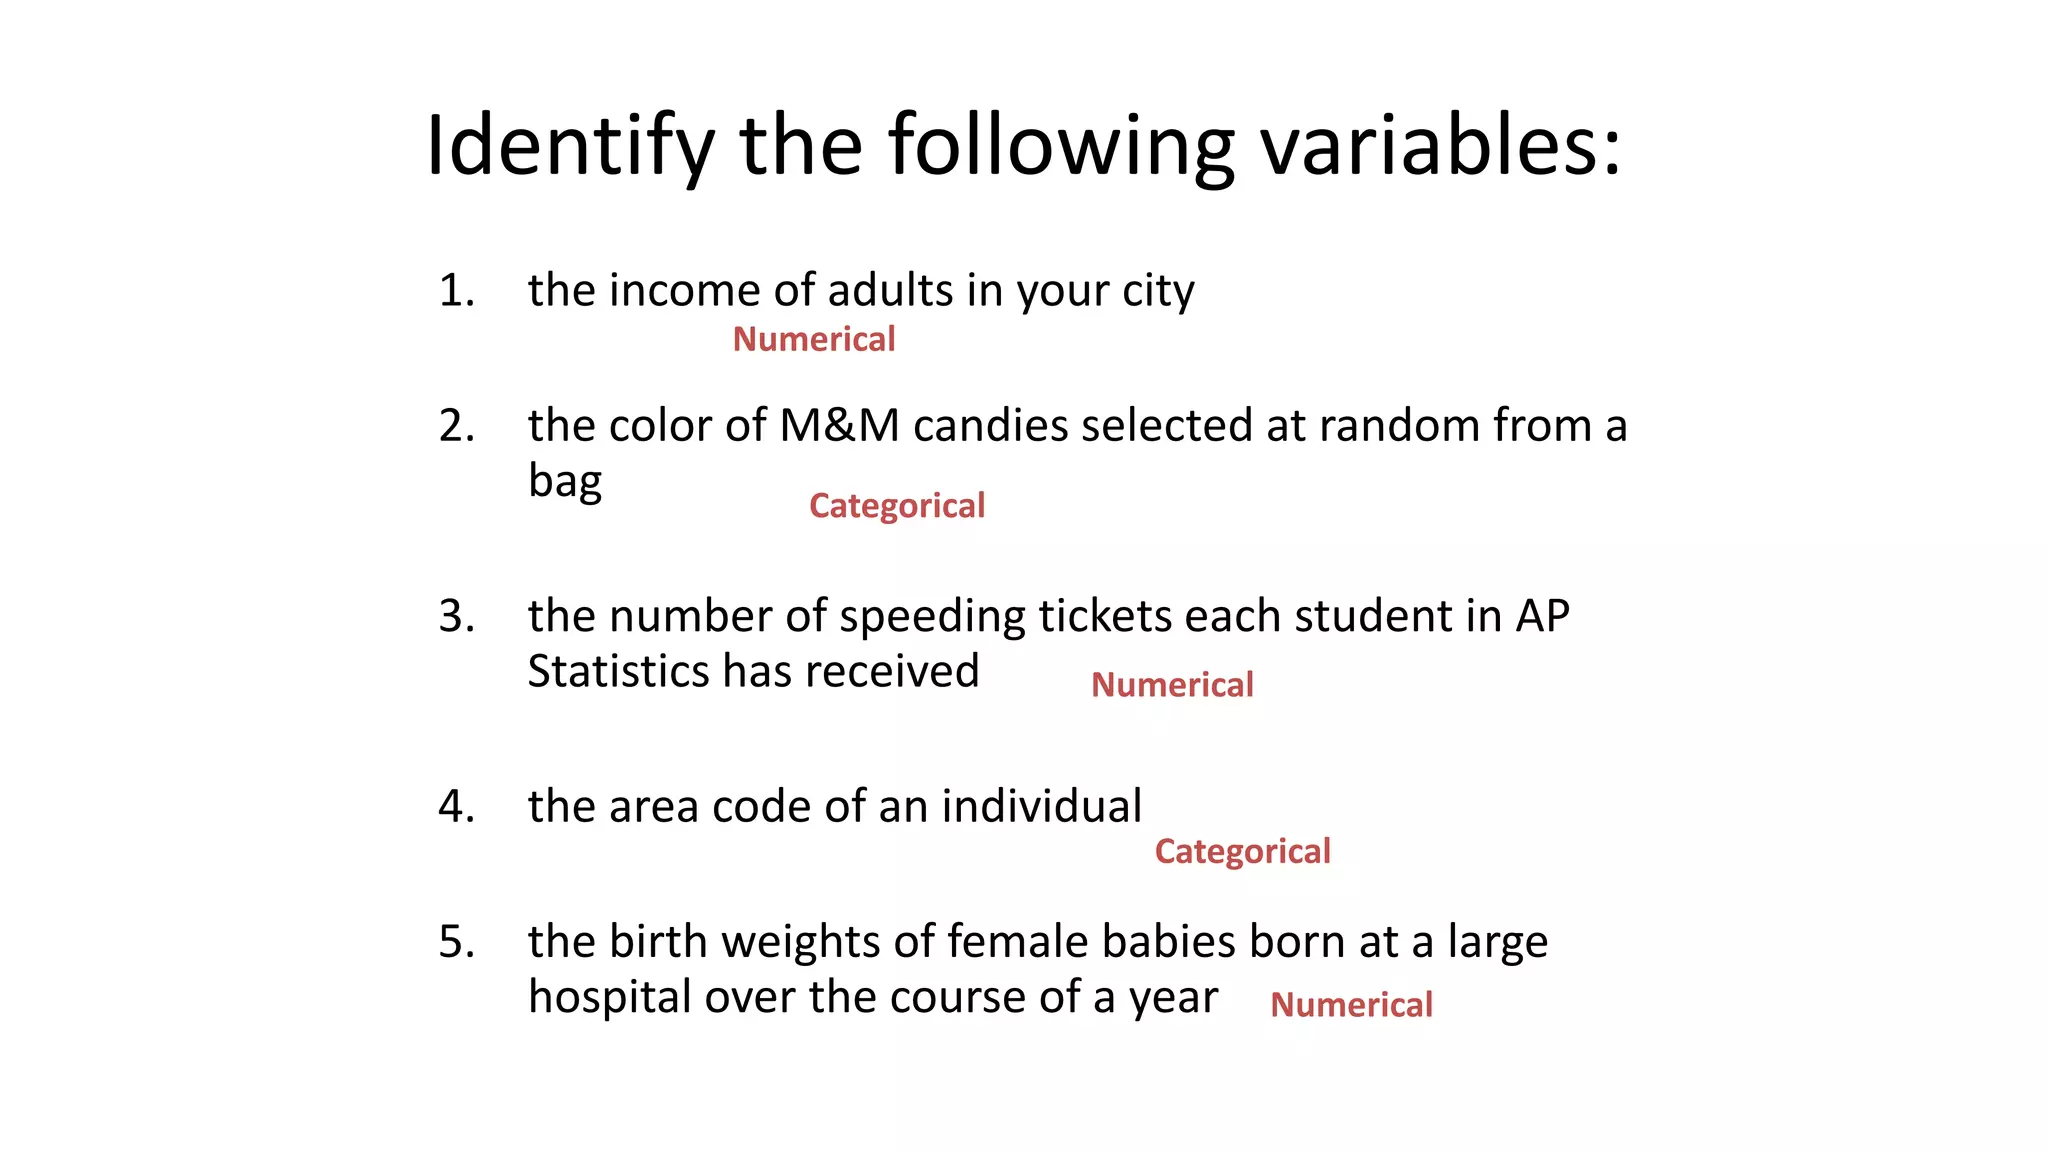
Ravinandan A P
Assistant Professor
Sree Siddaganga College of Pharmacy in association with
Siddaganga Hospital, Tumkur-02
Types of Data
• The term variable means a quality or quantity which varies
from one member of a sample or population to another.
• Systolic blood pressure is a variable, which varies both from
person to person & from measurement to measurement
within the same person.
• Sex is a variable, people being either male or female.
• The collection of observations or measurements on a
variable characteristic defined on the units of a
population or a sample selected from it are called data.
• It is useful to think of data as being of several different types, as
the type of data is important in deciding which methods of
presentation & analysis we should adopt.
• Data can be one of two types:
• Qualitative Data
• Quantitative Data
Qualitative Data:
• Qualitative data arise when individuals may fall into separate
classes, such as diagnosis or sex.
• A qualitative variable is also termed a categorical variable or
a classification variable.
• Qualitative data are discrete in nature such as number of
deaths in different years, population of different towns,
persons with different blood groups in a population, & so on.
• In life sciences, such statistics are mostly collected in
pharmacology to find the action of a drug.
• In clinical practice to test or compare the efficacy of a drug,
vaccine, operation or line of treatment.
• In demography to find births, deaths, still births, etc.
• The results thus obtained are expressed as a ratio, proportion,
percentile or a rate.
Quantitative Data:
• These date are numerical, arising from counts or
measurements.
• Wound area is a quantitative variable, as is the length
of time until the wound heals, & parity, the number
of previous pregnancies which an expectant mother
has had.
• If the values of the measurements can only take a few
separate values, often integers, as does parity, those
data are said to be discrete.
• If the values of the measurements can take any number
in a range, such as wound area, height, or weight, the
data are said to be continuous.
• The quantitative data obtained from characteristic variable are
also called continuous data as each individual has one
measurement from a continuous spectrum or range such as body
temperature from 350C to 420C, height 150 cm to 180 cm, pulse
rate from 68 per minute to 84 per minute and so on.
• The observations ascend or descend from O or any starting point
in the range or spectrum, such as blood pressure of 100
individuals rising from lowest 90mm of Hg to the highest 150 mm
of Hg.
Types of variables
Two kinds of variables:
Qualitative or Attribute or Categorical Variable:
A variable that categorizes or describes an element of a population.
Note: Arithmetic operations, such as addition and averaging, are not
meaningful for data resulting from a qualitative variable.
Second kind of variables is:
Quantitative, or Numerical Variable:
A variable that quantifies an element of a population.
Note: Arithmetic operations such as addition and averaging, are
meaningful for data resulting from a quantitative variable.
Qualitative variable:
• a variable or characteristic which cannot be measured in
quantitative form but can only be identified by name or
categories
• For instance place of birth, ethnic group, type of drug, stages
of breast cancer (I, II, III, or IV), degree of pain (minimal,
moderate, severe or unbearable).
Quantitative variable:
• A quantitative variable is one that can be measured & expressed
numerically.
• They can be of two types:-Discrete or Continuous.
• The values of a discrete variable are usually whole numbers, such
as the number of episodes of diarrhoea in the first five years of
life.
• A continuous variable is a measurement on a continuous scale.
• Ex: weight, height, blood pressure,age, etc.
Categorical variables
• or qualitative
• identifies basic differentiating characteristics of
the population
Numerical variables
• or quantitative
• observations or measurements take on numerical
values
• makes sense to average these values
• two types - discrete & continuous
Discrete (numerical)
• listable set of values
• usually counts of items
Continuous (numerical)
• data can take on any values in the domain of
the variable
• usually measurements of something
Nominal Variable: A qualitative variable that categorizes (or describes, or names)
an element of a population.
Ordinal Variable: A qualitative variable that incorporates an ordered position, or
ranking.
Discrete Variable: A quantitative variable that can assume a countable number of
values. Intuitively, a discrete variable can assume values corresponding to isolated
points along a line interval. That is, there is a gap between any two values.
Continuous Variable: A quantitative variable that can assume an uncountable
number of values. Intuitively, a continuous variable can assume any value along a
line interval, including every possible value between any two values.
Nominal data
• Data that represent categories or names.
• There is no implied order to the categories of nominal data.
• In these types of data, individuals are simply placed in the proper
category or group, & the number in each category is counted.
• Each item must fit into exactly one category.
• Some other examples of nominal data:
✓ Eye color - brown, black, etc.
✓ Religion - Christianity, Islam, Hinduism, etc
✓ Sex - male, female
Ordinal Data:-
• have order among the response classifications
• (categories). The spaces or intervals between the
categories are not necessarily equal.
• Example:
1. strongly agree
2. agree
3. no opinion
4. disagree
5. strongly disagree
• In the above situation, we only know that the data are
ordered.
Interval Data
• In interval data the intervals between values are the same.
• For ex, in the Fahrenheit temperature scale, the difference
between 70 degrees & 71 degrees is the same as the difference
between 32 and 33 degrees.
• But the scale is not a RATIO Scale.
• 40 degrees Fahrenheit is not twice as much as 20 degrees
Fahrenheit.
Ratio Data
• The data values in ratio data do have meaningful ratios
• For ex, age is a ratio data, some one who is 40 is twice as old as
someone who is 20.
Numerical continuous
• The scale with the greatest degree of quantification is a numerical
continuous scale.
• Each observation theoretically falls somewhere along a continuum.
• One is not restricted, in principle, to particular values such as the
integers of the discrete scale.
• The restricting factor is the degree of accuracy of the measuring
instrument most clinical measurements, such as blood pressure,
serum cholesterol level, height, weight, age etc. are on a numerical
continuous scale.
Classification by the number of variables
• Univariate - data that describes a single
characteristic of the population
• Bivariate - data that describes two characteristics of
the population
• Multivariate - data that describes more than two
characteristics (beyond the scope of this course
Identify the following variables:
1. the income of adults in your city
2. the color of M&M candies selected at random from a
bag
3. the number of speeding tickets each student in AP
Statistics has received
4. the area code of an individual
5. the birth weights of female babies born at a large
hospital over the course of a year
Numerical
Numerical
Numerical
Categorical
Categorical
Exercises
• Identify the type of data (nominal, ordinal, interval and ratio) represented by each of the
following. Confirm your answers by giving your own examples.
1. Blood group
2. Temperature (Celsius)
3. Ethnic group
4. Job satisfaction index (1-5)
5. Number of heart attacks
6. Calendar year
7. Serum uric acid (mg/100ml)
8. Number of accidents in 3 - year period
9. Number of cases of each reportable disease reported by a health worker
10. The average weight gain of 6 1-year old dogs (with a special diet supplement) was
950grams last month.
THANK
YOU

Data, Distribution Introduction and Types - Biostatistics - Ravinandan A P.pdf

  • 1.
    Ravinandan A P AssistantProfessor Sree Siddaganga College of Pharmacy in association with Siddaganga Hospital, Tumkur-02
  • 2.
    Types of Data •The term variable means a quality or quantity which varies from one member of a sample or population to another. • Systolic blood pressure is a variable, which varies both from person to person & from measurement to measurement within the same person.
  • 3.
    • Sex isa variable, people being either male or female. • The collection of observations or measurements on a variable characteristic defined on the units of a population or a sample selected from it are called data.
  • 4.
    • It isuseful to think of data as being of several different types, as the type of data is important in deciding which methods of presentation & analysis we should adopt. • Data can be one of two types: • Qualitative Data • Quantitative Data
  • 6.
    Qualitative Data: • Qualitativedata arise when individuals may fall into separate classes, such as diagnosis or sex. • A qualitative variable is also termed a categorical variable or a classification variable. • Qualitative data are discrete in nature such as number of deaths in different years, population of different towns, persons with different blood groups in a population, & so on.
  • 7.
    • In lifesciences, such statistics are mostly collected in pharmacology to find the action of a drug. • In clinical practice to test or compare the efficacy of a drug, vaccine, operation or line of treatment. • In demography to find births, deaths, still births, etc. • The results thus obtained are expressed as a ratio, proportion, percentile or a rate.
  • 8.
    Quantitative Data: • Thesedate are numerical, arising from counts or measurements. • Wound area is a quantitative variable, as is the length of time until the wound heals, & parity, the number of previous pregnancies which an expectant mother has had.
  • 9.
    • If thevalues of the measurements can only take a few separate values, often integers, as does parity, those data are said to be discrete. • If the values of the measurements can take any number in a range, such as wound area, height, or weight, the data are said to be continuous.
  • 10.
    • The quantitativedata obtained from characteristic variable are also called continuous data as each individual has one measurement from a continuous spectrum or range such as body temperature from 350C to 420C, height 150 cm to 180 cm, pulse rate from 68 per minute to 84 per minute and so on. • The observations ascend or descend from O or any starting point in the range or spectrum, such as blood pressure of 100 individuals rising from lowest 90mm of Hg to the highest 150 mm of Hg.
  • 11.
  • 12.
    Two kinds ofvariables: Qualitative or Attribute or Categorical Variable: A variable that categorizes or describes an element of a population. Note: Arithmetic operations, such as addition and averaging, are not meaningful for data resulting from a qualitative variable.
  • 13.
    Second kind ofvariables is: Quantitative, or Numerical Variable: A variable that quantifies an element of a population. Note: Arithmetic operations such as addition and averaging, are meaningful for data resulting from a quantitative variable.
  • 14.
    Qualitative variable: • avariable or characteristic which cannot be measured in quantitative form but can only be identified by name or categories • For instance place of birth, ethnic group, type of drug, stages of breast cancer (I, II, III, or IV), degree of pain (minimal, moderate, severe or unbearable).
  • 15.
    Quantitative variable: • Aquantitative variable is one that can be measured & expressed numerically. • They can be of two types:-Discrete or Continuous. • The values of a discrete variable are usually whole numbers, such as the number of episodes of diarrhoea in the first five years of life. • A continuous variable is a measurement on a continuous scale. • Ex: weight, height, blood pressure,age, etc.
  • 16.
    Categorical variables • orqualitative • identifies basic differentiating characteristics of the population
  • 17.
    Numerical variables • orquantitative • observations or measurements take on numerical values • makes sense to average these values • two types - discrete & continuous
  • 18.
    Discrete (numerical) • listableset of values • usually counts of items
  • 19.
    Continuous (numerical) • datacan take on any values in the domain of the variable • usually measurements of something
  • 20.
    Nominal Variable: Aqualitative variable that categorizes (or describes, or names) an element of a population. Ordinal Variable: A qualitative variable that incorporates an ordered position, or ranking. Discrete Variable: A quantitative variable that can assume a countable number of values. Intuitively, a discrete variable can assume values corresponding to isolated points along a line interval. That is, there is a gap between any two values. Continuous Variable: A quantitative variable that can assume an uncountable number of values. Intuitively, a continuous variable can assume any value along a line interval, including every possible value between any two values.
  • 24.
    Nominal data • Datathat represent categories or names. • There is no implied order to the categories of nominal data. • In these types of data, individuals are simply placed in the proper category or group, & the number in each category is counted. • Each item must fit into exactly one category. • Some other examples of nominal data: ✓ Eye color - brown, black, etc. ✓ Religion - Christianity, Islam, Hinduism, etc ✓ Sex - male, female
  • 28.
    Ordinal Data:- • haveorder among the response classifications • (categories). The spaces or intervals between the categories are not necessarily equal. • Example: 1. strongly agree 2. agree 3. no opinion 4. disagree 5. strongly disagree • In the above situation, we only know that the data are ordered.
  • 29.
    Interval Data • Ininterval data the intervals between values are the same. • For ex, in the Fahrenheit temperature scale, the difference between 70 degrees & 71 degrees is the same as the difference between 32 and 33 degrees. • But the scale is not a RATIO Scale. • 40 degrees Fahrenheit is not twice as much as 20 degrees Fahrenheit.
  • 30.
    Ratio Data • Thedata values in ratio data do have meaningful ratios • For ex, age is a ratio data, some one who is 40 is twice as old as someone who is 20.
  • 31.
    Numerical continuous • Thescale with the greatest degree of quantification is a numerical continuous scale. • Each observation theoretically falls somewhere along a continuum. • One is not restricted, in principle, to particular values such as the integers of the discrete scale. • The restricting factor is the degree of accuracy of the measuring instrument most clinical measurements, such as blood pressure, serum cholesterol level, height, weight, age etc. are on a numerical continuous scale.
  • 32.
    Classification by thenumber of variables • Univariate - data that describes a single characteristic of the population • Bivariate - data that describes two characteristics of the population • Multivariate - data that describes more than two characteristics (beyond the scope of this course
  • 34.
    Identify the followingvariables: 1. the income of adults in your city 2. the color of M&M candies selected at random from a bag 3. the number of speeding tickets each student in AP Statistics has received 4. the area code of an individual 5. the birth weights of female babies born at a large hospital over the course of a year Numerical Numerical Numerical Categorical Categorical
  • 35.
    Exercises • Identify thetype of data (nominal, ordinal, interval and ratio) represented by each of the following. Confirm your answers by giving your own examples. 1. Blood group 2. Temperature (Celsius) 3. Ethnic group 4. Job satisfaction index (1-5) 5. Number of heart attacks 6. Calendar year 7. Serum uric acid (mg/100ml) 8. Number of accidents in 3 - year period 9. Number of cases of each reportable disease reported by a health worker 10. The average weight gain of 6 1-year old dogs (with a special diet supplement) was 950grams last month.
  • 36.