Nepse Technical Analysis January 31 - February 4, 2016
•
0 likes•243 views

Nepse Weekly Technical Analysis January 31 - February 4, 2016

Recommended
Recommended
More Related Content
What's hot
What's hot (20)
Viewers also liked
Viewers also liked (12)
Similar to Nepse Technical Analysis January 31 - February 4, 2016
Similar to Nepse Technical Analysis January 31 - February 4, 2016 (11)
More from Kriti Capital & Investments Ltd.
More from Kriti Capital & Investments Ltd. (17)
Recently uploaded
Recently uploaded (20)
Nepse Technical Analysis January 31 - February 4, 2016
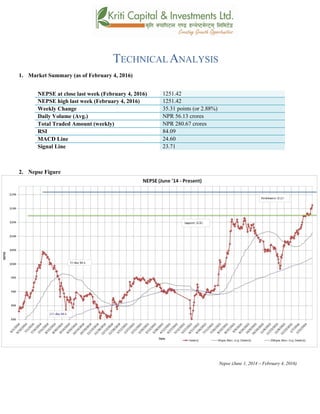
- 1. TECHNICAL ANALYSIS 1. Market Summary (as of February 4, 2016) NEPSE at close last week (February 4, 2016) 1251.42 NEPSE high last week (February 4, 2016) 1251.42 Weekly Change 35.31 points (or 2.88%) Daily Volume (Avg.) NPR 56.13 crores Total Traded Amount (weekly) NPR 280.67 crores RSI 84.09 MACD Line 24.60 Signal Line 23.71 2. Nepse Figure Nepse (June 1, 2014 – February 4, 2016)
- 2. 3. Trend Analysis The benchmark index broke all records by creating a new high everyday last week. Nepse made an incredible gain of 35.31 points (or up 2.88%) to close at 1251.42. Investors seem to gain confidence over the slow improvements in the political and economic condition of the country. The surprisingly high Q2 profits of the BFIs, despite slow economic recovery, have triggered a bullish sentiment. The index is moving well above the 50-day and 200-day moving average, indicating that the long term market movement looks positive. Nonetheless, Nepse will likely correct itself next week. 4. Resistance and Support Immediate Support 1216 Support 2 1170 Immediate Resistance 1320 Resistance 2 1240 The Nepse index tested the immediate resistance level of 1240 on Tuesday of last week. The bullish rise in the market has caused the index to cross above that resistance level and created a new height of 1251.42 by the end of the week. Currently, the new immediate resistance level stands at 1320, and the immediate support level stands at 1216. All of the technical indicators, apart from the RSI, indicate that the market is in a bullish run. 5. Trend Indicator a.) MACD The MACD is a momentum oscillator formed by using two different types of moving averages, which provides specific buying or selling signals. When a MACD line crosses above the signal line, it is considered to be a positive sign and indicates a time to buy, and vice-versa. The macd line fell below the signal line on Sunday last week. However, the bullish sentiment in the market caused the macd line to cross above the signal line for the rest of the week. Such movement shows that the market will likely climb further up. The macd and the signal line, at the beginning of the week, stood at 22.73 and 23.23 respectively. Not much change was seen in either of the lines. By the end of the week, macd and signal line stood at 24.60 and 23.71 respectively.
- 3. b.) RSI RSI is a form of leading indicator that is believed to be most effective during periods of sideways movement. Such indicators may create numerous buy and sell signals that are useful when the market is not clearly trending upwards or downwards. The RSI, at the beginning of the week, stood at 76.29 level. Such levels indicate high buying pressure in the market. Surprisingly, the Nepse index climbed further up, suggesting that the market remains bullish despite being in an over-bought condition. The RSI gained 7.80 points to end at 84.09 level. c.) Bollinger Bands The Bollinger Band is a technical indicator that consists of a moving average (21-day) along with two trading bands above (upper band) and below it (lower band). The bands are an indication of volatility, which are represented by calculating standard deviation. The benchmark index moved closer towards the upper band again despite being in an over-bought condition. All of the Bollinger bands are moving upwards, indicating that the market is bullish. The distance between the upper and lower band remain wide, signifying the presence of market volatility.
- 4. 6. Volume Indicator (On-Balance Volume) On-Balance Volume (OBV) is a momentum indicator that relates volume to the current price of the index or security. It measures buying and selling pressure at the market. It acts as a cumulative indicator that adds volume on up days and subtracts volume on down days. If a price increase is supported by OBV, it confirms an uptrend, whereas if a price decrease is supported by OBV, it confirms a downtrend. Both the On-Balance Volume (OBV) and the Nepse index climbed up in the course of last week, supporting the bullish momentum in the market. The volume continues to increase as Nepse reaches new height. The average weekly volume transactions increased significantly to NPR 56.13 crores from NPR 43.76 crores the week prior. The total volume transaction at the last trading day stood at 70.92 crores, which is the highest in the last five months. 7. Overview The Nepse index gained 35.31 points (or up 2.88%) to close at 1251.42. The 50-day and 200-day moving average continue to climb up, indicating that the overall market condition looks good. The RSI continues to signal high buying pressure in the market as it is hovering above the 80 level. The macd line climbed above the signal line last week. The macd and the signal line ended at 24.60 and 23.71 respectively, indicating that the market at present is still bullish. The Bollinger bands continue to show presence of market volatility. The new support and resistance level now stands at 1216 and 1320 respectively.
- 5. k|fljlwsljZn]if0f !_ahf/ ;f/f+z -df3@!, @)&@ ;Ddsf]_ aGb cªs -df3@!, @)&@_ !@%!=$@ pRr cªs -uPsf] ;ftf_ !@%!=$@ ;fKtflxs kl/jt{g #%=#! -@=**k|ltzt_ b}lgscf};t Jofkf/ ¿=%^=!#s/f]8 s'n ;fKtflxsJofkf/ ¿ @*)=^& s/f]8 cf/P;cfO{ *$=)( PdP;L8L @$=^) l;UgnnfO{g @#=&! @_ ahf/ k|j[lt Nepse (June 1, 2014 – February 4, 2016)
- 6. #_ 6]«G8 ljZn]if0f uPsf] ;ftf g]K;] kl/;"rsn] cfkmgf] O{ltxf;s} ;a} /]s8{x? tf]8g ;kmneof] . kl/;"rsdf #%=#!cªssf] 7"nf]a[l4 b]lvof] . /fhgLltstxdf b]lvPsf] ;'wf/ tyfcj/f]w ePsf] gfsfx? km]l/ ;'rf? x'Fb} uPsf] cj:yfn] km]l/ ahf/nfO{ dfly p7fPsf] 5 . ;fy} a}+s tyfljQLo ;+:yf bf];|f] q}dfl;sljj/0fn] klg km]l/ nufgLstf{x? dfem s]xLpT;fxylkPsf] 5 . clxn] klg kl/;"rs %) lbg] d'leËPe/]h tyf @)) lbg] d'leËeGbfdfly g} rln/x]sf] cj:yf ;du|dfahf/sf] l:ylt /fd|f] b]lvG5 / cfufdL ;ftf g]K;] kl/;"rsdf s]xL s/]S;gx'g] ;+Defjgfeg] b]lvG5 . $_ 6]jftyfk|lt/f]w cªs glhssf] 6]jfcªs !@!^ 6]jfcªs @ !!&) glhssf] k|lt/f]w cªs !#$) uPsf] ;ftf g]K;] kl/;"rsn] cfkmgf] glhssf] k|lt/f]w cªsnfO{ ;d]t kf/ u/]sf] cj:yf /xof] . ahf/df b]lvPsf] a'lnz 6]«G8df g]K;]n] cfkmgf] gofFprfO{ ;d]t agfPsf] 5 . xfnglhsf] 6]jfcªstyfk|lt/f]w cªss|dzM !@!^ tyf !#@) /x]sf] 5 / eg] w]/} h;f] ljZn]if0fn] ;d]t ahf/ a'lnz 6]«G8df uO{/x]sf] ;+s]t ub{5 . %_ g]K;] 6]«G8 ;"rs s_ d'leª Pe/]hsGeh]{G; 8fOeh]{G; -PdP;L8L_ PdP;L8Ldf b'O{ cf]6f /]vf x'G5g, h;df Pp6fn] ahf/sf] lbzf kl/jt{gsf] ;+s]t u5{ eg] csf]{n] ahf/sf] k|j[lQ -6«]08_ b]vfpg] u5{ . olb PdP;L8L /]vfn] l;Ung /]vfnfO{ tnaf6 dfly sf6]dfo;nfO{ ;sf/fTds ;+s]tsf ?kdflnO{G5 / o;n] z]o/x? lsGg] ;+s]t ub{5 . uPsf] ;ftfsf] z'?df PdP;L8L nfO{g l;UgnnfO{g eGbftnem/]sf] cj:yf /xof] t/ ;ftfsf] afFsLsf] lbgx?dfTof] dflycfPsf] l:ylt lyof] h;n] ahf/ cem} dflyhfg ;Sg] cj:yf /x]sf] ;+s]t ub{5 . ;ftfsf] z?df PdP;L8L nfO{g tyfl;UgnnfO{g s|dzM@@=&#tyf@#=@# /x]sf] lyof]h;dfvf;} kl/jt{g b]lvPg / ;ftfsf] cGTodfPdP;L8L tyfl;UgnnfO{g s|dzM @$=^) tyf @#=&!cªssf] l:yltdf /xgk'Uof] .
- 7. v_ l/n]l6j :6«]Gy OG8]S; -cf/P;cfO{_ cf/P;cfO{ k|fljlwsljZn]if0fsf] o:tf] cf}hf/ xf], h;nfO{ Pstlkm{ ?kdfrln/x]sf] ahf/dfJofkf/ /0fgLlt agfpg a9L pkof]uL dflgG5 . To;}u/L, o;n] ahf/dfvl/b / ljlqmsf] :ki6 ;+s]t b]vfpg] u5{ . uPsf] ;ftfklgcf/P;cfO{n] ahf/dflsGg] xf]8afhL lgs} /x]sf] ;+s]t u/of] . ;ftfsf] z'?df&^=@(cªsdf /x]sf] cf/P;cfO{ afFsLsflbgx?df ;d]t a9g uof] . lsGg] xf]8afhLdf /x]sf] ahf/ ;ftfsf] cGTodfcf/P; cfO{ &=*) cªsn] a9L *$=)( cªsdf /xguof] . u_ af]lnªu/ Aof08 af]lnªu/ Aof08 Ps k|fljlwsljZn]if0f ;"rsxf] h;df @!–lbg] d'leËPe/]hsf ;fyb'O{ Aof08 -Pp6f dfly_ / Pp6f tn_ x'G5g . lo Aof08x?n] cl:y/tfsf] ;+s]t ub{5g, h'g :6fG88{ 8]leP;g u0fgf u/]/ kQfnufO{G5 . g]K;] kl/;"rsuPsf] ;ftflsGg] xf]8afhL ePklgpkNnf] Jof08 ;Fu} k'u]sf] cj:yfn] ahf/ xfnsf] cj:yfdfa'lnz /x]sf] ;+s]t ub{5 . ;fy} pkNnf] tyftNnf] Jof08 aLr a9]sf] b'/Ln] ahf/dfcl:yt/tfcem} sfod /x]sf] ;+s]t ub{5 .
- 8. ;du{dfM uPsf] ;ftf g]K;] kl/;"rsdf#%=#! cªssf] 7'nf] a[l4 b]lvof] h;sf] kmn:j?k kl/;"rs!@%!=$@cªsdfaGbeof] . clxn]klgkl/;"rs %) lbg] d'leËPe/]htyf @)) lbg] d'leËeGbfdflyuO{/x]sf] cj:yfn] ahf/ ;sf/fTds l:yltdf g} /x]sf] ;+s]t ub{5 .*) cªssf] xf/fxf/Ldfrln/x]sf] cf/P;cfO{n] clxn] klgahf/ cf]e/a6 l:yltdf /x]sf] ;+s]t ub{5 . ;fy}s|dzM @$=^) tyf @#=&! Dff /x]sf] PdP;L8L nfO{g tyfl;UgnnfO{gn] ;d]t ahf/ a'lnz l:yltdf g} /x]sf] ;+s]t ub{5 . xfnsf] cj:yfdfgofF 6]jfcªstyfk|lt/f]w cªs s||dzM !@!^ tyf !#@) /x]sf] 5 .