Weekly technical analysis of Nepse Apr 20 to Apr 25 2014
•
0 likes•176 views

Weekly Technical Analysis of Nepse index for week Apr 20 to Apr 25 2014

Recommended
Recommended
More Related Content
Viewers also liked
Viewers also liked (7)
Similar to Weekly technical analysis of Nepse Apr 20 to Apr 25 2014
Similar to Weekly technical analysis of Nepse Apr 20 to Apr 25 2014 (20)
More from Kriti Capital & Investments Ltd.
More from Kriti Capital & Investments Ltd. (20)
Recently uploaded
Recently uploaded (20)
Weekly technical analysis of Nepse Apr 20 to Apr 25 2014
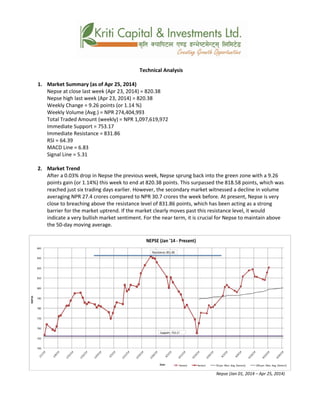
- 1. Technical Analysis 1. Market Summary (as of Apr 25, 2014) Nepse at close last week (Apr 23, 2014) = 820.38 Nepse high last week (Apr 23, 2014) = 820.38 Weekly Change = 9.26 points (or 1.14 %) Weekly Volume (Avg.) = NPR 274,404,993 Total Traded Amount (weekly) = NPR 1,097,619,972 Immediate Support = 753.17 Immediate Resistance = 831.86 RSI = 64.39 MACD Line = 6.83 Signal Line = 5.31 2. Market Trend After a 0.03% drop in Nepse the previous week, Nepse sprung back into the green zone with a 9.26 points gain (or 1.14%) this week to end at 820.38 points. This surpassed the 818.58 points, which was reached just six trading days earlier. However, the secondary market witnessed a decline in volume averaging NPR 27.4 crores compared to NPR 30.7 crores the week before. At present, Nepse is very close to breaching above the resistance level of 831.86 points, which has been acting as a strong barrier for the market uptrend. If the market clearly moves past this resistance level, it would indicate a very bullish market sentiment. For the near term, it is crucial for Nepse to maintain above the 50-day moving average. Nepse (Jan 01, 2014 – Apr 25, 2014)
- 2. 3. RSI RSI is a form of leading indicator that is believed to be most effective during periods of sideways movement. Such indicators may create numerous buy and sell signals that are useful when the market is not clearly trending upwards or downwards. With the rise in Nepse, the RSI indicator also made a slight jump to 64.39 levels, which is an increase of 4.86 points from the previous week. This can be attributed to a minor increase in buying during the last two days of the trading week. Though there is still a possibility for upward momentum, Nepse is getting close to reaching the overbought zone. RSI (Jan 01, 2013 – Apr 25, 2014) 4. MACD The MACD is a momentum oscillator formed by using two different types of moving averages, which provides specific buying or selling signals. When a MACD line crosses above the signal line, it is considered to be a positive sign and indicates a time to buy, and vice-versa. This past week, the MACD line and Signal line both increased to 6.83 points and 5.31 points from 6.39 points and 3.78 points respectively. This oscillator still indicates a positive bullish trend as the MACD line and Signal line are both keeping up with the upward momentum however at a slower pace. MACD (Jan 01, 2013 – Apr 25, 2014) 5. Bollinger Band The Bollinger Band is a technical indicator that consists of a moving average (21-day) along with two trading bands above (upper band) and below it (lower band). The bands are an indication of volatility, which are represented by calculating standard deviation. Nepse retraced slightly this week from the upper band; however, it began climbing back up during the last two trading days. Though this indicates a slight overbought scenario, it also represents a rising momentum.
- 3. OBV (Nov 04, 2013 – Apr 25, 2014) Overview: The stock market recovered this past week as Nepse gained 9.26 points (or 1.14 %) to end on a positive note. The total market volume declined to NPR 1.10 billion this week, as investors seem to be in a wait-and-see mode. However, there has been high demand for life-insurance stocks in the past few months due to superior dividend declaration. The RSI increased slightly by 4.86 points pushing it closer to the overbought zone. The MACD oscillator indicates that the momentum is in the upward direction, whoever, at a slower rate. The Bollinger Bands represent a slightly overbought scenario with increasing momentum in the near term. All these indicators suggest a fairly neutral market with minor volatility. If Nepse manages to shoot past the resistance level of 831.86 points, this would suggest a bullish scenario for the market.