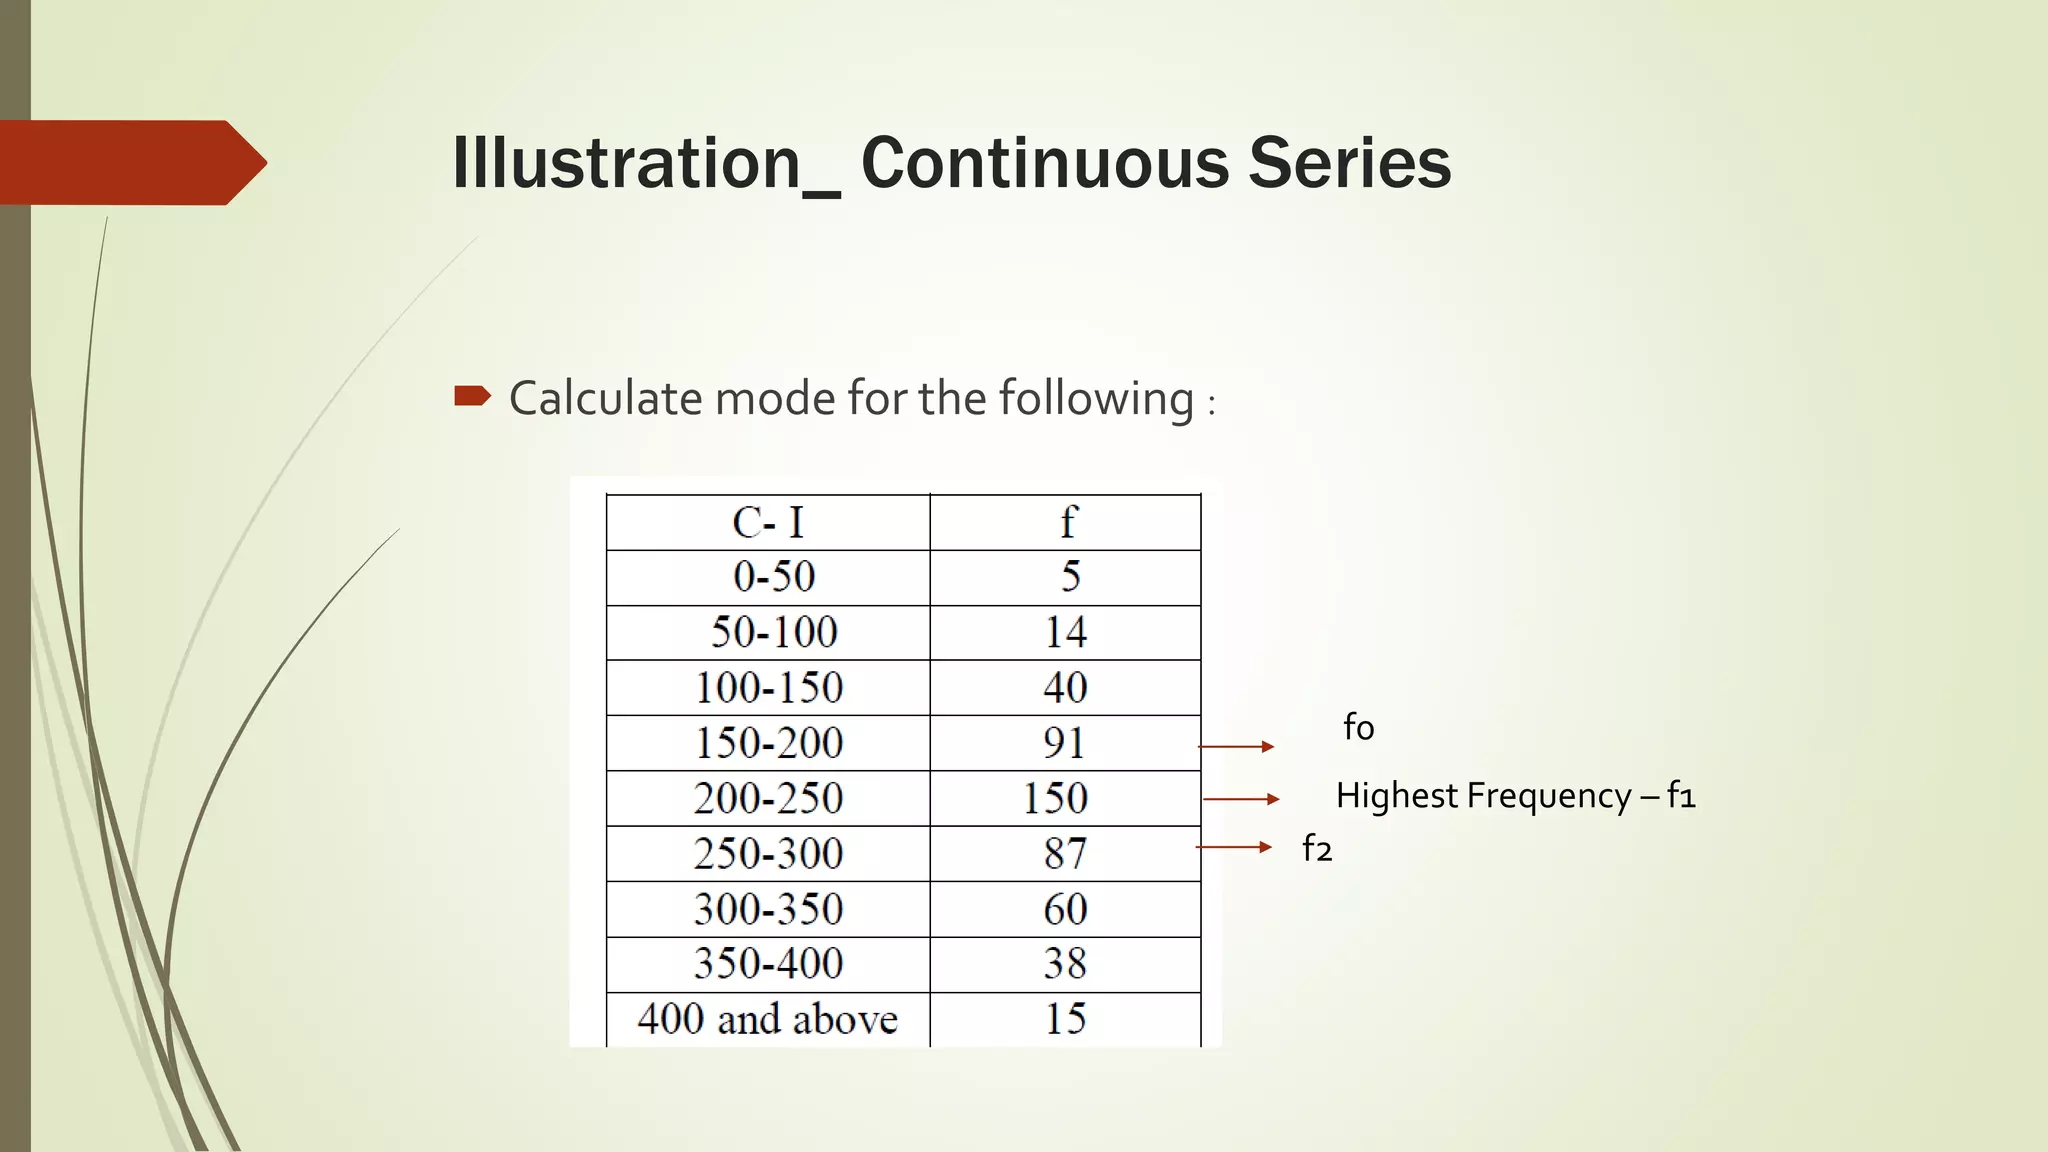
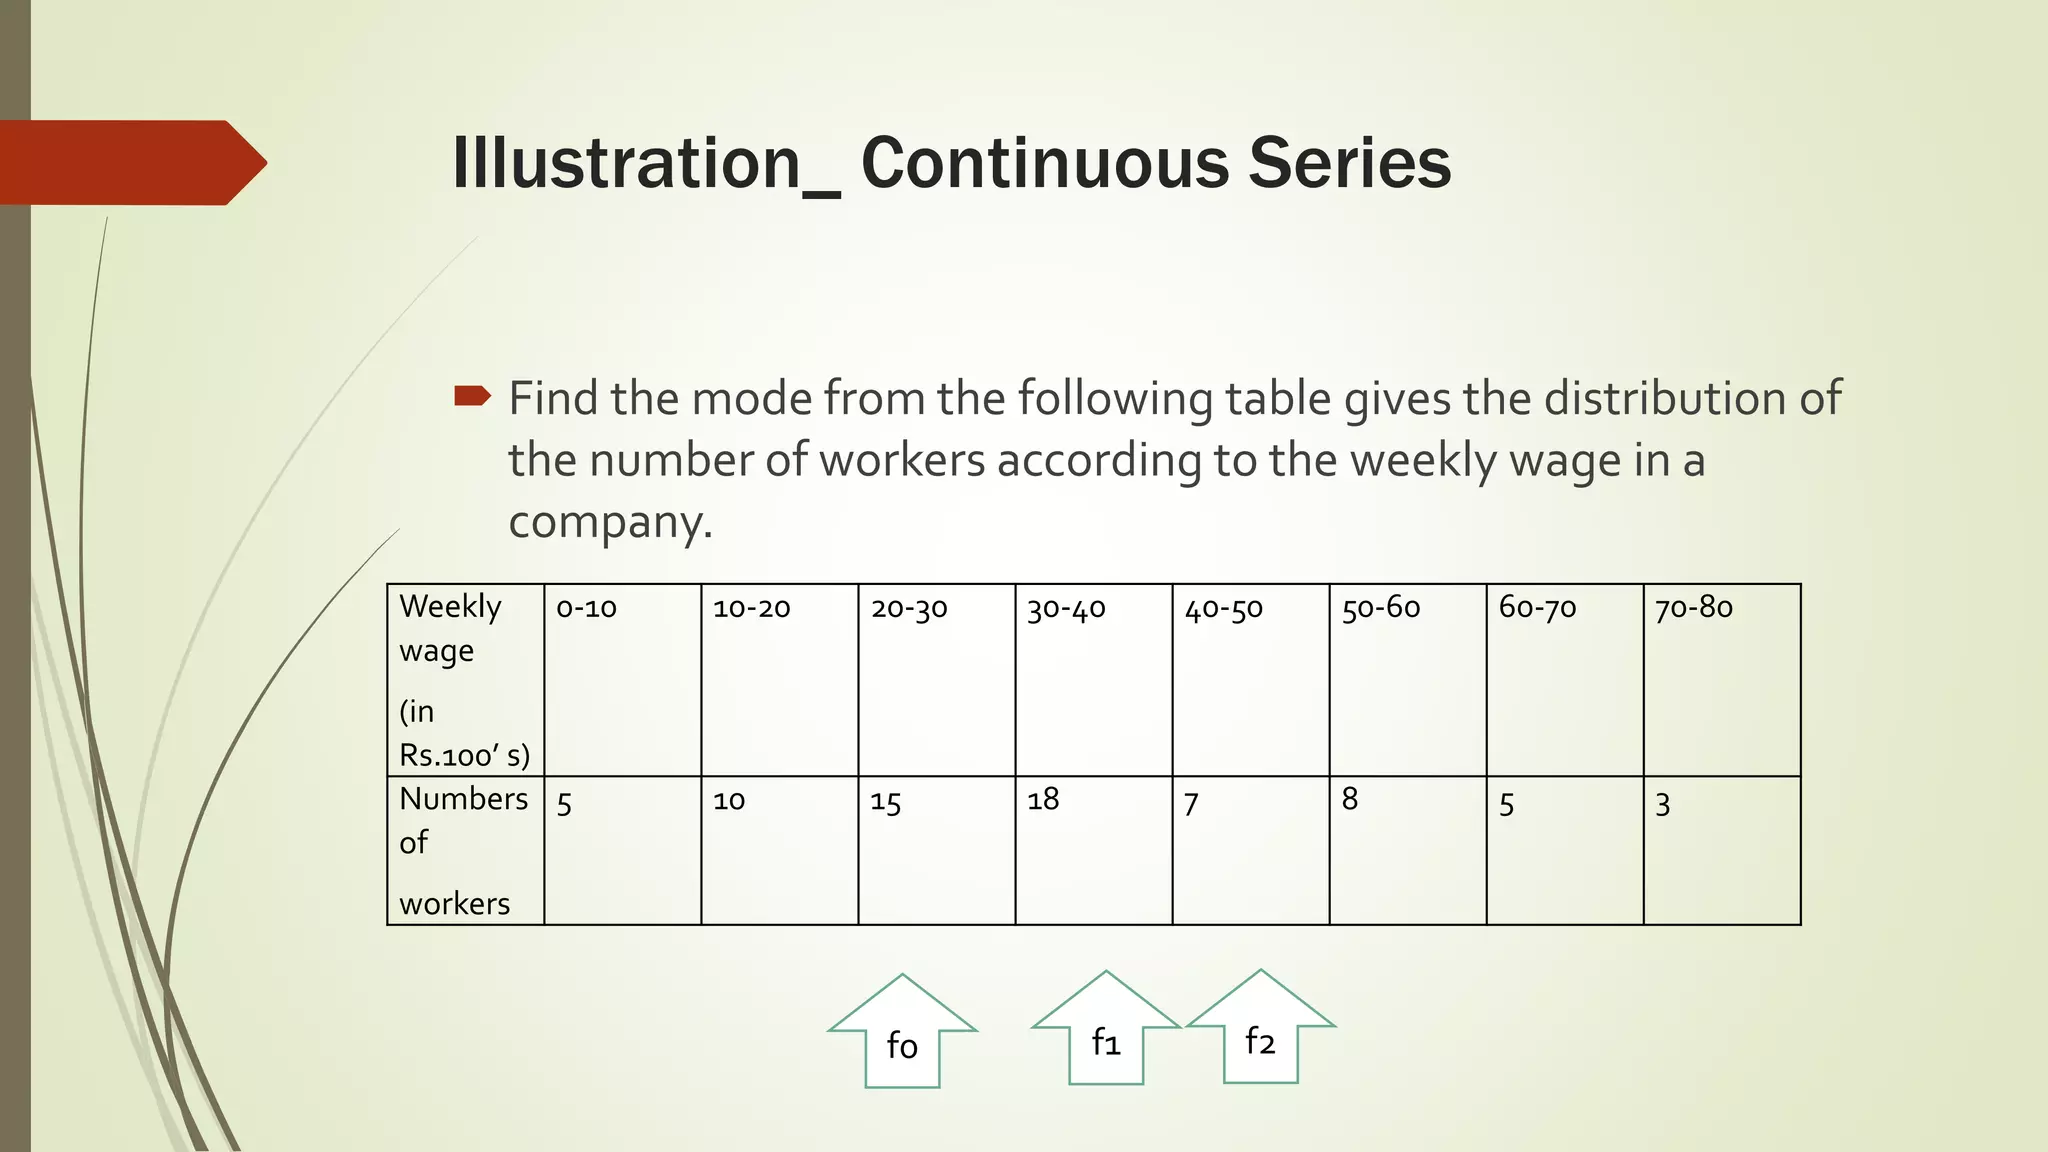
SlideShare a Scribd company logo
Mode
Dr. RMKV
Assistant Professor
MODE
 The mode is the number that appears most frequently in a data set
 It is an actual value, which has the highest concentration of items
in and around it.
 For example, in placing an order for shoes or ready-made
garments the modal size helps because this sizes and other sizes
around in common demand.
Mode is 6
Formula
 Individual observation: For ungrouped data or a series of
individual observations, mode is often found by mere
 Discrete Series: For Discrete distribution, see the highest
frequency and corresponding value of X is mode.
Formula
 Continuous Series: See the highest frequency then the
corresponding value of class interval is called the modal class.
apply the formula.
 Mode = Mo =𝒍 +
𝚫𝟏
𝚫𝟏+𝚫𝟐
∗ 𝒄
 l = Lower limit of the model class Δ1= f1-f0 Δ2 = f1-f2 f1 =
= frequency of the modal class f0 = frequency of the class
the modal class f2 = frequency of the class succeeding the
class
Illustration _Individual Observation
 2 , 7, 10, 15, 10, 17, 8, 10, 2
 Mode = M0=10
 In some cases the mode may be absent while in some cases there
may be more than one mode.
 12, 10, 15, 24, 30 (no mode)
 7, 10, 15, 12, 7, 14, 24, 10, 7, 20, 10
 The modes are 7 and 10
Illustration _Discrete Series
 From the following data, find the value of Mode
 The Mode is 5380 because Rs. 5380 have high frequency
Income 4000 4500 5060 5380 5800 6600
No. of
Person
24 26 20 30 16 6
Illustration _Discrete Series
1. The following data pertaining to the number of members in a
family. Find mode size of the family.
 The Mode size of family is 6 because 6 have high frequency
No. of
family
numb
er
1 2 3 4 5 6 7 8 9 10 11 12
No. of
family
1 3 5 6 10 13 9 5 3 2 2 1
Illustration_ Continuous Series
 Calculate mode for the following :
Highest Frequency – f1
f0
f2
 The highest frequency is 150 and corresponding class interval is
200 – 250, which is the modal class.
 Here L =200,f1=150,f0=91, f2=87, C=50
 𝛥1= f1 - f0 = 150 – 91 = 59
 𝛥2 = f1 - f2 = 150 – 87 = 63
 Mode = M0 = 𝑙 +
𝛥1
𝛥1+𝛥2
∗ 𝑐
 = 200+
59
59+63
x 50
 = 200+
59
122
x 50
 = 200+0.484 x 50
 = 200 + 24.2 =224.2
 Mode is 224.2
Illustration_ Continuous Series
 Find the mode from the following table gives the distribution of
the number of workers according to the weekly wage in a
company.
Weekly
wage
(in
Rs.100’ s)
0-10 10-20 20-30 30-40 40-50 50-60 60-70 70-80
Numbers
of
workers
5 10 15 18 7 8 5 3
f1
f0 f2
 The highest frequency is 18 and corresponding class interval is 30 –
40, which is the modal class.
 Here L =30, f1=18,f0=15, f2=7, C=10
 𝛥1= f1 - f0 = 18 -15 = 3
 𝛥2 = f1 - f2 = 18 – 7 = 11
 Mode = M0 = 𝑙 +
𝛥1
𝛥1+𝛥2
∗ 𝑐
 = 30 +
3
3+11
x 10
 = 30+
3
14
x 10
 = 30+0.214 x 10
 = 30 + 2.14 = 32.14
 Mode is 32.14

More Related Content

What's hot

Lesson 10 - Sorting , Grouping and Filtering Cells
Lesson 10 - Sorting , Grouping and Filtering CellsLesson 10 - Sorting , Grouping and Filtering Cells
Lesson 10 - Sorting , Grouping and Filtering Cells
guevarra_2000
 
Index numbers
Index numbersIndex numbers
Index numbers
haninder k
 
3. lookup functions in excel
3. lookup functions in excel3. lookup functions in excel
3. lookup functions in excel
Dr. Prashant Vats
 
SPSS
SPSSSPSS
Introduction to business statistics
Introduction to business statisticsIntroduction to business statistics
Introduction to business statistics
Aakash Kulkarni
 
Operation research history and overview application limitation
Operation research history and overview application limitationOperation research history and overview application limitation
Operation research history and overview application limitation
Balaji P
 
MERITS AND DEMERITS OF MEAN,MEDIAN,MODE,GM,HM AND WHEN TO USE THEM
MERITS AND DEMERITS OF MEAN,MEDIAN,MODE,GM,HM AND WHEN TO USE THEMMERITS AND DEMERITS OF MEAN,MEDIAN,MODE,GM,HM AND WHEN TO USE THEM
MERITS AND DEMERITS OF MEAN,MEDIAN,MODE,GM,HM AND WHEN TO USE THEM
RephelPaulManasaiS
 
Transportation Problem
Transportation ProblemTransportation Problem
Transportation Problem
Alvin Niere
 
Potential Sources of Error during the Research process
Potential Sources of Error during the Research process Potential Sources of Error during the Research process
Potential Sources of Error during the Research process
SUMAN BISWAS
 
Introduction to Operations Research
Introduction to Operations ResearchIntroduction to Operations Research
Introduction to Operations Research
Victor Seelan
 
Quantitative Techniques: Introduction
Quantitative Techniques: IntroductionQuantitative Techniques: Introduction
Quantitative Techniques: Introduction
Dayanand Huded
 
Correlation Analysis
Correlation AnalysisCorrelation Analysis
Correlation Analysis
Birinder Singh Gulati
 
Indian ethos, need, purpose
Indian ethos, need, purposeIndian ethos, need, purpose
Indian ethos, need, purpose
Chhavi Verma
 
Attitude measurement and scaling techniques
Attitude measurement and scaling techniquesAttitude measurement and scaling techniques
Attitude measurement and scaling techniques
Kritika Jain
 
OPERATION RESEARCH Simulation
OPERATION RESEARCH SimulationOPERATION RESEARCH Simulation
OPERATION RESEARCH Simulation
Komal Hambir
 
What is Statistics
What is StatisticsWhat is Statistics
What is Statistics
sidra-098
 
Assignment problem
Assignment problemAssignment problem
Assignment problem
Abu Bashar
 
Leadership- Organizational Behavior
Leadership- Organizational BehaviorLeadership- Organizational Behavior
Leadership- Organizational Behavior
Gaurav Singh Bisen
 
Operations Research: Significance and limitations
Operations Research: Significance and limitations Operations Research: Significance and limitations
Operations Research: Significance and limitations
Sanjeet Yadav
 
Modified distribution method (modi method)
Modified distribution method (modi method)Modified distribution method (modi method)
Modified distribution method (modi method)
Dinesh Suthar
 

What's hot (20)

Lesson 10 - Sorting , Grouping and Filtering Cells
Lesson 10 - Sorting , Grouping and Filtering CellsLesson 10 - Sorting , Grouping and Filtering Cells
Lesson 10 - Sorting , Grouping and Filtering Cells
 
Index numbers
Index numbersIndex numbers
Index numbers
 
3. lookup functions in excel
3. lookup functions in excel3. lookup functions in excel
3. lookup functions in excel
 
SPSS
SPSSSPSS
SPSS
 
Introduction to business statistics
Introduction to business statisticsIntroduction to business statistics
Introduction to business statistics
 
Operation research history and overview application limitation
Operation research history and overview application limitationOperation research history and overview application limitation
Operation research history and overview application limitation
 
MERITS AND DEMERITS OF MEAN,MEDIAN,MODE,GM,HM AND WHEN TO USE THEM
MERITS AND DEMERITS OF MEAN,MEDIAN,MODE,GM,HM AND WHEN TO USE THEMMERITS AND DEMERITS OF MEAN,MEDIAN,MODE,GM,HM AND WHEN TO USE THEM
MERITS AND DEMERITS OF MEAN,MEDIAN,MODE,GM,HM AND WHEN TO USE THEM
 
Transportation Problem
Transportation ProblemTransportation Problem
Transportation Problem
 
Potential Sources of Error during the Research process
Potential Sources of Error during the Research process Potential Sources of Error during the Research process
Potential Sources of Error during the Research process
 
Introduction to Operations Research
Introduction to Operations ResearchIntroduction to Operations Research
Introduction to Operations Research
 
Quantitative Techniques: Introduction
Quantitative Techniques: IntroductionQuantitative Techniques: Introduction
Quantitative Techniques: Introduction
 
Correlation Analysis
Correlation AnalysisCorrelation Analysis
Correlation Analysis
 
Indian ethos, need, purpose
Indian ethos, need, purposeIndian ethos, need, purpose
Indian ethos, need, purpose
 
Attitude measurement and scaling techniques
Attitude measurement and scaling techniquesAttitude measurement and scaling techniques
Attitude measurement and scaling techniques
 
OPERATION RESEARCH Simulation
OPERATION RESEARCH SimulationOPERATION RESEARCH Simulation
OPERATION RESEARCH Simulation
 
What is Statistics
What is StatisticsWhat is Statistics
What is Statistics
 
Assignment problem
Assignment problemAssignment problem
Assignment problem
 
Leadership- Organizational Behavior
Leadership- Organizational BehaviorLeadership- Organizational Behavior
Leadership- Organizational Behavior
 
Operations Research: Significance and limitations
Operations Research: Significance and limitations Operations Research: Significance and limitations
Operations Research: Significance and limitations
 
Modified distribution method (modi method)
Modified distribution method (modi method)Modified distribution method (modi method)
Modified distribution method (modi method)
 

Similar to Mode in Business Statistics

Mode in statistics
Mode in statisticsMode in statistics
Mode in statistics
Nadeem Uddin
 
Mode
ModeMode
Measure of mode in biostatic
Measure of mode in biostaticMeasure of mode in biostatic
Measure of mode in biostatic
Muhammad Amir Sohail
 
Median and Mode used in Teaching
Median and Mode used in TeachingMedian and Mode used in Teaching
Median and Mode used in Teaching
DBPSC employee assigned to HDMF
 
Mean Mode Median.docx
Mean Mode Median.docxMean Mode Median.docx
Mean Mode Median.docx
Sameeraasif2
 
Interpretation of Assessment Results
Interpretation of Assessment ResultsInterpretation of Assessment Results
Interpretation of Assessment Results
Rica Joy Pontilar
 
To find mode docs
To find mode   docsTo find mode   docs
To find mode docs
Nikita Dewangan
 
Group 3 measures of central tendency and variation - (mean, median, mode, ra...
Group 3  measures of central tendency and variation - (mean, median, mode, ra...Group 3  measures of central tendency and variation - (mean, median, mode, ra...
Group 3 measures of central tendency and variation - (mean, median, mode, ra...
reymartyvette_0611
 
MODE.pptx
MODE.pptxMODE.pptx
MODE.pptx
SreeLatha98
 
CLASS 10 MEAN MEDIAN MODE
CLASS 10 MEAN MEDIAN MODECLASS 10 MEAN MEDIAN MODE
CLASS 10 MEAN MEDIAN MODE
AKBAR1961
 
Measures-of-Central-Tendency.ppt
Measures-of-Central-Tendency.pptMeasures-of-Central-Tendency.ppt
Measures-of-Central-Tendency.ppt
GrandeurAidranMamaua
 
Measures of central tendency by maria diza c. febrio
Measures of central tendency by maria diza c. febrioMeasures of central tendency by maria diza c. febrio
Measures of central tendency by maria diza c. febrio
mariadiza
 
Saim & Muqadas.pptx
Saim & Muqadas.pptxSaim & Muqadas.pptx
Saim & Muqadas.pptx
saimwaheed2
 
Mode(biostatics)
Mode(biostatics)Mode(biostatics)
Mode(biostatics)
VaishaliC4
 
Calculation of Median
Calculation of MedianCalculation of Median
Calculation of Median
Dr. Sunita Ojha
 
Measures of central tendency
Measures of central tendencyMeasures of central tendency
Measures of central tendency
Manu Antony
 
Mode ppt
Mode  pptMode  ppt
Mode ppt
lijirajan152
 
Relationship among mean, median and mode
Relationship among mean, median and modeRelationship among mean, median and mode
Relationship among mean, median and mode
Nadeem Uddin
 
Median and mode
Median and modeMedian and mode
Median and mode
waziristani
 
Module 3 statistics
Module 3   statisticsModule 3   statistics
Module 3 statistics
dionesioable
 

Similar to Mode in Business Statistics (20)

Mode in statistics
Mode in statisticsMode in statistics
Mode in statistics
 
Mode
ModeMode
Mode
 
Measure of mode in biostatic
Measure of mode in biostaticMeasure of mode in biostatic
Measure of mode in biostatic
 
Median and Mode used in Teaching
Median and Mode used in TeachingMedian and Mode used in Teaching
Median and Mode used in Teaching
 
Mean Mode Median.docx
Mean Mode Median.docxMean Mode Median.docx
Mean Mode Median.docx
 
Interpretation of Assessment Results
Interpretation of Assessment ResultsInterpretation of Assessment Results
Interpretation of Assessment Results
 
To find mode docs
To find mode   docsTo find mode   docs
To find mode docs
 
Group 3 measures of central tendency and variation - (mean, median, mode, ra...
Group 3  measures of central tendency and variation - (mean, median, mode, ra...Group 3  measures of central tendency and variation - (mean, median, mode, ra...
Group 3 measures of central tendency and variation - (mean, median, mode, ra...
 
MODE.pptx
MODE.pptxMODE.pptx
MODE.pptx
 
CLASS 10 MEAN MEDIAN MODE
CLASS 10 MEAN MEDIAN MODECLASS 10 MEAN MEDIAN MODE
CLASS 10 MEAN MEDIAN MODE
 
Measures-of-Central-Tendency.ppt
Measures-of-Central-Tendency.pptMeasures-of-Central-Tendency.ppt
Measures-of-Central-Tendency.ppt
 
Measures of central tendency by maria diza c. febrio
Measures of central tendency by maria diza c. febrioMeasures of central tendency by maria diza c. febrio
Measures of central tendency by maria diza c. febrio
 
Saim & Muqadas.pptx
Saim & Muqadas.pptxSaim & Muqadas.pptx
Saim & Muqadas.pptx
 
Mode(biostatics)
Mode(biostatics)Mode(biostatics)
Mode(biostatics)
 
Calculation of Median
Calculation of MedianCalculation of Median
Calculation of Median
 
Measures of central tendency
Measures of central tendencyMeasures of central tendency
Measures of central tendency
 
Mode ppt
Mode  pptMode  ppt
Mode ppt
 
Relationship among mean, median and mode
Relationship among mean, median and modeRelationship among mean, median and mode
Relationship among mean, median and mode
 
Median and mode
Median and modeMedian and mode
Median and mode
 
Module 3 statistics
Module 3   statisticsModule 3   statistics
Module 3 statistics
 

More from muthukrishnaveni anand

crypto_erupee.pptx
crypto_erupee.pptxcrypto_erupee.pptx
crypto_erupee.pptx
muthukrishnaveni anand
 
Emotional distress_chapter-6_G1.pptx
Emotional distress_chapter-6_G1.pptxEmotional distress_chapter-6_G1.pptx
Emotional distress_chapter-6_G1.pptx
muthukrishnaveni anand
 
Presentation1.pptx
Presentation1.pptxPresentation1.pptx
Presentation1.pptx
muthukrishnaveni anand
 
enhancing emplyability.pptx
enhancing emplyability.pptxenhancing emplyability.pptx
enhancing emplyability.pptx
muthukrishnaveni anand
 
BS6_Measurement of Trend.pptx
BS6_Measurement of Trend.pptxBS6_Measurement of Trend.pptx
BS6_Measurement of Trend.pptx
muthukrishnaveni anand
 
Practical Application of Central Value.pptx
Practical Application of Central Value.pptxPractical Application of Central Value.pptx
Practical Application of Central Value.pptx
muthukrishnaveni anand
 
BS_5Correlation.pptx
BS_5Correlation.pptxBS_5Correlation.pptx
BS_5Correlation.pptx
muthukrishnaveni anand
 
BS_4SKEWNESS.pptx
BS_4SKEWNESS.pptxBS_4SKEWNESS.pptx
BS_4SKEWNESS.pptx
muthukrishnaveni anand
 
BS_3Standard Deviation.pptx
BS_3Standard Deviation.pptxBS_3Standard Deviation.pptx
BS_3Standard Deviation.pptx
muthukrishnaveni anand
 
BS_3Quartile Deviation.pptx
BS_3Quartile Deviation.pptxBS_3Quartile Deviation.pptx
BS_3Quartile Deviation.pptx
muthukrishnaveni anand
 
BS_3Measure of Dispersion.pptx
BS_3Measure of Dispersion.pptxBS_3Measure of Dispersion.pptx
BS_3Measure of Dispersion.pptx
muthukrishnaveni anand
 
BS_2WEIGHTED ARITHMETIC MEAN.pptx
BS_2WEIGHTED ARITHMETIC MEAN.pptxBS_2WEIGHTED ARITHMETIC MEAN.pptx
BS_2WEIGHTED ARITHMETIC MEAN.pptx
muthukrishnaveni anand
 
BS_2Relationship Among the Averages.pptx
BS_2Relationship Among the Averages.pptxBS_2Relationship Among the Averages.pptx
BS_2Relationship Among the Averages.pptx
muthukrishnaveni anand
 
BS_2Harmonic Mean.pptx
BS_2Harmonic Mean.pptxBS_2Harmonic Mean.pptx
BS_2Harmonic Mean.pptx
muthukrishnaveni anand
 
BS_2Geometric Mean.pptx
BS_2Geometric Mean.pptxBS_2Geometric Mean.pptx
BS_2Geometric Mean.pptx
muthukrishnaveni anand
 
BS_2Combined Arithmetic Mean.pptx
BS_2Combined Arithmetic Mean.pptxBS_2Combined Arithmetic Mean.pptx
BS_2Combined Arithmetic Mean.pptx
muthukrishnaveni anand
 
TEST OF SIGNIFICANCE.pptx
TEST OF SIGNIFICANCE.pptxTEST OF SIGNIFICANCE.pptx
TEST OF SIGNIFICANCE.pptx
muthukrishnaveni anand
 
Risk Management and Control(Insurance).pptx
Risk Management and Control(Insurance).pptxRisk Management and Control(Insurance).pptx
Risk Management and Control(Insurance).pptx
muthukrishnaveni anand
 
enhancing emplyability.pptx
enhancing emplyability.pptxenhancing emplyability.pptx
enhancing emplyability.pptx
muthukrishnaveni anand
 
Literacy - way to entrepreneurship.pptx
Literacy - way to entrepreneurship.pptxLiteracy - way to entrepreneurship.pptx
Literacy - way to entrepreneurship.pptx
muthukrishnaveni anand
 

More from muthukrishnaveni anand (20)

crypto_erupee.pptx
crypto_erupee.pptxcrypto_erupee.pptx
crypto_erupee.pptx
 
Emotional distress_chapter-6_G1.pptx
Emotional distress_chapter-6_G1.pptxEmotional distress_chapter-6_G1.pptx
Emotional distress_chapter-6_G1.pptx
 
Presentation1.pptx
Presentation1.pptxPresentation1.pptx
Presentation1.pptx
 
enhancing emplyability.pptx
enhancing emplyability.pptxenhancing emplyability.pptx
enhancing emplyability.pptx
 
BS6_Measurement of Trend.pptx
BS6_Measurement of Trend.pptxBS6_Measurement of Trend.pptx
BS6_Measurement of Trend.pptx
 
Practical Application of Central Value.pptx
Practical Application of Central Value.pptxPractical Application of Central Value.pptx
Practical Application of Central Value.pptx
 
BS_5Correlation.pptx
BS_5Correlation.pptxBS_5Correlation.pptx
BS_5Correlation.pptx
 
BS_4SKEWNESS.pptx
BS_4SKEWNESS.pptxBS_4SKEWNESS.pptx
BS_4SKEWNESS.pptx
 
BS_3Standard Deviation.pptx
BS_3Standard Deviation.pptxBS_3Standard Deviation.pptx
BS_3Standard Deviation.pptx
 
BS_3Quartile Deviation.pptx
BS_3Quartile Deviation.pptxBS_3Quartile Deviation.pptx
BS_3Quartile Deviation.pptx
 
BS_3Measure of Dispersion.pptx
BS_3Measure of Dispersion.pptxBS_3Measure of Dispersion.pptx
BS_3Measure of Dispersion.pptx
 
BS_2WEIGHTED ARITHMETIC MEAN.pptx
BS_2WEIGHTED ARITHMETIC MEAN.pptxBS_2WEIGHTED ARITHMETIC MEAN.pptx
BS_2WEIGHTED ARITHMETIC MEAN.pptx
 
BS_2Relationship Among the Averages.pptx
BS_2Relationship Among the Averages.pptxBS_2Relationship Among the Averages.pptx
BS_2Relationship Among the Averages.pptx
 
BS_2Harmonic Mean.pptx
BS_2Harmonic Mean.pptxBS_2Harmonic Mean.pptx
BS_2Harmonic Mean.pptx
 
BS_2Geometric Mean.pptx
BS_2Geometric Mean.pptxBS_2Geometric Mean.pptx
BS_2Geometric Mean.pptx
 
BS_2Combined Arithmetic Mean.pptx
BS_2Combined Arithmetic Mean.pptxBS_2Combined Arithmetic Mean.pptx
BS_2Combined Arithmetic Mean.pptx
 
TEST OF SIGNIFICANCE.pptx
TEST OF SIGNIFICANCE.pptxTEST OF SIGNIFICANCE.pptx
TEST OF SIGNIFICANCE.pptx
 
Risk Management and Control(Insurance).pptx
Risk Management and Control(Insurance).pptxRisk Management and Control(Insurance).pptx
Risk Management and Control(Insurance).pptx
 
enhancing emplyability.pptx
enhancing emplyability.pptxenhancing emplyability.pptx
enhancing emplyability.pptx
 
Literacy - way to entrepreneurship.pptx
Literacy - way to entrepreneurship.pptxLiteracy - way to entrepreneurship.pptx
Literacy - way to entrepreneurship.pptx
 

Recently uploaded

Smart-Money for SMC traders good time and ICT
Smart-Money for SMC traders good time and ICTSmart-Money for SMC traders good time and ICT
Smart-Money for SMC traders good time and ICT
simonomuemu
 
Assessment and Planning in Educational technology.pptx
Assessment and Planning in Educational technology.pptxAssessment and Planning in Educational technology.pptx
Assessment and Planning in Educational technology.pptx
Kavitha Krishnan
 
The Diamonds of 2023-2024 in the IGRA collection
The Diamonds of 2023-2024 in the IGRA collectionThe Diamonds of 2023-2024 in the IGRA collection
The Diamonds of 2023-2024 in the IGRA collection
Israel Genealogy Research Association
 
Introduction to AI for Nonprofits with Tapp Network
Introduction to AI for Nonprofits with Tapp NetworkIntroduction to AI for Nonprofits with Tapp Network
Introduction to AI for Nonprofits with Tapp Network
TechSoup
 
Film vocab for eal 3 students: Australia the movie
Film vocab for eal 3 students: Australia the movieFilm vocab for eal 3 students: Australia the movie
Film vocab for eal 3 students: Australia the movie
Nicholas Montgomery
 
Digital Artifact 1 - 10VCD Environments Unit
Digital Artifact 1 - 10VCD Environments UnitDigital Artifact 1 - 10VCD Environments Unit
Digital Artifact 1 - 10VCD Environments Unit
chanes7
 
The basics of sentences session 5pptx.pptx
The basics of sentences session 5pptx.pptxThe basics of sentences session 5pptx.pptx
The basics of sentences session 5pptx.pptx
heathfieldcps1
 
Life upper-Intermediate B2 Workbook for student
Life upper-Intermediate B2 Workbook for studentLife upper-Intermediate B2 Workbook for student
Life upper-Intermediate B2 Workbook for student
NgcHiNguyn25
 
Chapter 4 - Islamic Financial Institutions in Malaysia.pptx
Chapter 4 - Islamic Financial Institutions in Malaysia.pptxChapter 4 - Islamic Financial Institutions in Malaysia.pptx
Chapter 4 - Islamic Financial Institutions in Malaysia.pptx
Mohd Adib Abd Muin, Senior Lecturer at Universiti Utara Malaysia
 
MARY JANE WILSON, A “BOA MÃE” .
MARY JANE WILSON, A “BOA MÃE”           .MARY JANE WILSON, A “BOA MÃE”           .
MARY JANE WILSON, A “BOA MÃE” .
Colégio Santa Teresinha
 
Main Java[All of the Base Concepts}.docx
Main Java[All of the Base Concepts}.docxMain Java[All of the Base Concepts}.docx
Main Java[All of the Base Concepts}.docx
adhitya5119
 
ISO/IEC 27001, ISO/IEC 42001, and GDPR: Best Practices for Implementation and...
ISO/IEC 27001, ISO/IEC 42001, and GDPR: Best Practices for Implementation and...ISO/IEC 27001, ISO/IEC 42001, and GDPR: Best Practices for Implementation and...
ISO/IEC 27001, ISO/IEC 42001, and GDPR: Best Practices for Implementation and...
PECB
 
Pollock and Snow "DEIA in the Scholarly Landscape, Session One: Setting Expec...
Pollock and Snow "DEIA in the Scholarly Landscape, Session One: Setting Expec...Pollock and Snow "DEIA in the Scholarly Landscape, Session One: Setting Expec...
Pollock and Snow "DEIA in the Scholarly Landscape, Session One: Setting Expec...
National Information Standards Organization (NISO)
 
The simplified electron and muon model, Oscillating Spacetime: The Foundation...
The simplified electron and muon model, Oscillating Spacetime: The Foundation...The simplified electron and muon model, Oscillating Spacetime: The Foundation...
The simplified electron and muon model, Oscillating Spacetime: The Foundation...
RitikBhardwaj56
 
Digital Artefact 1 - Tiny Home Environmental Design
Digital Artefact 1 - Tiny Home Environmental DesignDigital Artefact 1 - Tiny Home Environmental Design
Digital Artefact 1 - Tiny Home Environmental Design
amberjdewit93
 
PCOS corelations and management through Ayurveda.
PCOS corelations and management through Ayurveda.PCOS corelations and management through Ayurveda.
PCOS corelations and management through Ayurveda.
Dr. Shivangi Singh Parihar
 
A Strategic Approach: GenAI in Education
A Strategic Approach: GenAI in EducationA Strategic Approach: GenAI in Education
A Strategic Approach: GenAI in Education
Peter Windle
 
Pride Month Slides 2024 David Douglas School District
Pride Month Slides 2024 David Douglas School DistrictPride Month Slides 2024 David Douglas School District
Pride Month Slides 2024 David Douglas School District
David Douglas School District
 
How to Manage Your Lost Opportunities in Odoo 17 CRM
How to Manage Your Lost Opportunities in Odoo 17 CRMHow to Manage Your Lost Opportunities in Odoo 17 CRM
How to Manage Your Lost Opportunities in Odoo 17 CRM
Celine George
 
Hindi varnamala | hindi alphabet PPT.pdf
Hindi varnamala | hindi alphabet PPT.pdfHindi varnamala | hindi alphabet PPT.pdf
Hindi varnamala | hindi alphabet PPT.pdf
Dr. Mulla Adam Ali
 

Recently uploaded (20)

Smart-Money for SMC traders good time and ICT
Smart-Money for SMC traders good time and ICTSmart-Money for SMC traders good time and ICT
Smart-Money for SMC traders good time and ICT
 
Assessment and Planning in Educational technology.pptx
Assessment and Planning in Educational technology.pptxAssessment and Planning in Educational technology.pptx
Assessment and Planning in Educational technology.pptx
 
The Diamonds of 2023-2024 in the IGRA collection
The Diamonds of 2023-2024 in the IGRA collectionThe Diamonds of 2023-2024 in the IGRA collection
The Diamonds of 2023-2024 in the IGRA collection
 
Introduction to AI for Nonprofits with Tapp Network
Introduction to AI for Nonprofits with Tapp NetworkIntroduction to AI for Nonprofits with Tapp Network
Introduction to AI for Nonprofits with Tapp Network
 
Film vocab for eal 3 students: Australia the movie
Film vocab for eal 3 students: Australia the movieFilm vocab for eal 3 students: Australia the movie
Film vocab for eal 3 students: Australia the movie
 
Digital Artifact 1 - 10VCD Environments Unit
Digital Artifact 1 - 10VCD Environments UnitDigital Artifact 1 - 10VCD Environments Unit
Digital Artifact 1 - 10VCD Environments Unit
 
The basics of sentences session 5pptx.pptx
The basics of sentences session 5pptx.pptxThe basics of sentences session 5pptx.pptx
The basics of sentences session 5pptx.pptx
 
Life upper-Intermediate B2 Workbook for student
Life upper-Intermediate B2 Workbook for studentLife upper-Intermediate B2 Workbook for student
Life upper-Intermediate B2 Workbook for student
 
Chapter 4 - Islamic Financial Institutions in Malaysia.pptx
Chapter 4 - Islamic Financial Institutions in Malaysia.pptxChapter 4 - Islamic Financial Institutions in Malaysia.pptx
Chapter 4 - Islamic Financial Institutions in Malaysia.pptx
 
MARY JANE WILSON, A “BOA MÃE” .
MARY JANE WILSON, A “BOA MÃE”           .MARY JANE WILSON, A “BOA MÃE”           .
MARY JANE WILSON, A “BOA MÃE” .
 
Main Java[All of the Base Concepts}.docx
Main Java[All of the Base Concepts}.docxMain Java[All of the Base Concepts}.docx
Main Java[All of the Base Concepts}.docx
 
ISO/IEC 27001, ISO/IEC 42001, and GDPR: Best Practices for Implementation and...
ISO/IEC 27001, ISO/IEC 42001, and GDPR: Best Practices for Implementation and...ISO/IEC 27001, ISO/IEC 42001, and GDPR: Best Practices for Implementation and...
ISO/IEC 27001, ISO/IEC 42001, and GDPR: Best Practices for Implementation and...
 
Pollock and Snow "DEIA in the Scholarly Landscape, Session One: Setting Expec...
Pollock and Snow "DEIA in the Scholarly Landscape, Session One: Setting Expec...Pollock and Snow "DEIA in the Scholarly Landscape, Session One: Setting Expec...
Pollock and Snow "DEIA in the Scholarly Landscape, Session One: Setting Expec...
 
The simplified electron and muon model, Oscillating Spacetime: The Foundation...
The simplified electron and muon model, Oscillating Spacetime: The Foundation...The simplified electron and muon model, Oscillating Spacetime: The Foundation...
The simplified electron and muon model, Oscillating Spacetime: The Foundation...
 
Digital Artefact 1 - Tiny Home Environmental Design
Digital Artefact 1 - Tiny Home Environmental DesignDigital Artefact 1 - Tiny Home Environmental Design
Digital Artefact 1 - Tiny Home Environmental Design
 
PCOS corelations and management through Ayurveda.
PCOS corelations and management through Ayurveda.PCOS corelations and management through Ayurveda.
PCOS corelations and management through Ayurveda.
 
A Strategic Approach: GenAI in Education
A Strategic Approach: GenAI in EducationA Strategic Approach: GenAI in Education
A Strategic Approach: GenAI in Education
 
Pride Month Slides 2024 David Douglas School District
Pride Month Slides 2024 David Douglas School DistrictPride Month Slides 2024 David Douglas School District
Pride Month Slides 2024 David Douglas School District
 
How to Manage Your Lost Opportunities in Odoo 17 CRM
How to Manage Your Lost Opportunities in Odoo 17 CRMHow to Manage Your Lost Opportunities in Odoo 17 CRM
How to Manage Your Lost Opportunities in Odoo 17 CRM
 
Hindi varnamala | hindi alphabet PPT.pdf
Hindi varnamala | hindi alphabet PPT.pdfHindi varnamala | hindi alphabet PPT.pdf
Hindi varnamala | hindi alphabet PPT.pdf
 

Mode in Business Statistics

  • 2. MODE  The mode is the number that appears most frequently in a data set  It is an actual value, which has the highest concentration of items in and around it.  For example, in placing an order for shoes or ready-made garments the modal size helps because this sizes and other sizes around in common demand.
  • 4. Formula  Individual observation: For ungrouped data or a series of individual observations, mode is often found by mere  Discrete Series: For Discrete distribution, see the highest frequency and corresponding value of X is mode.
  • 5. Formula  Continuous Series: See the highest frequency then the corresponding value of class interval is called the modal class. apply the formula.  Mode = Mo =𝒍 + 𝚫𝟏 𝚫𝟏+𝚫𝟐 ∗ 𝒄  l = Lower limit of the model class Δ1= f1-f0 Δ2 = f1-f2 f1 = = frequency of the modal class f0 = frequency of the class the modal class f2 = frequency of the class succeeding the class
  • 6. Illustration _Individual Observation  2 , 7, 10, 15, 10, 17, 8, 10, 2  Mode = M0=10  In some cases the mode may be absent while in some cases there may be more than one mode.  12, 10, 15, 24, 30 (no mode)  7, 10, 15, 12, 7, 14, 24, 10, 7, 20, 10  The modes are 7 and 10
  • 7. Illustration _Discrete Series  From the following data, find the value of Mode  The Mode is 5380 because Rs. 5380 have high frequency Income 4000 4500 5060 5380 5800 6600 No. of Person 24 26 20 30 16 6
  • 8. Illustration _Discrete Series 1. The following data pertaining to the number of members in a family. Find mode size of the family.  The Mode size of family is 6 because 6 have high frequency No. of family numb er 1 2 3 4 5 6 7 8 9 10 11 12 No. of family 1 3 5 6 10 13 9 5 3 2 2 1
  • 9. Illustration_ Continuous Series  Calculate mode for the following : Highest Frequency – f1 f0 f2
  • 10.  The highest frequency is 150 and corresponding class interval is 200 – 250, which is the modal class.  Here L =200,f1=150,f0=91, f2=87, C=50  𝛥1= f1 - f0 = 150 – 91 = 59  𝛥2 = f1 - f2 = 150 – 87 = 63  Mode = M0 = 𝑙 + 𝛥1 𝛥1+𝛥2 ∗ 𝑐  = 200+ 59 59+63 x 50  = 200+ 59 122 x 50  = 200+0.484 x 50  = 200 + 24.2 =224.2  Mode is 224.2
  • 11. Illustration_ Continuous Series  Find the mode from the following table gives the distribution of the number of workers according to the weekly wage in a company. Weekly wage (in Rs.100’ s) 0-10 10-20 20-30 30-40 40-50 50-60 60-70 70-80 Numbers of workers 5 10 15 18 7 8 5 3 f1 f0 f2
  • 12.  The highest frequency is 18 and corresponding class interval is 30 – 40, which is the modal class.  Here L =30, f1=18,f0=15, f2=7, C=10  𝛥1= f1 - f0 = 18 -15 = 3  𝛥2 = f1 - f2 = 18 – 7 = 11  Mode = M0 = 𝑙 + 𝛥1 𝛥1+𝛥2 ∗ 𝑐  = 30 + 3 3+11 x 10  = 30+ 3 14 x 10  = 30+0.214 x 10  = 30 + 2.14 = 32.14  Mode is 32.14