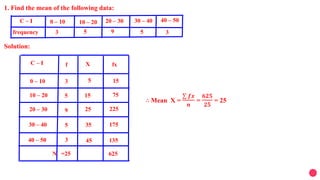
This document contains 7 examples of calculating measures of central tendency (mean, median, mode) from frequency distribution tables. For each example, it shows the frequency table data, the step-by-step working to calculate the measure of central tendency, and states the final value of the measure. It also includes one example of drawing a less than type ogive from income and number of workers data.


![[2]Calculate the median for the following data
C – I
F
50 – 60 60 – 70 70 – 80 80 – 90 90 – 100
12 14 8 6 10
Solution:
Class
intervals
50 – 60
60 – 70
70 – 80
80 – 90
90 – 100
Frequency
Cumulative
frequency
12
14
8
6
10
12
26
34
40
50
Now n = 50,
𝒏
𝟐
=
𝟓𝟎
𝟐
=25 this observation
lies in the class 60 – 70 then
l = [the lower limit] = 60
cf = [the cumulative frequency of class
preceding 60 – 70] = 12
f = [the frequency of the median class 60 – 70 ] = 14
h= [the class size] = 10
Using the formula, Median = l +
𝒏
𝟐
−𝒄𝒇
𝒇
x h
Median = 60 +
25 −12
14
x 10
= 60 + 130
14
= 60 +9.3 = 69.3](https://image.slidesharecdn.com/newmeanmedianmode-201013034502/85/CLASS-10-MEAN-MEDIAN-MODE-4-320.jpg)
![[4]Calculate the median for the following data
C – I
F
0 – 20 20 – 40 40– 60 60 – 80 80 – 100 100 – 120 120 – 140
2 6 10 12 2 5 3
Solution:
Class
intervals
0 – 20
20 – 40
40– 60
60 – 80
80 – 100
100 – 120
120 – 140
Frequency
Cumulative
frequency
2
6
10
12
2
5
3
2
18
30
32
37
40
Now n = 50,
𝒏
𝟐
=
𝟒𝟎
𝟐
=20 this observation
lies in the class 60 – 80 then
l = [the lower limit] = 60
cf = [the cumulative frequency of class
preceding 60 – 80] = 18
f = [the frequency of the median class 40 – 60 ] = 12
h= [the class size] = 20
Using the formula, Median = l +
𝒏
𝟐
−𝒄𝒇
𝒇
x h
Median = 60 +
𝟐𝟎−𝟏𝟖
𝟏𝟐
x 20
= 60 +
𝟒𝟎
𝟏𝟐
= 60 + 3.33 = 63.33
8](https://image.slidesharecdn.com/newmeanmedianmode-201013034502/85/CLASS-10-MEAN-MEDIAN-MODE-6-320.jpg)
![[5]Calculate the Mode for the following frequency distribution
C – I
F
5 – 15 15 – 25 25– 35 35 – 45 45 – 55 55 – 65
6 11 21 23 14 5
f1
Now, let us substitute these values in the formula:
Mode = l +
𝒇 𝟏
−𝒇 𝟎
𝟐𝒇 𝟏
−𝒇 𝟎
−𝒇 𝟐
x h
Mode = 35 +
𝟐𝟑−𝟐𝟏
𝟐 x 𝟐𝟑 −𝟐𝟏 −𝟏𝟒
x 10
Mode = 35 +
𝟐
𝟒𝟔 −𝟑𝟓
x 10
= 35 +
𝟐
𝟏𝟏
x 10
Mode = 35 + 1.81= 36 .81
Mode = 35 +
𝟐𝟎
𝟏𝟏
Therefore the mode of the data is 36.81
fO f2h = 10](https://image.slidesharecdn.com/newmeanmedianmode-201013034502/85/CLASS-10-MEAN-MEDIAN-MODE-8-320.jpg)
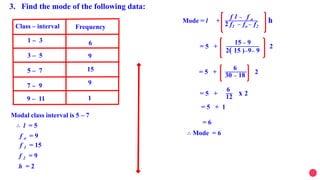
![[6]Calculate the Mode for the following frequency distribution
C – I
F
5 – 15 15 – 25 25– 35 35 – 45 45 – 55 55 – 65
6 11 21 23 14 5
Solution: Here the maximum class frequency is 23, and the class corresponding to
this frequency is 35 – 45. So, the modal class is 35 – 45
Now, modal class = 35 – 45 , lower limit ( l )
of modal class = 35, class size is (h) = 10
Frequency ( f1 ) of the modal class =23
Frequency ( f0 ) of class preceding the modal class =21
Frequency ( f2 ) of class succeeding the modal class =14
Now, let us substitute these values in the formula:
Mode = l +
𝒇 𝟏
−𝒇 𝟎
𝟐𝒇 𝟏
−𝒇 𝟎
−𝒇 𝟐
x h
Mode = 35 +
𝟐𝟑−𝟐𝟏
𝟐 x 𝟐𝟑 −𝟐𝟏 −𝟏𝟒
x 10
Mode = 35 +
𝟐
𝟒𝟔 −𝟑𝟓
x 10
= 35 +
𝟐
𝟏𝟏
x 10
Mode = 35 + 1.81= 36 .81
Mode = 35 +
𝟐𝟎
𝟏𝟏
Therefore the mode of the data is 36.81](https://image.slidesharecdn.com/newmeanmedianmode-201013034502/85/CLASS-10-MEAN-MEDIAN-MODE-9-320.jpg)
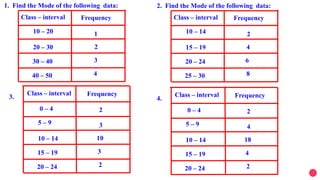
![[7]Calculate the Mode for the following frequency distribution
C – I
F
5 – 15 15 – 25 25– 35 35 – 45 45 – 55 55 – 65
4 20 24 6 4 2
Solution: Here the maximum class frequency is 23, and the class corresponding to
this frequency is 35 – 45. So, the modal class is 35 – 45
Now, modal class = 35 – 45 , lower limit ( l )
of modal class = 35, class size is (h) = 10
Frequency ( f1 ) of the modal class =24
Frequency ( f0 ) of class preceding the modal class =20
Frequency ( f2 ) of class succeeding the modal class =6
Now, let us substitute these values in the formula:
Mode = l +
𝒇 𝟏
−𝒇 𝟎
𝟐𝒇 𝟏
−𝒇 𝟎
−𝒇 𝟐
x h
Mode = 35 +
𝟐𝟒−𝟐𝟎
𝟐 x 𝟐𝟒 −𝟐𝟎 −𝟔
x 10
Mode = 25 +
𝟒
𝟒𝟖 −𝟐𝟔
x 10
= 25 +
𝟒
𝟐𝟐
x 10
Mode = 25 + 3.63= 28 .63
Mode = 25 +
𝟒𝟎
𝟏𝟏
Therefore the mode of the data is 28.63](https://image.slidesharecdn.com/newmeanmedianmode-201013034502/85/CLASS-10-MEAN-MEDIAN-MODE-10-320.jpg)

![SETS [Algebra]](https://cdn.slidesharecdn.com/ss_thumbnails/sets-stdixppt-140421034609-phpapp01-thumbnail.jpg?width=640&height=640&fit=bounds)


