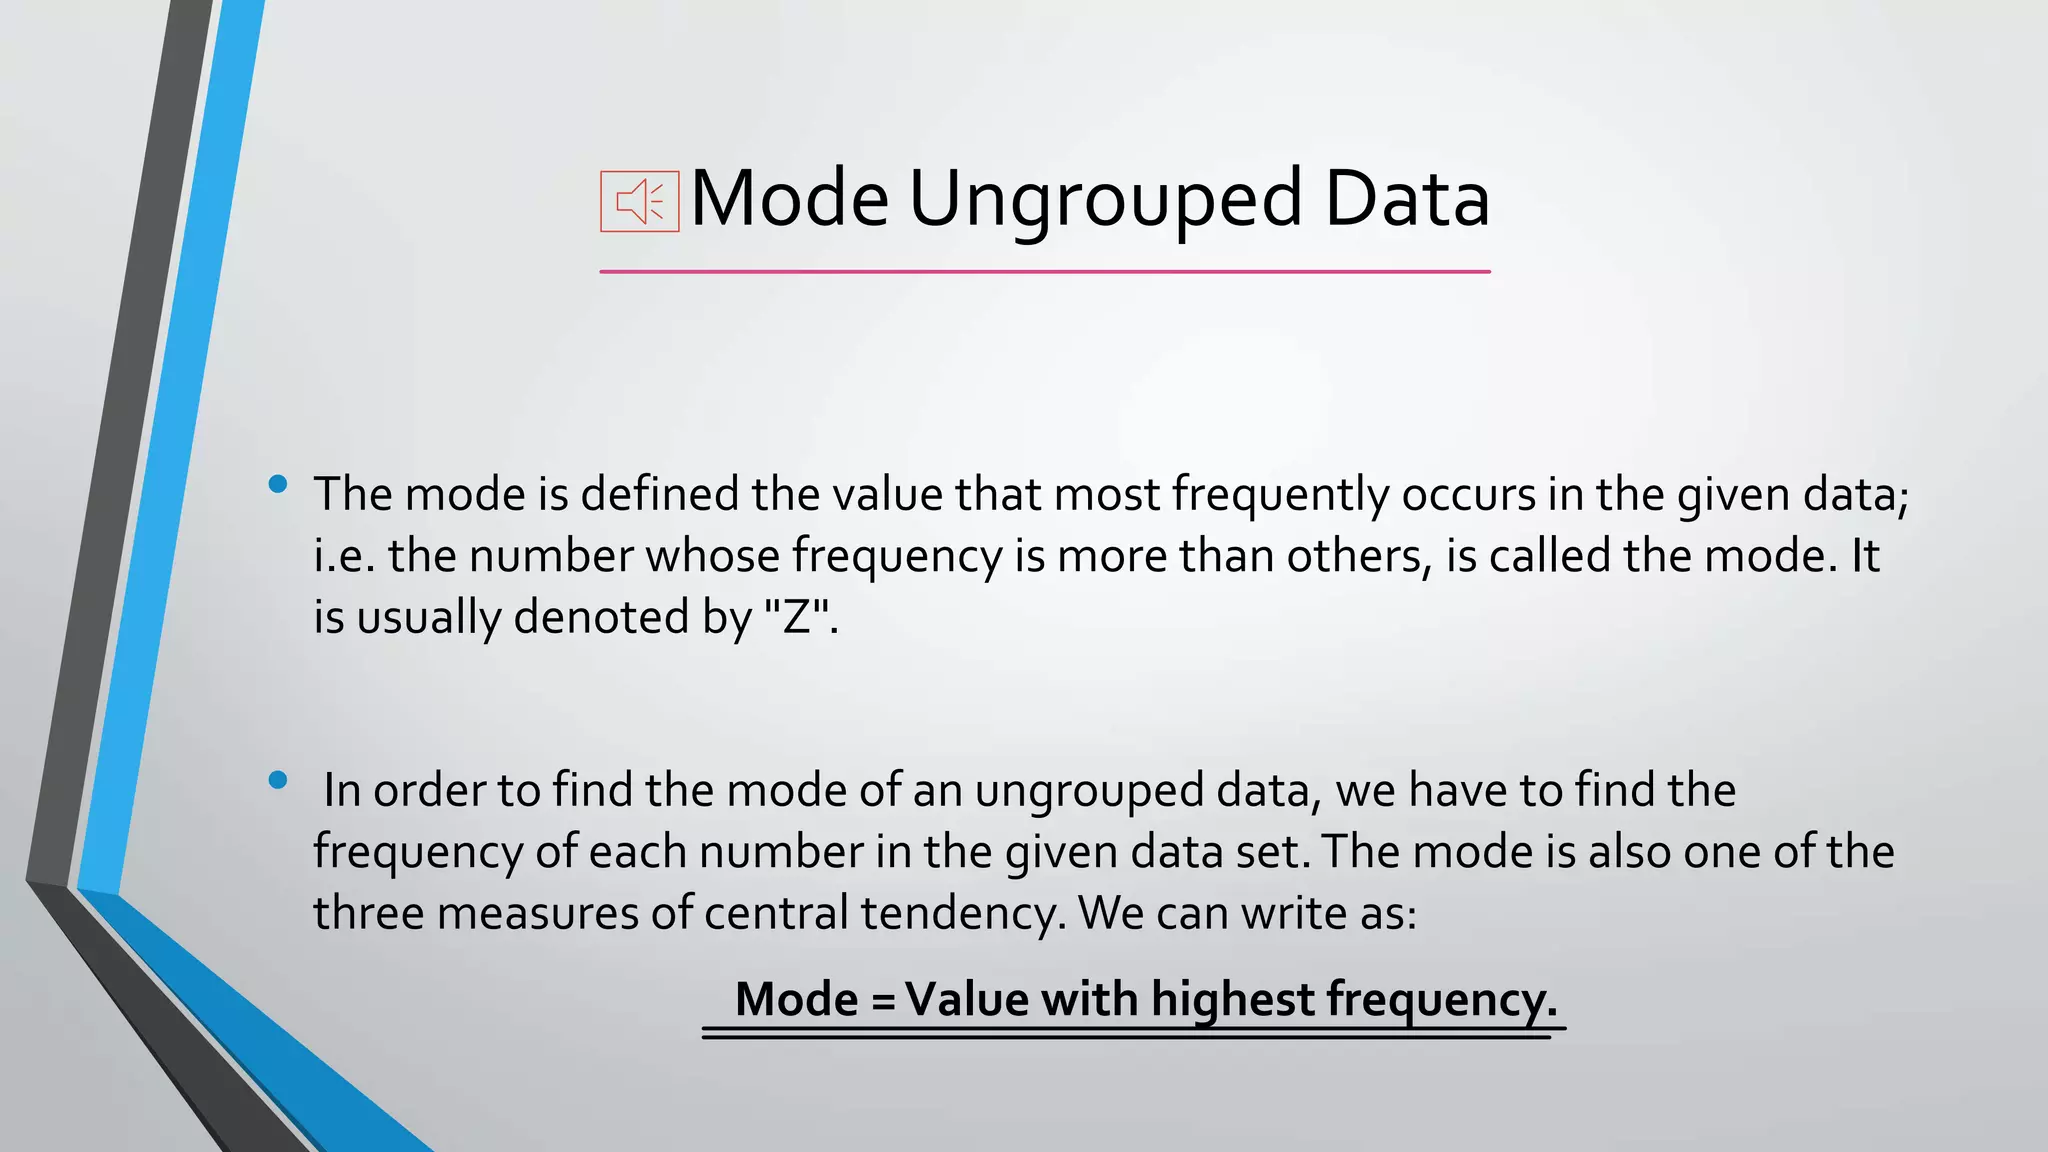
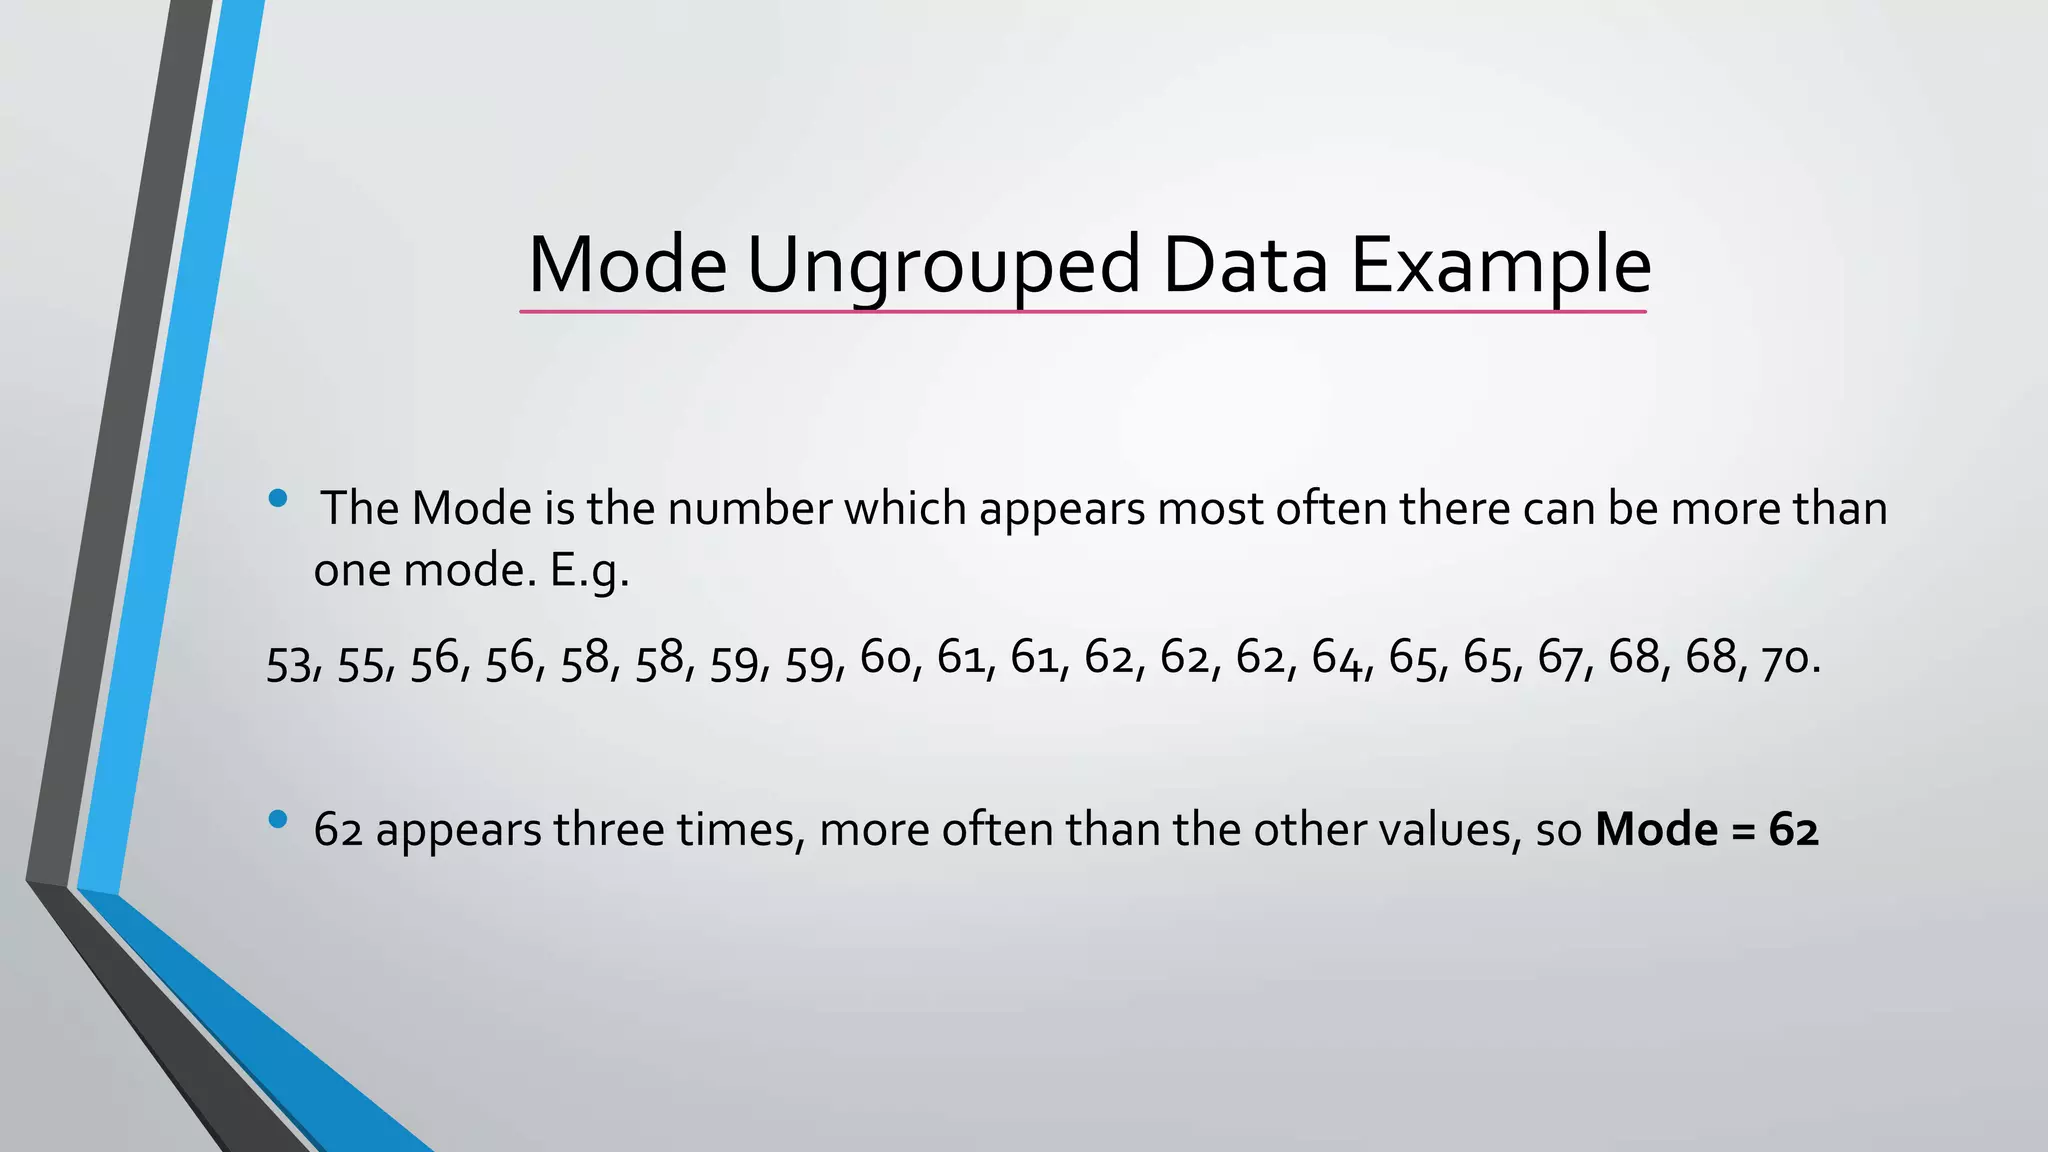
The mode of ungrouped data is the value that appears most frequently. For the example data set of 53, 55, 56, 56, 58, 58, 59, 59, 60, 61, 61, 62, 62, 62, 64, 65, 65, 67, 68, 68, 70, the mode is 62 as it appears three times while no other value appears more than twice. The mode is the value with the highest frequency and represents the data better than other central tendency measures as it is not affected by outliers.


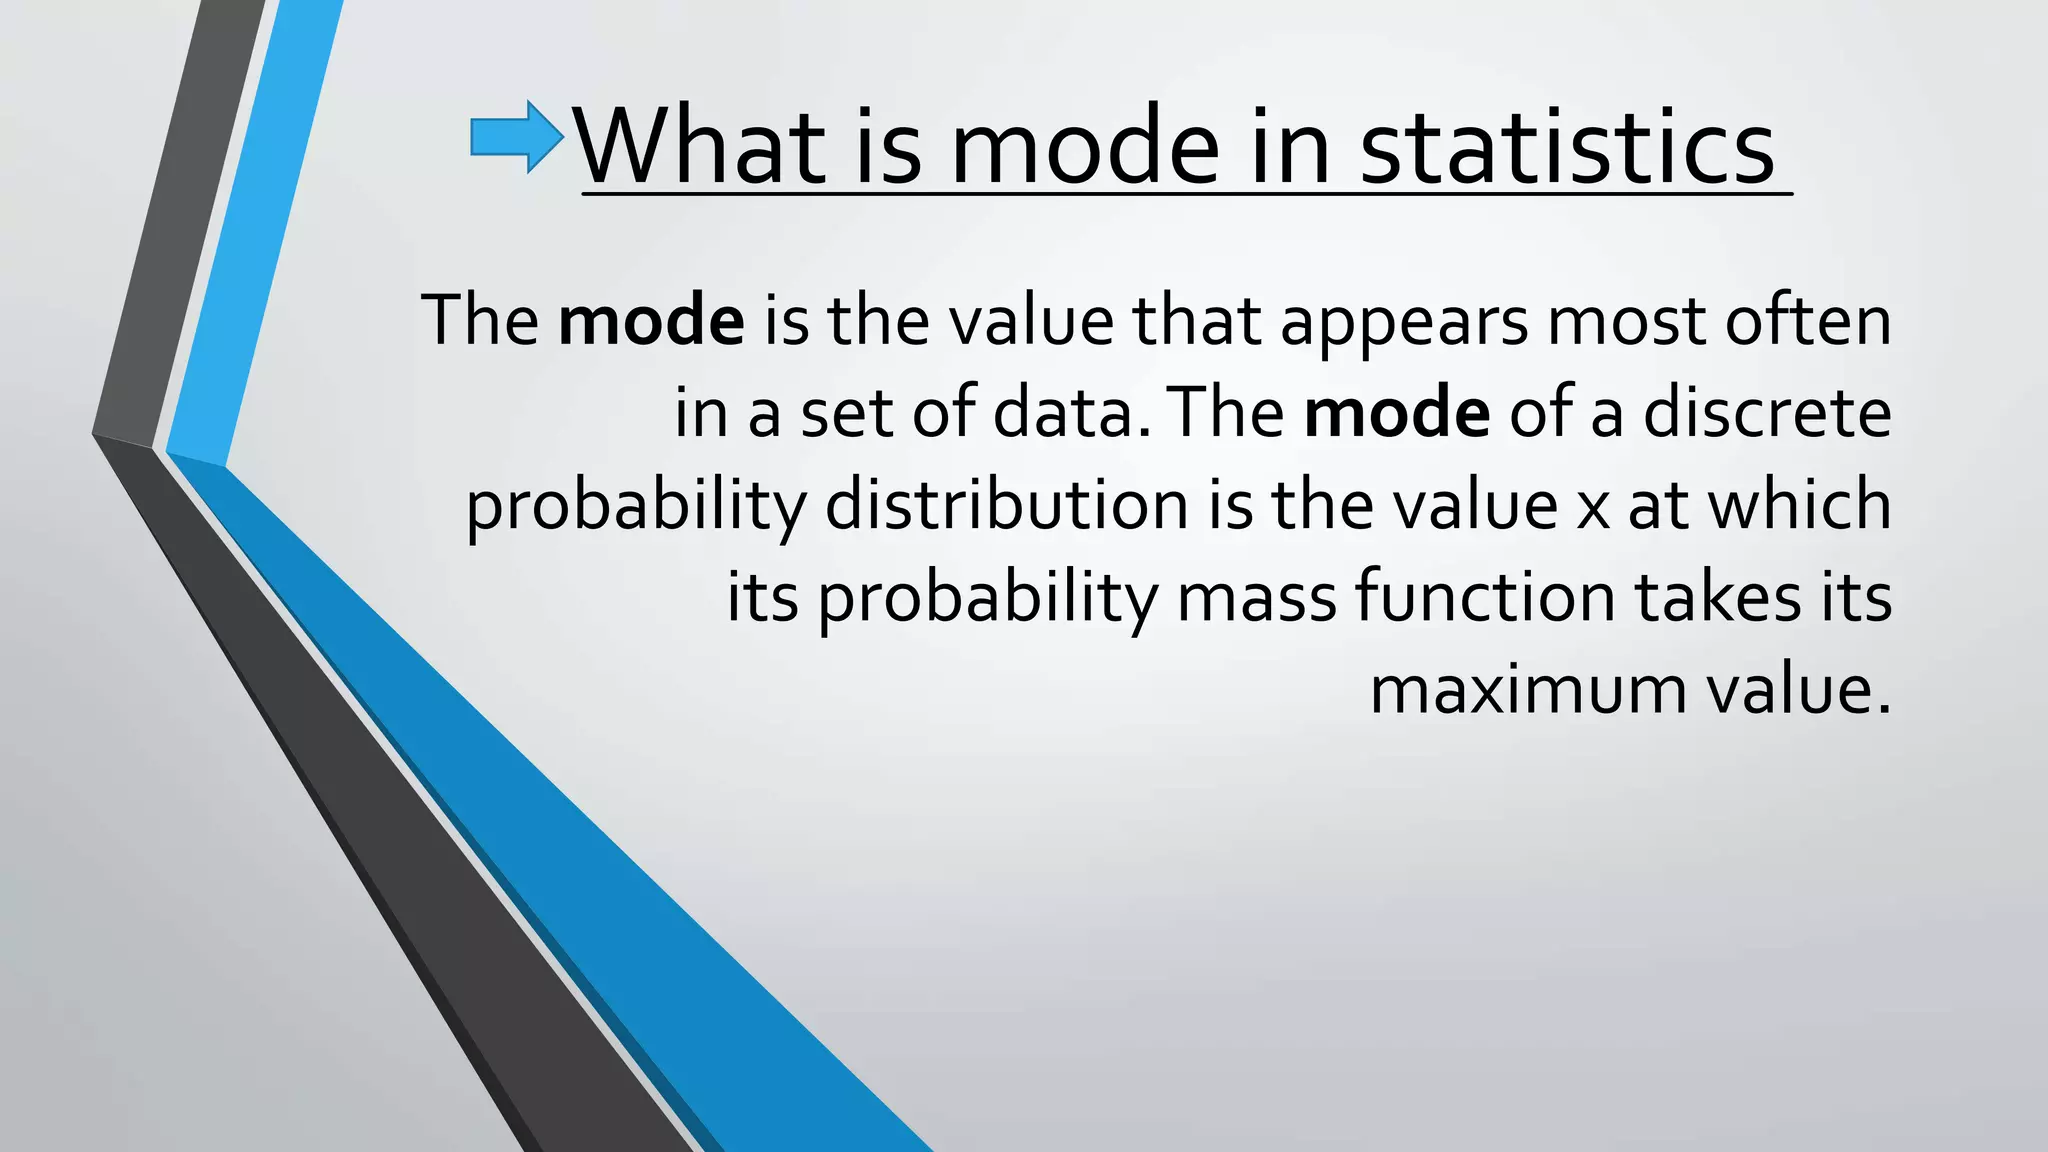
![Mode of a sample:
The mode of a sample is the element that occurs most
often in the collection. For example, the mode of the
sample [ 1, 3, 6, 6, 6, 6, 7, 7, 12, 12, 17] is 6.](https://image.slidesharecdn.com/modeungroupedata-170808192637/75/Mode-ungroupe-data-5-2048.jpg)


![PEREYRA, MARIA DANIELA [Autosaved].pptx](https://cdn.slidesharecdn.com/ss_thumbnails/pereyramariadanielaautosaved-230516073556-eb4f81b6-thumbnail.jpg?width=640&height=640&fit=bounds)


