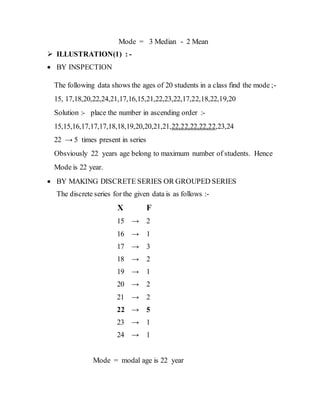
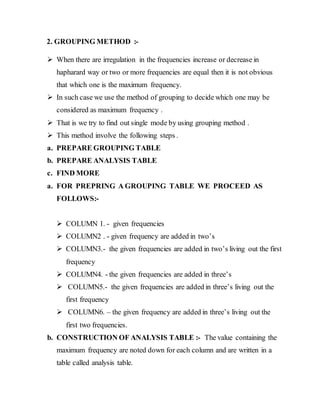
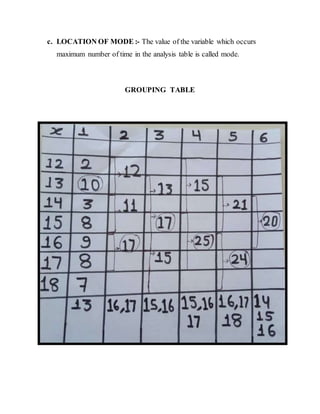
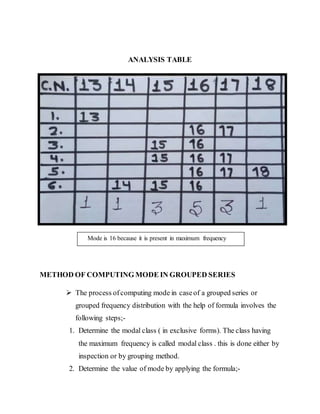
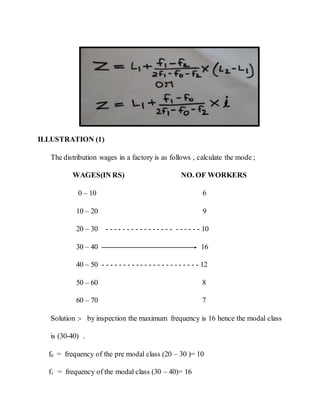
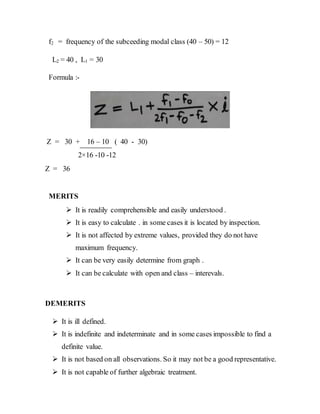
The document discusses the concept of mode in statistics. It defines mode as the value that occurs most frequently in a data set. It provides different methods to calculate the mode for individual data series, discrete series, and grouped series. These include inspection methods, making discrete series, using the mean and median formula, and grouping methods. The document also outlines some merits of using mode, such as being easily understood, as well as some demerits, such as it not being based on all observations. It concludes by discussing some uses of mode and providing a reference.
1. A
SEMINAR
ON
MODE
DR. R. K. RAO (PRINCIPAL) PRESENTEDBY
GUIDED BY - SHEETAL NIKITA DEWANGAN
GUPTA M.Sc. 2nd
SEM
BOITECHNOLOGY
G.D. RUNGTA COLLEGE OF SCIENCE & TECHNOLOGY
KOHKA - KURUD, BHILAI DURG (C.G.)
2. MODE
SYNOPSIS
INTRODUCTION
DEFINITION
METHODS OF COMPUTING MODE IN INDIVIDUAL SERIES
METHODS OF COMPUTING MODE IN DISCRETE SERIES
METHODS OF COMPUTING MODE IN GROUP SERIES
MERITS
DEMERITS
USES
REFRENCES
3. INTRODUCTION
The word mode is made from the French language LaMode , which
means fashion or system.
The value of the variable for which the frequency is maximum is called
mode or modal value and is denoted by Z or Mo.
DEFINITION
Mode is defined as the value of maximum frequency. If each value
occurs only once then there is no mode or all the values are modes.
If there are two or more values with maximum frequency, there may be
two or more modes. Such frequency distribution is called multi modal.
Thus a frequency distribution with two modes is called bimodal with
three modes is called trimodal.
METHODS OF COMPUTING MODE IN INDIVIDUAL SERIES
BY INSPECTION :- When the number of the observation is small
mode is obtained at a glance by looking which one of the observations
occurs most frequently.
BY MAKING DISCRETE SERIES OR GROUPED SERIES :- When
the number of observation is large convert the individual series into
discrete or grouped series and locate mode accordingly.
WITH HELP OF MEAN AND MEDIAN :- Using the empirical
formula.
4. Mode = 3 Median - 2 Mean
ILLUSTRATION(1) : -
BY INSPECTION
The following data shows the ages of 20 students in a class find the mode ;-
15, 17,18,20,22,24,21,17,16,15,21,22,23,22,17,22,18,22,19,20
Solution :- place the number in ascending order :-
15,15,16,17,17,17,18,18,19,20,20,21,21,22,22,22,22,22,23,24
22 → 5 times present in series
Obsviously 22 years age belong to maximum number of students. Hence
Mode is 22 year.
BY MAKING DISCRETE SERIES OR GROUPED SERIES
The discrete series for the given data is as follows :-
X F
15 → 2
16 → 1
17 → 3
18 → 2
19 → 1
20 → 2
21 → 2
22 → 5
23 → 1
24 → 1
Mode = modal age is 22 year
5. ILLUSTRATION (2)
WITH THE HELP OF MEAN AND MEDIAN
The following are the marks obtained by biotech student find the mode:-
2,0,9,15,11,17,19,21,22,23,25,26,27,28,31,32,33,34,35,45
Solution : - arrange the values in ascending order :-
0,2,9,11,15,17,19,21,22,23,25,26,27,28,31,32,33,34,35,45
Since each value occurs oncethere is no mode or all the values are mode.
However we can find the mode using the empirical formula;
Mode = 3 Median – 2 Mean
Arithimatic mean of these values;
X = ∑X / N
= 455 / 20
= 22.75
Median of these values;
M = 10th value + 11th value
2
23 + 25
2
= 24
Mode = 3 Median – 2 Mean
6. = 3 × 24 - 2 × 22.75
Mode = 26.50
METHODS OF COMPUTING MODE IN DISCRETESERIES:-
1. BY INSPECTION
2. BY GROUPING
1. BY INSPECTION METHOD :- When there is a regularity and
homogeneity in the series then there is a single mode which can be
located at a glance by looking into the frequency column for having
maximum frequency.
ILLUSTRATION (1)
BY INSPECTION
Find mode from the following series;-
Height (in cm) no. of person
150 2
160 4
170 8
180 10
190 6
200 5
210 3
Solution :- by inspection of the frequency it is noted that the maximum
frequency is 10 which corresponds to the value 180 hence mode is 180cm.
7. 2. GROUPING METHOD :-
When there are irregulation in the frequencies increase or decrease in
hapharard way or two or more frequencies are equal then it is not obvious
that which one is the maximum frequency.
In such case we use the method of grouping to decide which one may be
considered as maximum frequency .
That is we try to find out single mode by using grouping method .
This method involve the following steps .
a. PREPARE GROUPING TABLE
b. PREPARE ANALYSIS TABLE
c. FIND MORE
a. FOR PREPRING A GROUPING TABLE WE PROCEED AS
FOLLOWS:-
COLUMN 1. - given frequencies
COLUMN2 . - given frequency are added in two’s
COLUMN3.- the given frequencies are added in two’s living out the first
frequency
COLUMN4. - the given frequencies are added in three’s
COLUMN5.- the given frequencies are added in three’s living out the
first frequency
COLUMN6. – the given frequency are added in three’s living out the
first two frequencies.
b. CONSTRUCTION OF ANALYSIS TABLE :- The value containing the
maximum frequency are noted down for each column and are written in a
table called analysis table.
8. c. LOCATION OF MODE :- The value of the variable which occurs
maximum number of time in the analysis table is called mode.
GROUPING TABLE
9. ANALYSIS TABLE
METHOD OF COMPUTING MODE IN GROUPED SERIES
The process ofcomputing mode in caseof a grouped series or
grouped frequency distribution with the help of formula involves the
following steps;-
1. Determine the modal class ( in exclusive forms). The class having
the maximum frequency is called modal class . this is done either by
inspection or by grouping method.
2. Determine the value of mode by applying the formula;-
Mode is 16 because it is present in maximum frequency
10. ILLUSTRATION (1)
The distribution wages in a factory is as follows , calculate the mode ;
WAGES(IN RS) NO. OF WORKERS
0 – 10 6
10 – 20 9
20 – 30 - - - - - - - - - - - - - - - - - - - - - - 10
30 – 40 16
40 – 50 - - - - - - - - - - - - - - - - - - - - - - - 12
50 – 60 8
60 – 70 7
Solution :- by inspection the maximum frequency is 16 hence the modal class
is (30-40) .
f0 = frequency of the pre modal class (20 – 30 )= 10
f1 = frequency of the modal class (30 – 40)= 16
11. f2 = frequency of the subceeding modal class (40 – 50) = 12
L2 = 40 , L1 = 30
Formula :-
Z = 30 + 16 – 10 ( 40 - 30)
2×16 -10 -12
Z = 36
MERITS
It is readily comprehensible and easily understood .
It is easy to calculate . in some cases it is located by inspection.
It is not affected by extreme values, provided they do not have
maximum frequency.
It can be very easily determine from graph .
It can be calculate with open and class – interevals.
DEMERITS
It is ill defined.
It is indefinite and indeterminate and in some cases impossible to find a
definite value.
It is not based on all observations. So it may not be a good representative.
It is not capable of further algebraic treatment.
12. Sometimes there can be more than ane mode and sometime there is no
mode in the data.
As compared to mean , it is affected to a greater extent by fluctuations of
sampling.
USES
When a quick and approximate measure of central tendency is desired.
When the measure of central tendency should be the most typical value.
REFRENCES
Dr. S. M. Shukla Business Statistics