Downloaded 100 times


![Phenotypic Characteristics
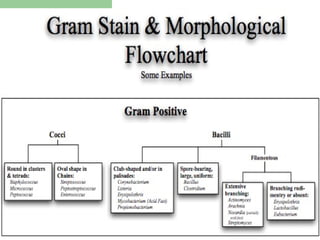
Microscopy: Gram stain, acid-fast stain, cell
morphology, cell arrangements.
Colony morphology: size, color, border shape, etc.
Growth on Differential media: blood agar, MacConkey
agar, etc.
Growth on Selective/Differential media: MacConkey
agar, EMB agar, etc.
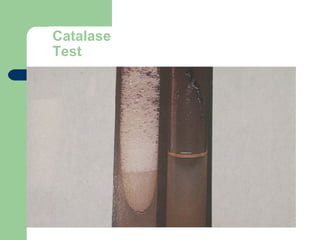
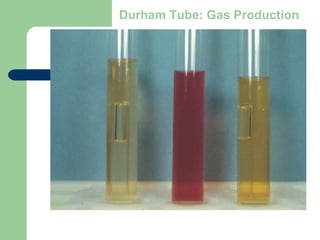
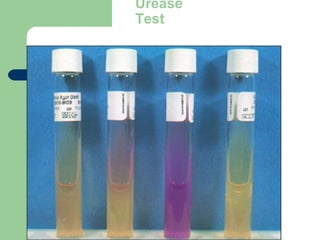
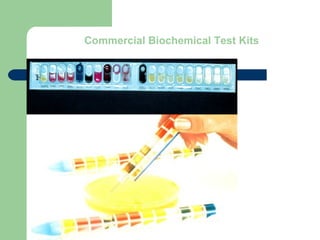
Biochemical tests: “Most biochemical tests rely on a
pH indicator or chemical reaction that results in a
color change [or gas production] when a [specific]
compound is degraded.”](https://image.slidesharecdn.com/6kp4xq4eqt6dbdni5yhj-signature-2127a2ca5368c7fdfd023e8d90dde3fc0b9fe7d91346a4189562c9f63dc0d19d-poli-150819190754-lva1-app6891/85/Micro-classification-of-prokaryotes-15-320.jpg)
![[Micro] classification of prokaryotes](https://image.slidesharecdn.com/6kp4xq4eqt6dbdni5yhj-signature-2127a2ca5368c7fdfd023e8d90dde3fc0b9fe7d91346a4189562c9f63dc0d19d-poli-150819190754-lva1-app6891/85/Micro-classification-of-prokaryotes-30-320.jpg)

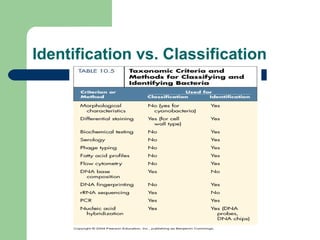
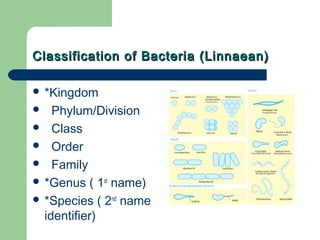
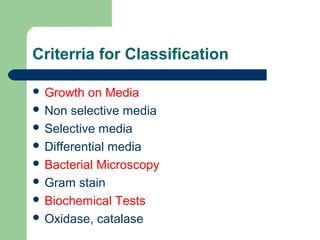
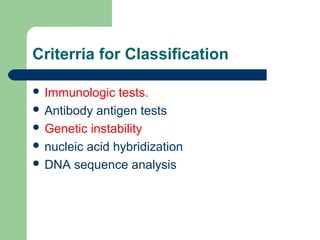
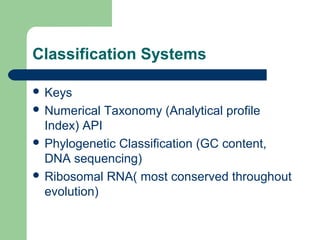
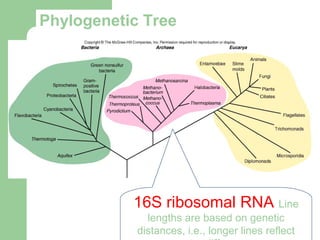
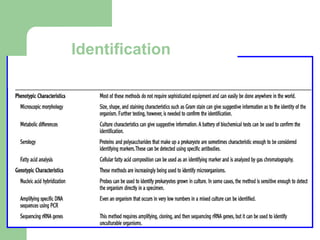
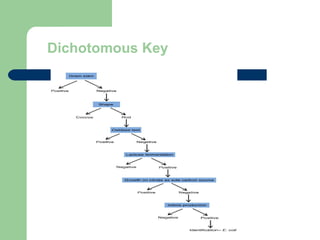
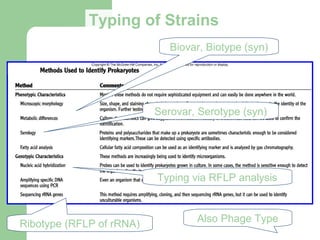
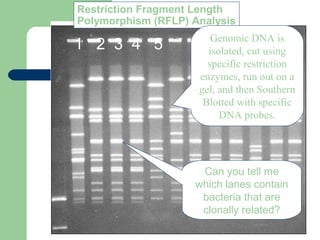
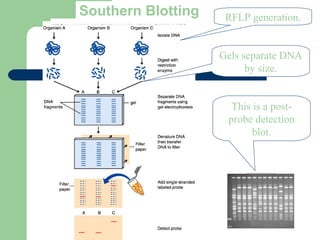
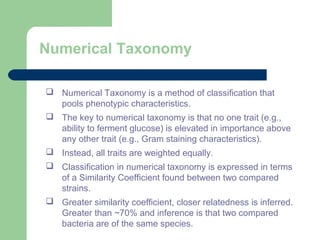
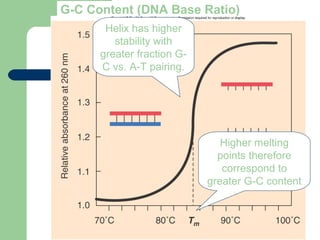
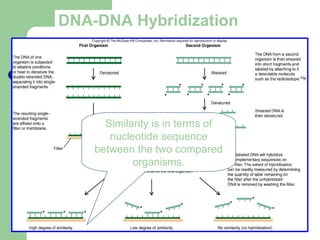
This document discusses the classification and identification of prokaryotes. It begins by introducing bacterial taxonomy and classification, which involves grouping organisms with similar properties. Identification involves characterizing organisms using phenotypic characteristics like microscopy, colony morphology, and biochemical tests. It then discusses various classification systems like the Linnaean taxonomy and phylogenetic trees based on 16S ribosomal RNA. Identification can be done using tests on differential and selective media, as well as techniques like PCR, DNA-DNA hybridization, and restriction fragment length polymorphism analysis.


![[Micro] syphilis](https://cdn.slidesharecdn.com/ss_thumbnails/loot4qpwrfcwmtl9jo3e-signature-2127a2ca5368c7fdfd023e8d90dde3fc0b9fe7d91346a4189562c9f63dc0d19d-poli-150819190755-lva1-app6892-thumbnail.jpg?width=640&height=640&fit=bounds)
![[Micro] sterilization](https://cdn.slidesharecdn.com/ss_thumbnails/jtli2uutrkcchg3xbjaw-signature-2127a2ca5368c7fdfd023e8d90dde3fc0b9fe7d91346a4189562c9f63dc0d19d-poli-150819190755-lva1-app6891-thumbnail.jpg?width=640&height=640&fit=bounds)
![[Micro] mycobacterium tuberculosis](https://cdn.slidesharecdn.com/ss_thumbnails/knwspassdmixhofx5ycy-signature-2127a2ca5368c7fdfd023e8d90dde3fc0b9fe7d91346a4189562c9f63dc0d19d-poli-150819190755-lva1-app6891-thumbnail.jpg?width=640&height=640&fit=bounds)
![[Micro] pathogenesis](https://cdn.slidesharecdn.com/ss_thumbnails/reicxvotaytkxx8xnaam-signature-2127a2ca5368c7fdfd023e8d90dde3fc0b9fe7d91346a4189562c9f63dc0d19d-poli-150819190755-lva1-app6891-thumbnail.jpg?width=640&height=640&fit=bounds)
![[Micro] parvovirus](https://cdn.slidesharecdn.com/ss_thumbnails/9efvufm6tsedx9o58t7q-signature-2127a2ca5368c7fdfd023e8d90dde3fc0b9fe7d91346a4189562c9f63dc0d19d-poli-150819190755-lva1-app6891-thumbnail.jpg?width=640&height=640&fit=bounds)
![[Micro] hymenolepis nana](https://cdn.slidesharecdn.com/ss_thumbnails/3rxjz7ekrwinb1sq3uxs-signature-2127a2ca5368c7fdfd023e8d90dde3fc0b9fe7d91346a4189562c9f63dc0d19d-poli-150819190755-lva1-app6892-thumbnail.jpg?width=640&height=640&fit=bounds)
![[Micro] gram positive spore bearing rods](https://cdn.slidesharecdn.com/ss_thumbnails/xi8ojr00samkfuo2qtsz-signature-2127a2ca5368c7fdfd023e8d90dde3fc0b9fe7d91346a4189562c9f63dc0d19d-poli-150819190754-lva1-app6892-thumbnail.jpg?width=640&height=640&fit=bounds)
![[Micro] opportunistic mycosis](https://cdn.slidesharecdn.com/ss_thumbnails/r9htdghqrikznf5hrtly-signature-2127a2ca5368c7fdfd023e8d90dde3fc0b9fe7d91346a4189562c9f63dc0d19d-poli-150819190754-lva1-app6891-thumbnail.jpg?width=640&height=640&fit=bounds)
![[Micro] mycobacterium leprae](https://cdn.slidesharecdn.com/ss_thumbnails/i6vamgi4rq2srkk4yof7-signature-2127a2ca5368c7fdfd023e8d90dde3fc0b9fe7d91346a4189562c9f63dc0d19d-poli-150819190754-lva1-app6892-thumbnail.jpg?width=640&height=640&fit=bounds)
![[Micro] aspergillus](https://cdn.slidesharecdn.com/ss_thumbnails/f74upwejq4u9rqvunxal-signature-2127a2ca5368c7fdfd023e8d90dde3fc0b9fe7d91346a4189562c9f63dc0d19d-poli-150819190754-lva1-app6892-thumbnail.jpg?width=640&height=640&fit=bounds)
![[Micro] growth and culturing of bacteria](https://cdn.slidesharecdn.com/ss_thumbnails/xfkdsyhfs92guomky6hu-signature-2127a2ca5368c7fdfd023e8d90dde3fc0b9fe7d91346a4189562c9f63dc0d19d-poli-150819190754-lva1-app6892-thumbnail.jpg?width=640&height=640&fit=bounds)
![[Micro] chemical sterilizaton](https://cdn.slidesharecdn.com/ss_thumbnails/xwi6imyrrchg97geohxj-signature-2127a2ca5368c7fdfd023e8d90dde3fc0b9fe7d91346a4189562c9f63dc0d19d-poli-150819190754-lva1-app6891-thumbnail.jpg?width=640&height=640&fit=bounds)
![[Micro] clostridia](https://cdn.slidesharecdn.com/ss_thumbnails/rosblh0htbiwcq9fv3y4-signature-2127a2ca5368c7fdfd023e8d90dde3fc0b9fe7d91346a4189562c9f63dc0d19d-poli-150819190754-lva1-app6891-thumbnail.jpg?width=640&height=640&fit=bounds)
![[Micro] bacterial genetics (6 jan)](https://cdn.slidesharecdn.com/ss_thumbnails/capdzkrqktd9kgwl1skw-signature-2127a2ca5368c7fdfd023e8d90dde3fc0b9fe7d91346a4189562c9f63dc0d19d-poli-150819190753-lva1-app6892-thumbnail.jpg?width=640&height=640&fit=bounds)
![[Micro] bacterial selective & differential media](https://cdn.slidesharecdn.com/ss_thumbnails/inykegaks3iuut4oc1pw-signature-2127a2ca5368c7fdfd023e8d90dde3fc0b9fe7d91346a4189562c9f63dc0d19d-poli-150819190753-lva1-app6891-thumbnail.jpg?width=640&height=640&fit=bounds)
![[Micro] cestodes](https://cdn.slidesharecdn.com/ss_thumbnails/nvpl1fbyq2ofjfsbmped-signature-2127a2ca5368c7fdfd023e8d90dde3fc0b9fe7d91346a4189562c9f63dc0d19d-poli-150819190753-lva1-app6892-thumbnail.jpg?width=640&height=640&fit=bounds)
![[Micro] atypical mycobacterium](https://cdn.slidesharecdn.com/ss_thumbnails/7d5djanirg26boloifek-signature-2127a2ca5368c7fdfd023e8d90dde3fc0b9fe7d91346a4189562c9f63dc0d19d-poli-150819190753-lva1-app6891-thumbnail.jpg?width=640&height=640&fit=bounds)
![[Micro] bacterial genetics (12 jan)](https://cdn.slidesharecdn.com/ss_thumbnails/ybiw66hrget4bdnxz447-signature-2127a2ca5368c7fdfd023e8d90dde3fc0b9fe7d91346a4189562c9f63dc0d19d-poli-150819190753-lva1-app6892-thumbnail.jpg?width=640&height=640&fit=bounds)
![[Micro] adenoviruses](https://cdn.slidesharecdn.com/ss_thumbnails/rqzzph7ktam2nsjysnxg-signature-2127a2ca5368c7fdfd023e8d90dde3fc0b9fe7d91346a4189562c9f63dc0d19d-poli-150819190753-lva1-app6891-thumbnail.jpg?width=640&height=640&fit=bounds)
![[Micro] actinomyces](https://cdn.slidesharecdn.com/ss_thumbnails/9ecmrhoqrkocvbxkfudx-signature-2127a2ca5368c7fdfd023e8d90dde3fc0b9fe7d91346a4189562c9f63dc0d19d-poli-150819190753-lva1-app6892-thumbnail.jpg?width=640&height=640&fit=bounds)