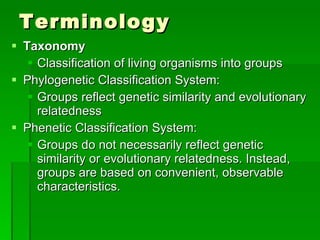
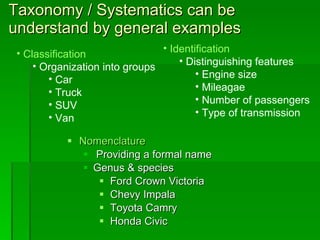
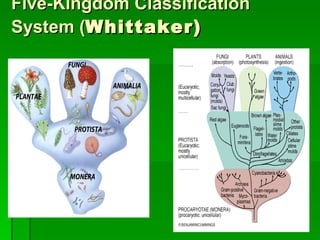
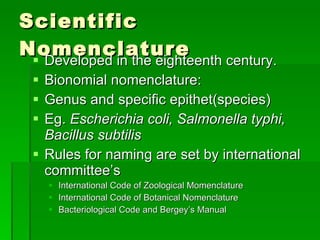
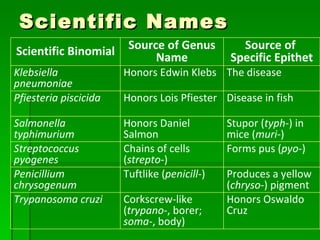
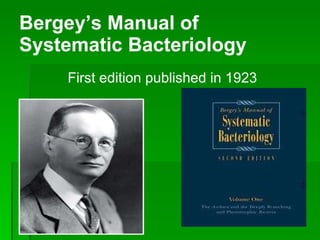
The document discusses the classification of microorganisms. It covers terminology used in taxonomy, provides a brief history of taxonomy, and describes various methods used for microbial classification including morphological, biochemical, genetic, and numerical methods. The intuitive method relies on expert opinion while genetic methods include analyzing the G+C content of DNA and performing nucleic acid hybridization and sequencing to determine genetic relatedness.


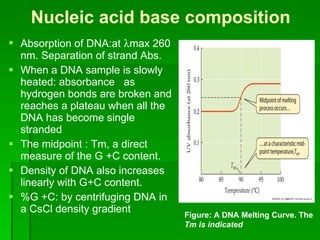
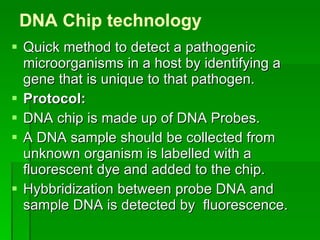
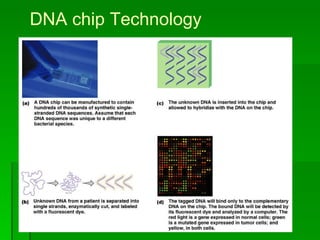
![Nucleic acid base composition DNA contains four purine and pyrimidine bases: A, G, C, T. (G+C)/(A+T) ratio or G+C content, % of G+C in DNA, reflects the base. Mol % (G+C)= [(G+C)/(G+C+A+T)]*100 Estimated by determining the melting temperature of the DNA Higher G + C gives a higher melting temperature Methods to determine base composition 1.HPLC: Hydrolyse the DNA & Analyse with HPLC 2.Melting temperature (T m ): double stranded DNA, A=T, G = C, High G +C = high melting point.](https://image.slidesharecdn.com/classificationofmicroorganismslecturenotebyrmpatel-110924051904-phpapp02/85/Classification-of-microorganisms-lecture-note-by-rm-patel-33-320.jpg)