Downloaded 161 times

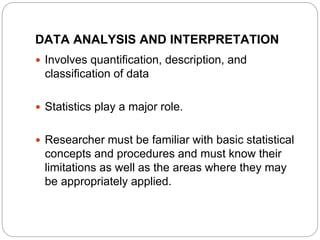
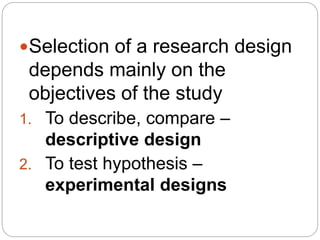

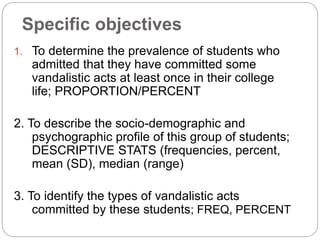
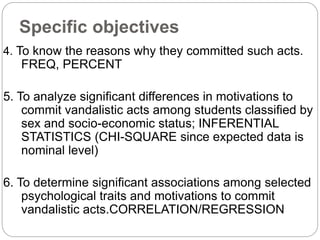
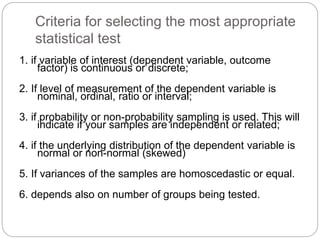
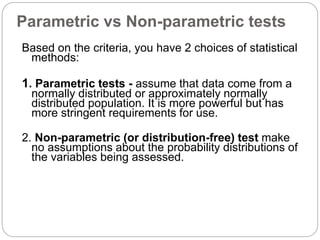
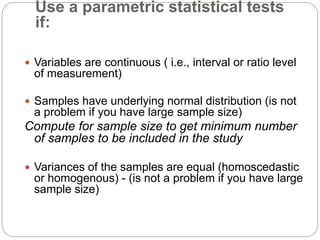
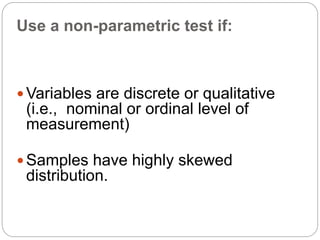
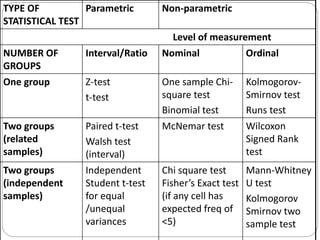
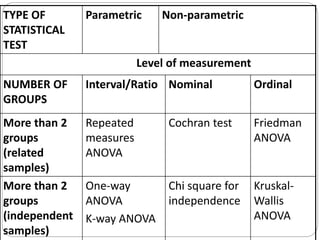
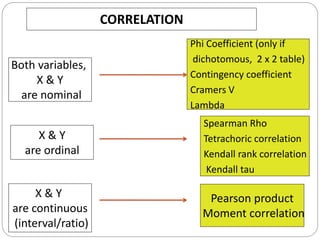
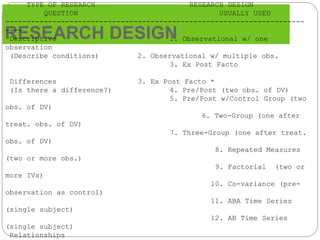
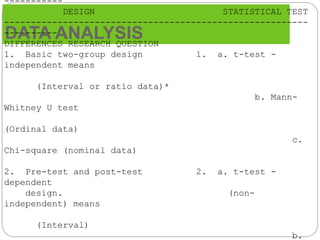
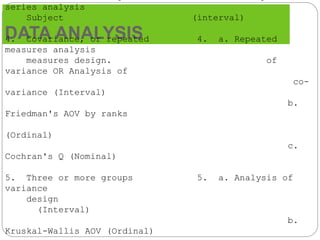

This document discusses research methodology and design. It covers key aspects of research design including selecting subjects, controlling variables, establishing evaluation criteria, and ensuring internal and external validity. Factors to consider in research design are the objectives, feasibility, ethics, efficiency, and validity. The document also outlines steps in the research process such as developing data collection tools, planning analysis, collecting and processing data, conducting analysis and interpretation. Statistical tests are matched to different research designs and levels of measurement.


![Plant growth and development [compatibility mode]](https://cdn.slidesharecdn.com/ss_thumbnails/plantgrowthanddevelopmentcompatibilitymode-130903083906--thumbnail.jpg?width=640&height=640&fit=bounds)


![Eudicots summer2013 [compatibility mode]](https://cdn.slidesharecdn.com/ss_thumbnails/eudicotssummer2013compatibilitymode-130520042426-phpapp02-thumbnail.jpg?width=640&height=640&fit=bounds)


