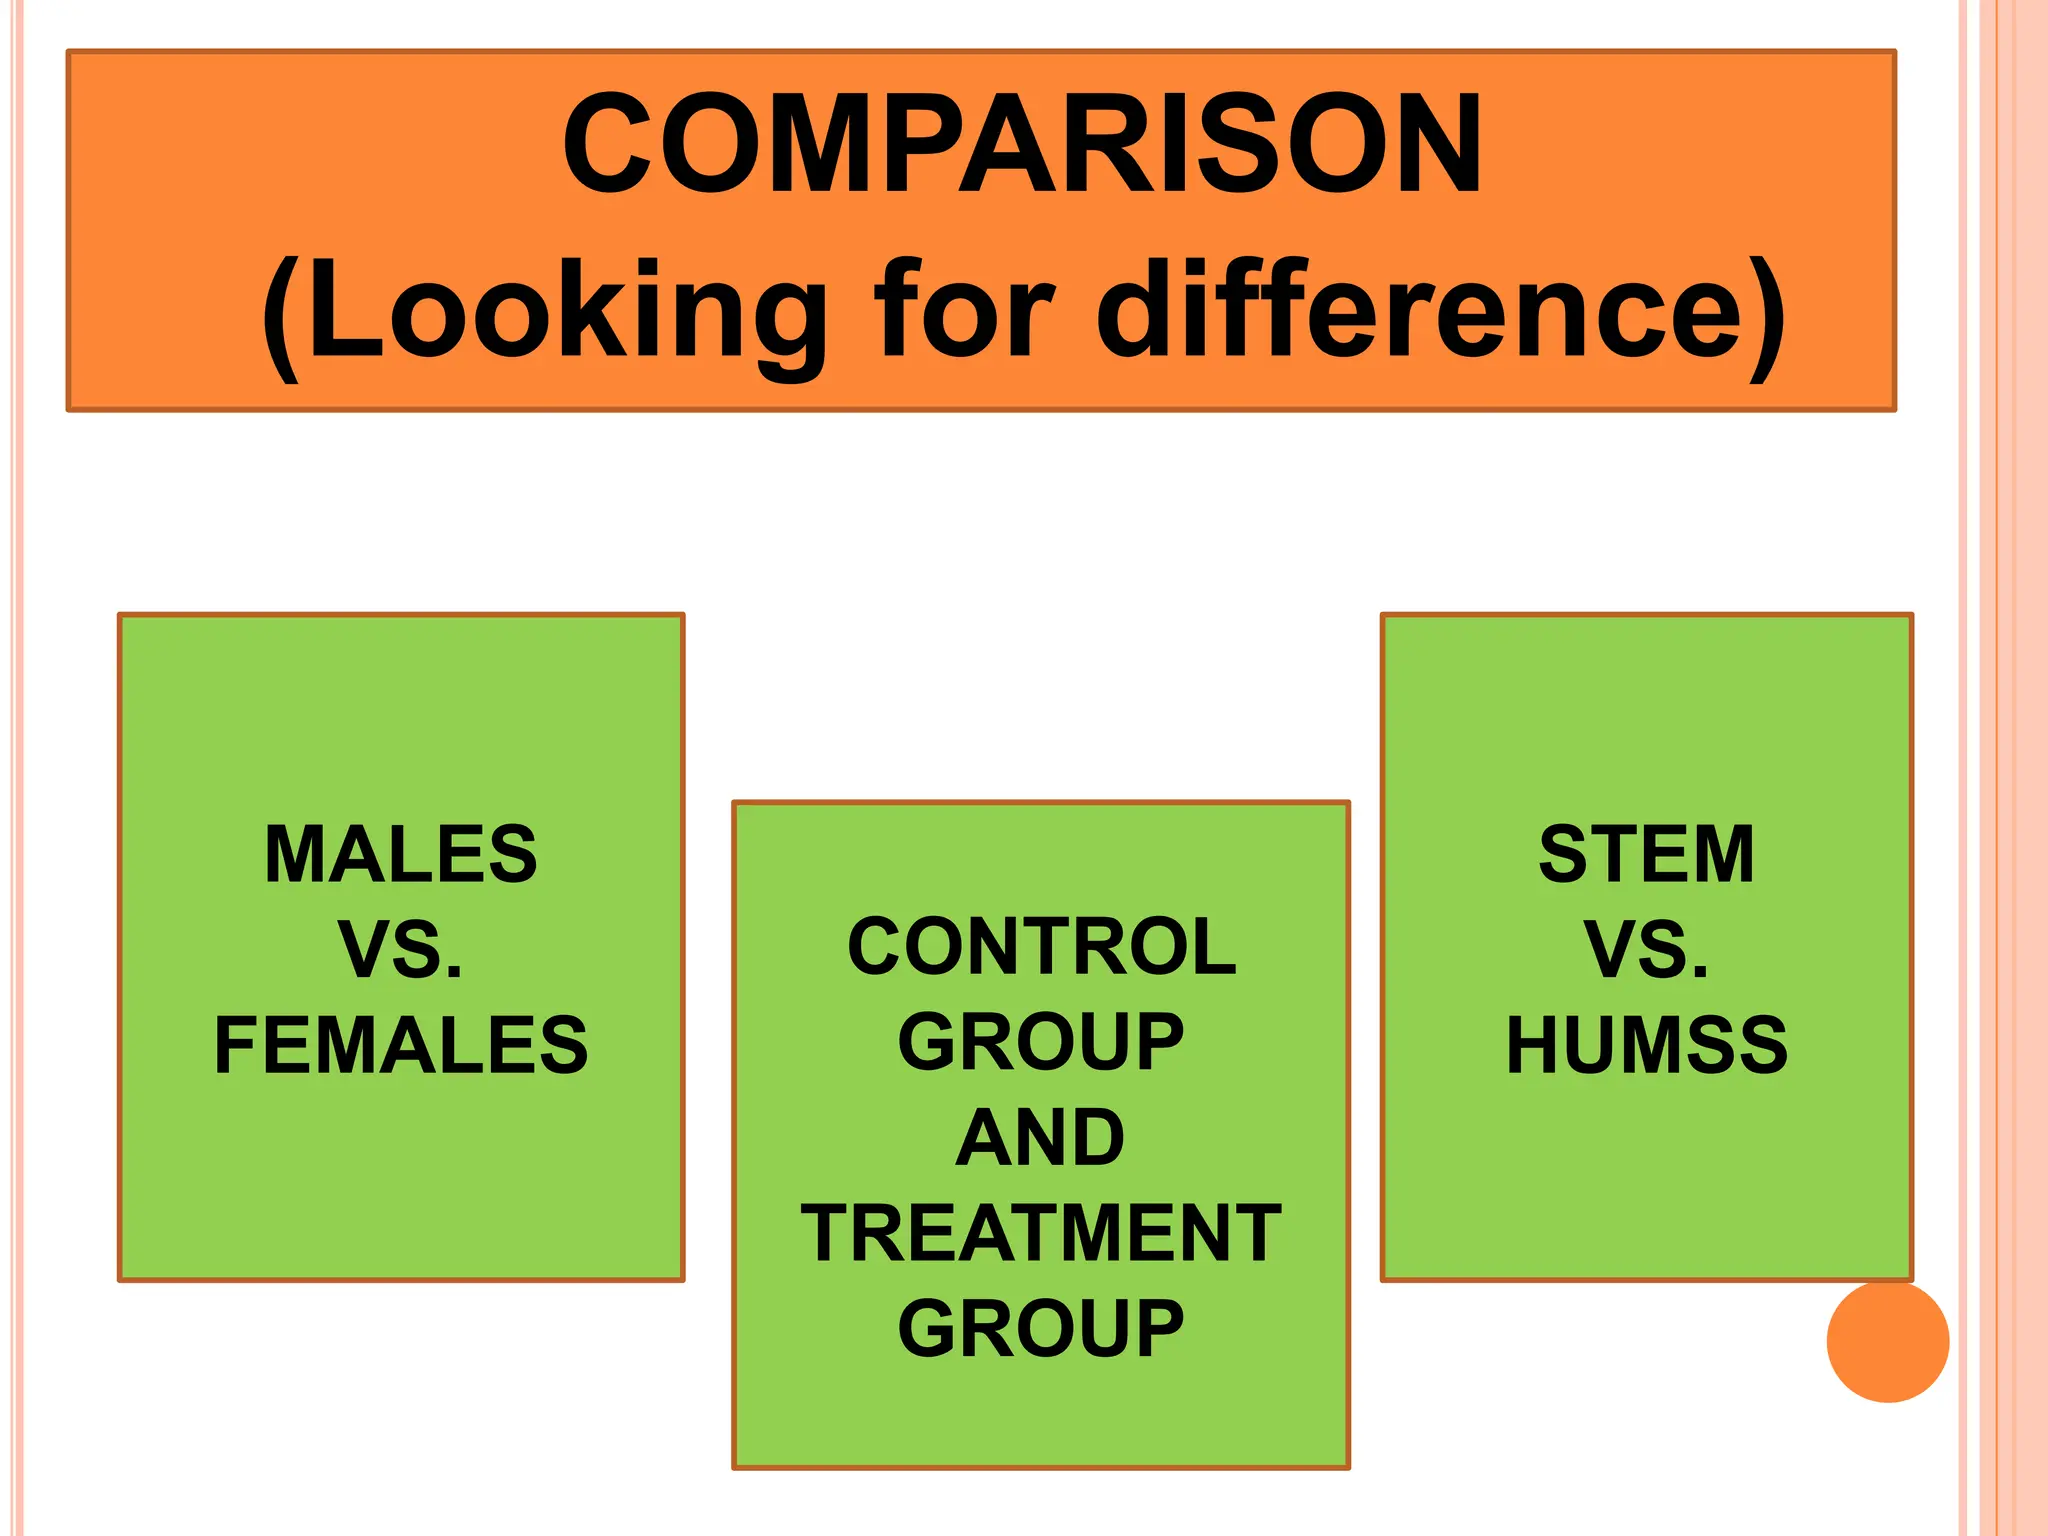
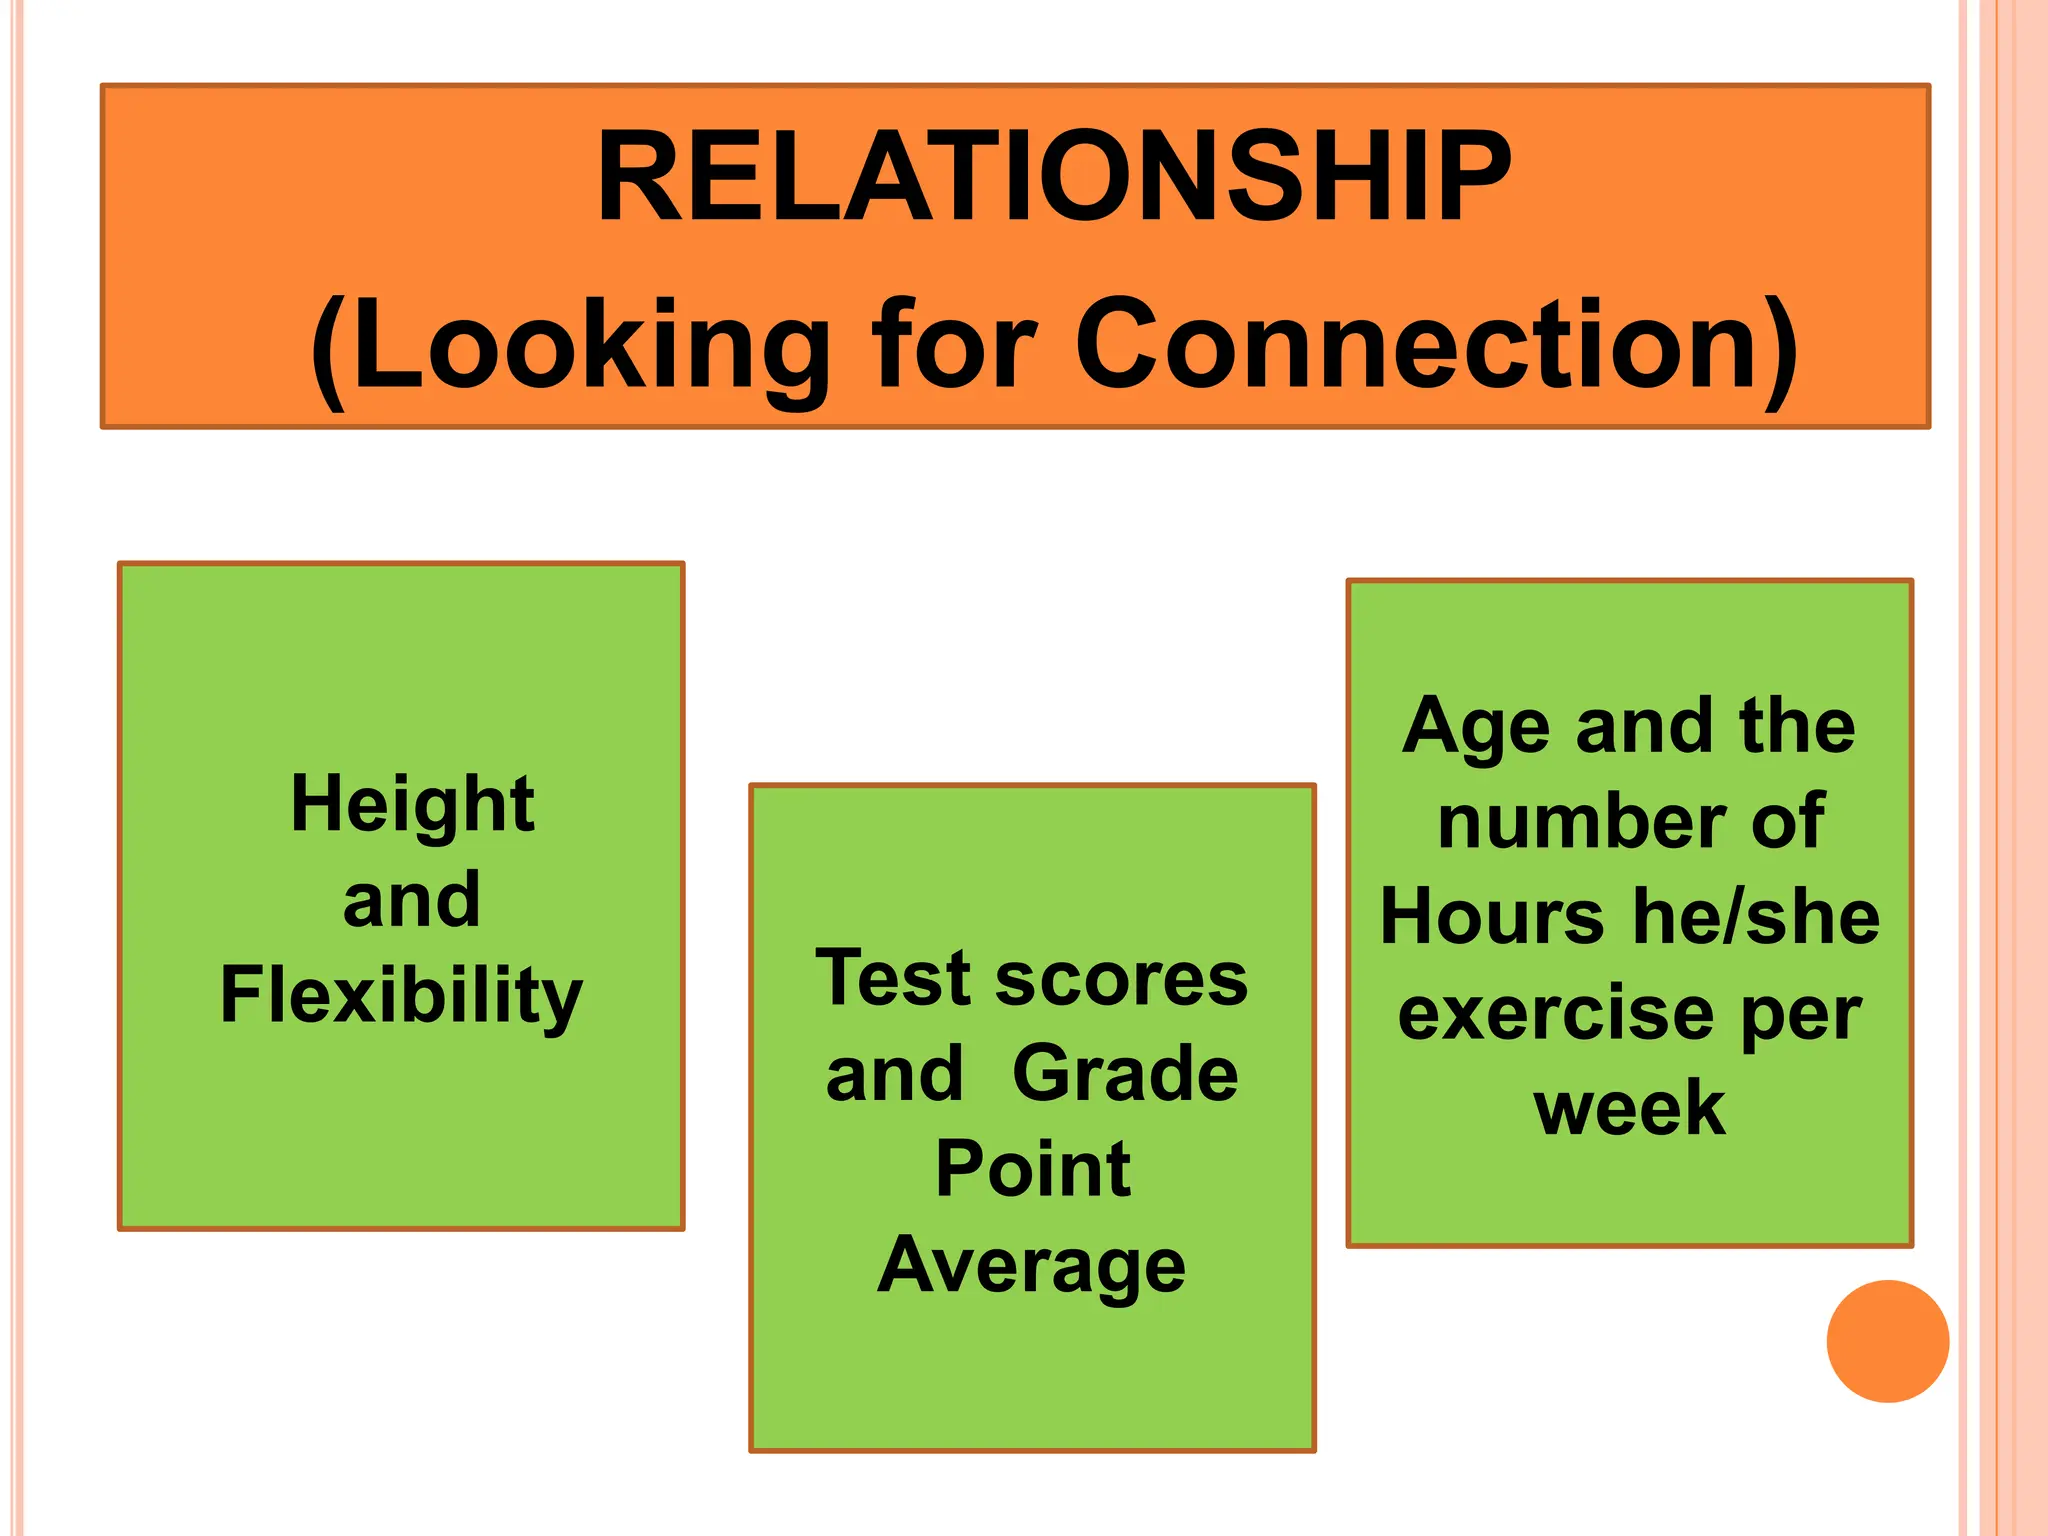
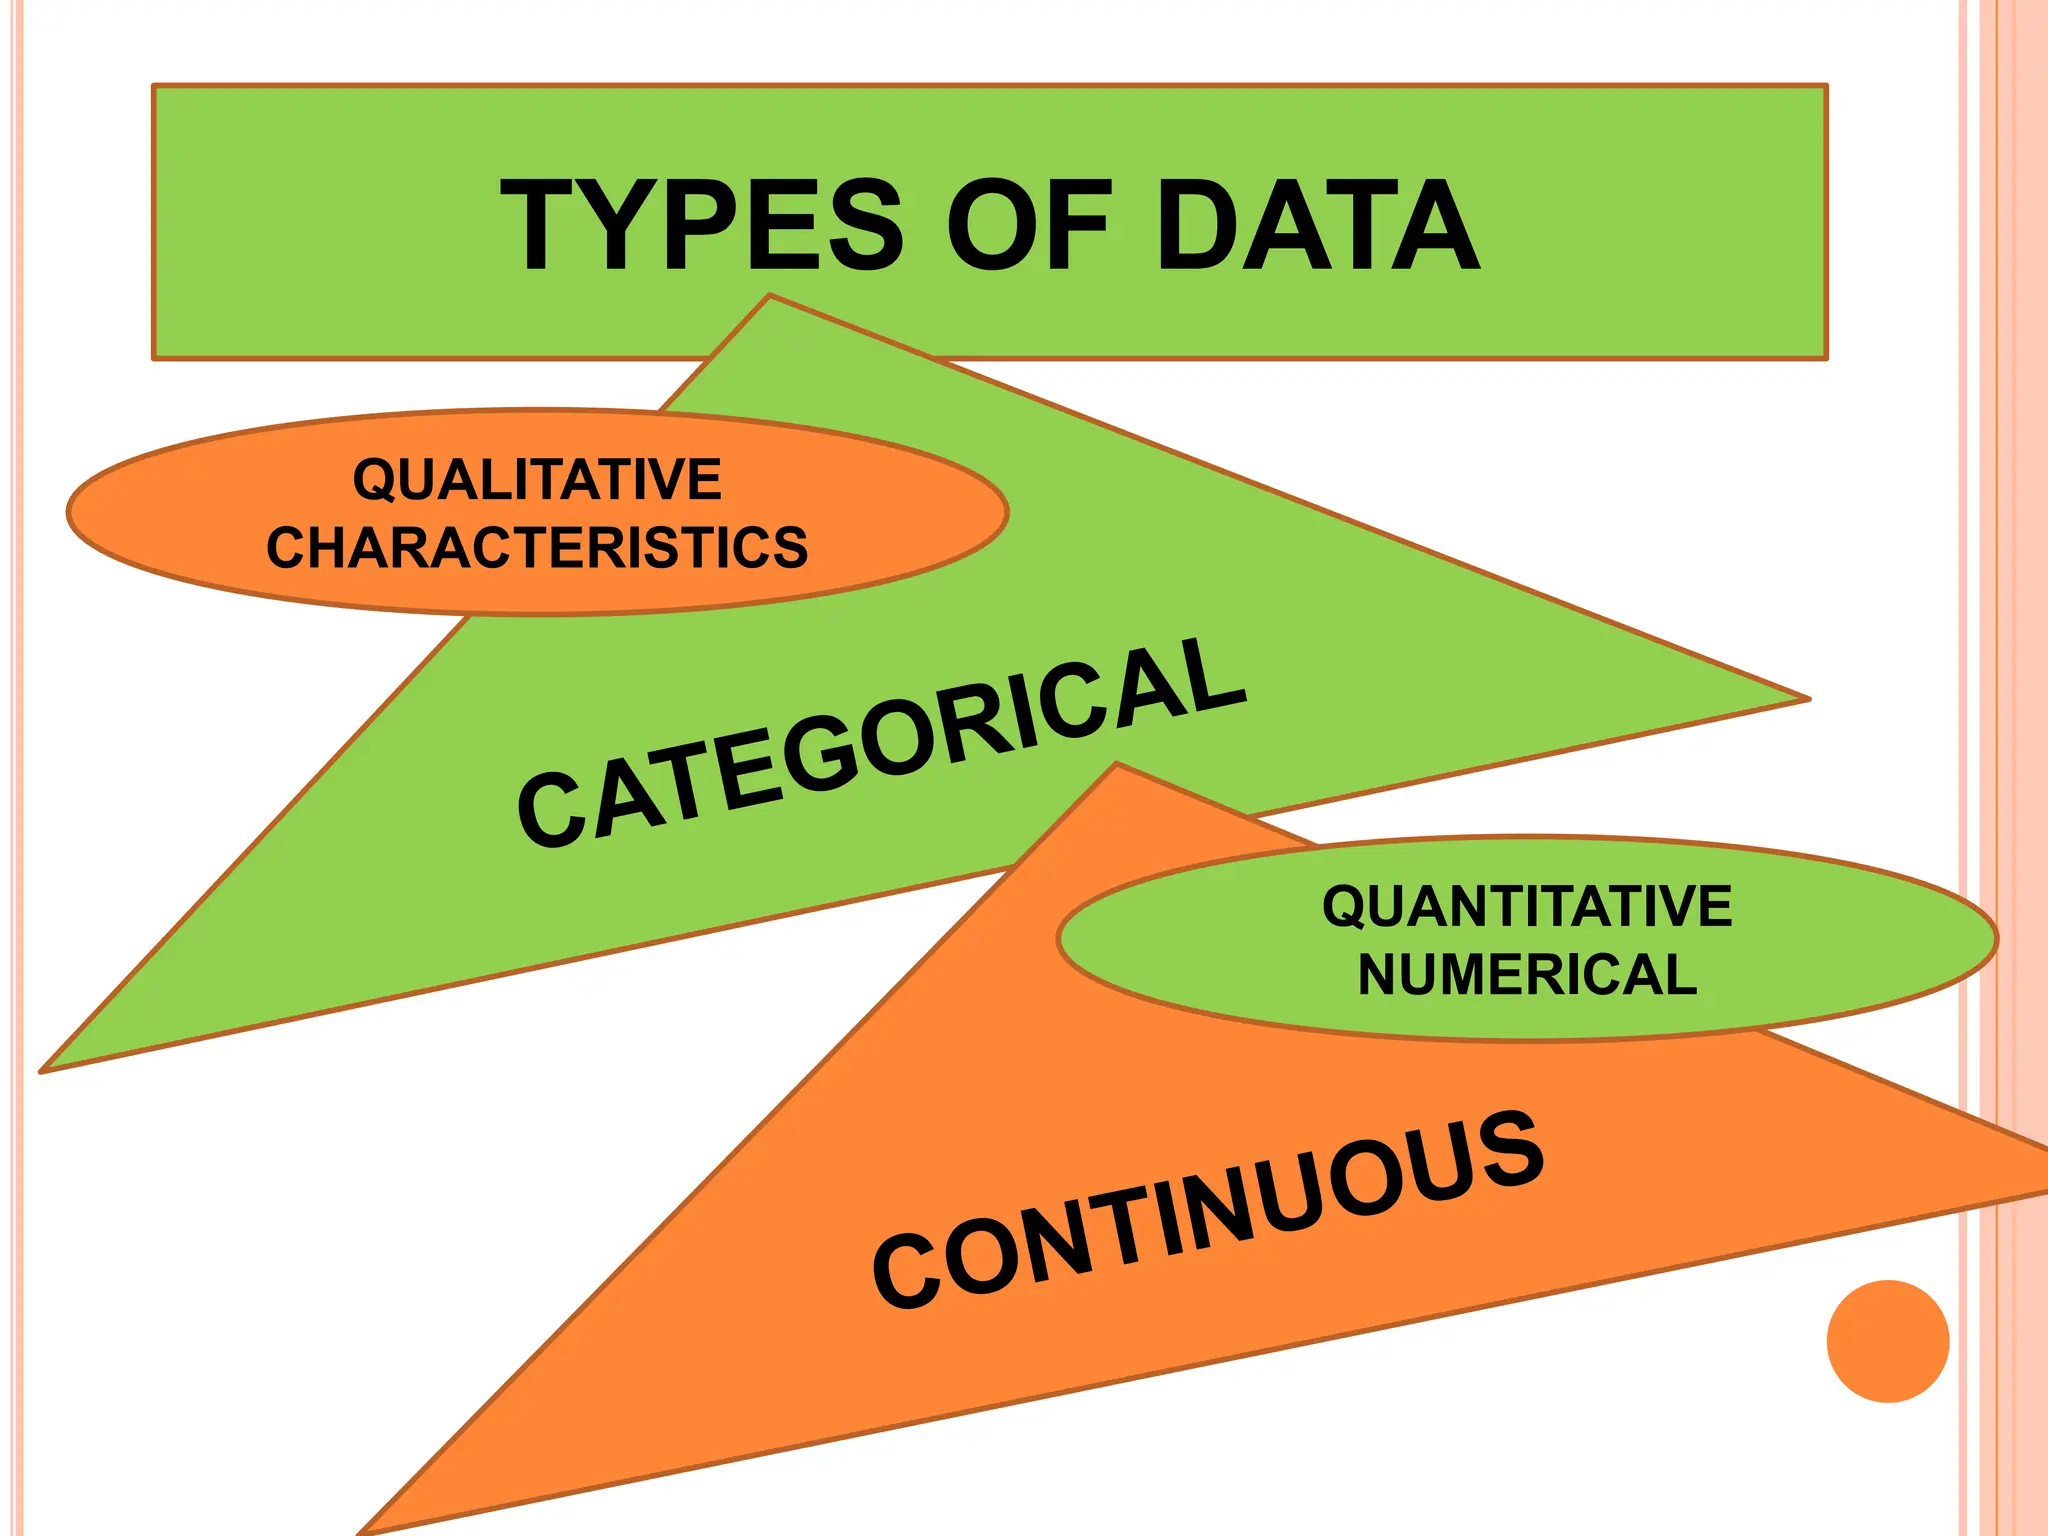
1. The document discusses quantitative research methods, including comparing groups, examining relationships between variables, different types of data and levels of measurement, sampling techniques, and common statistical tools.
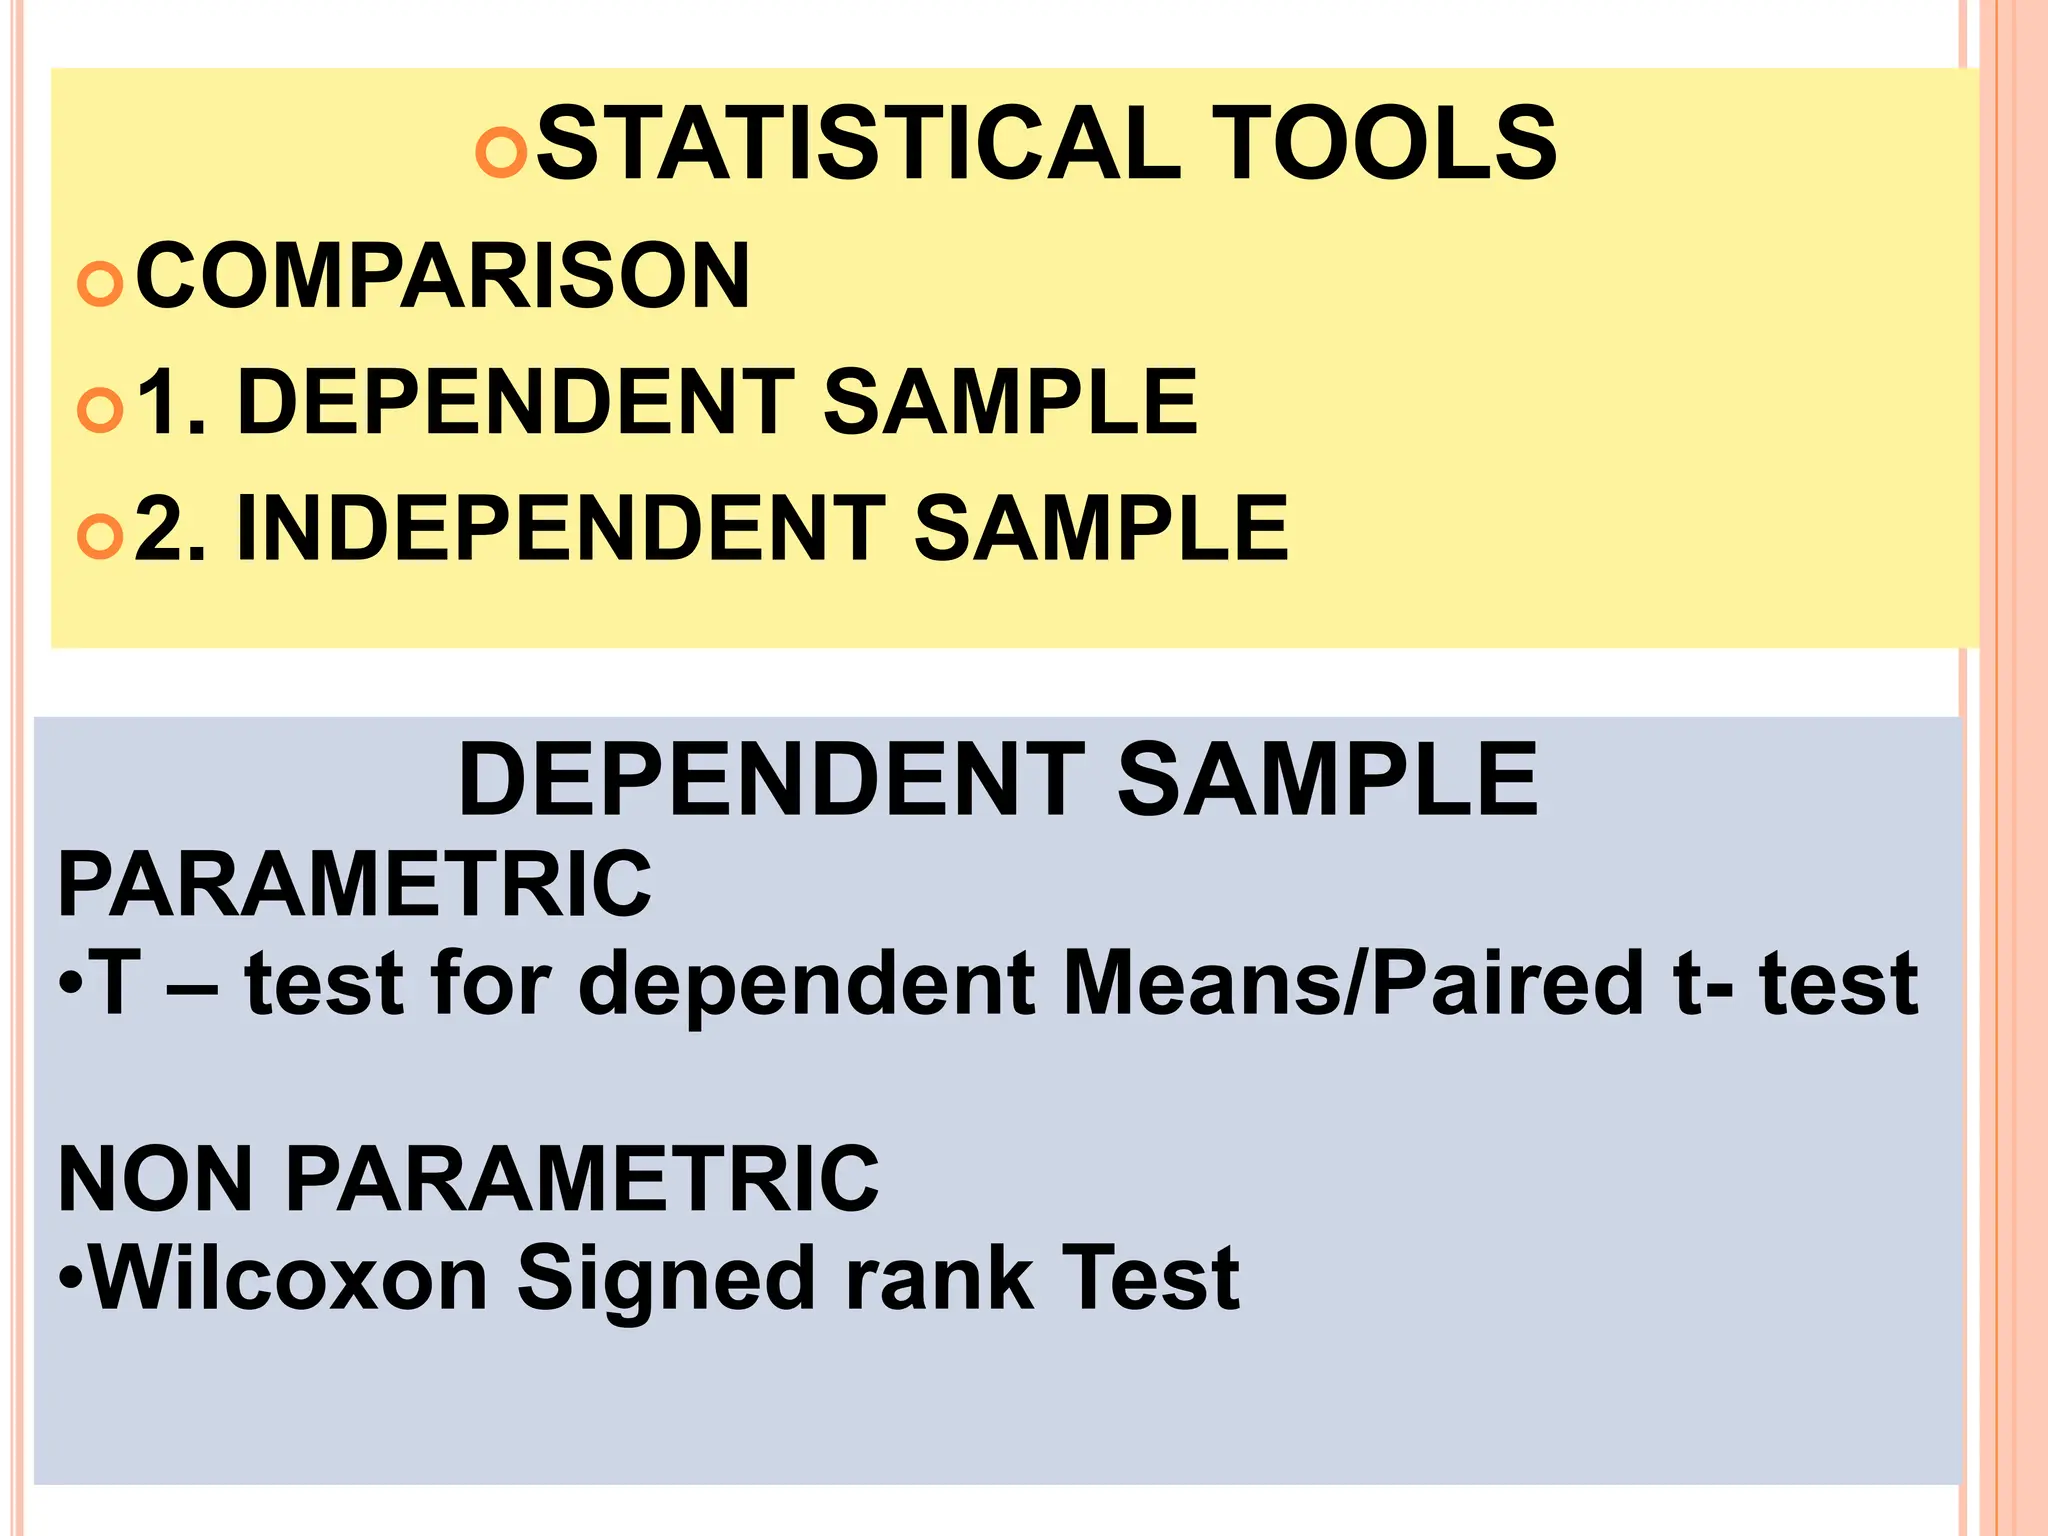
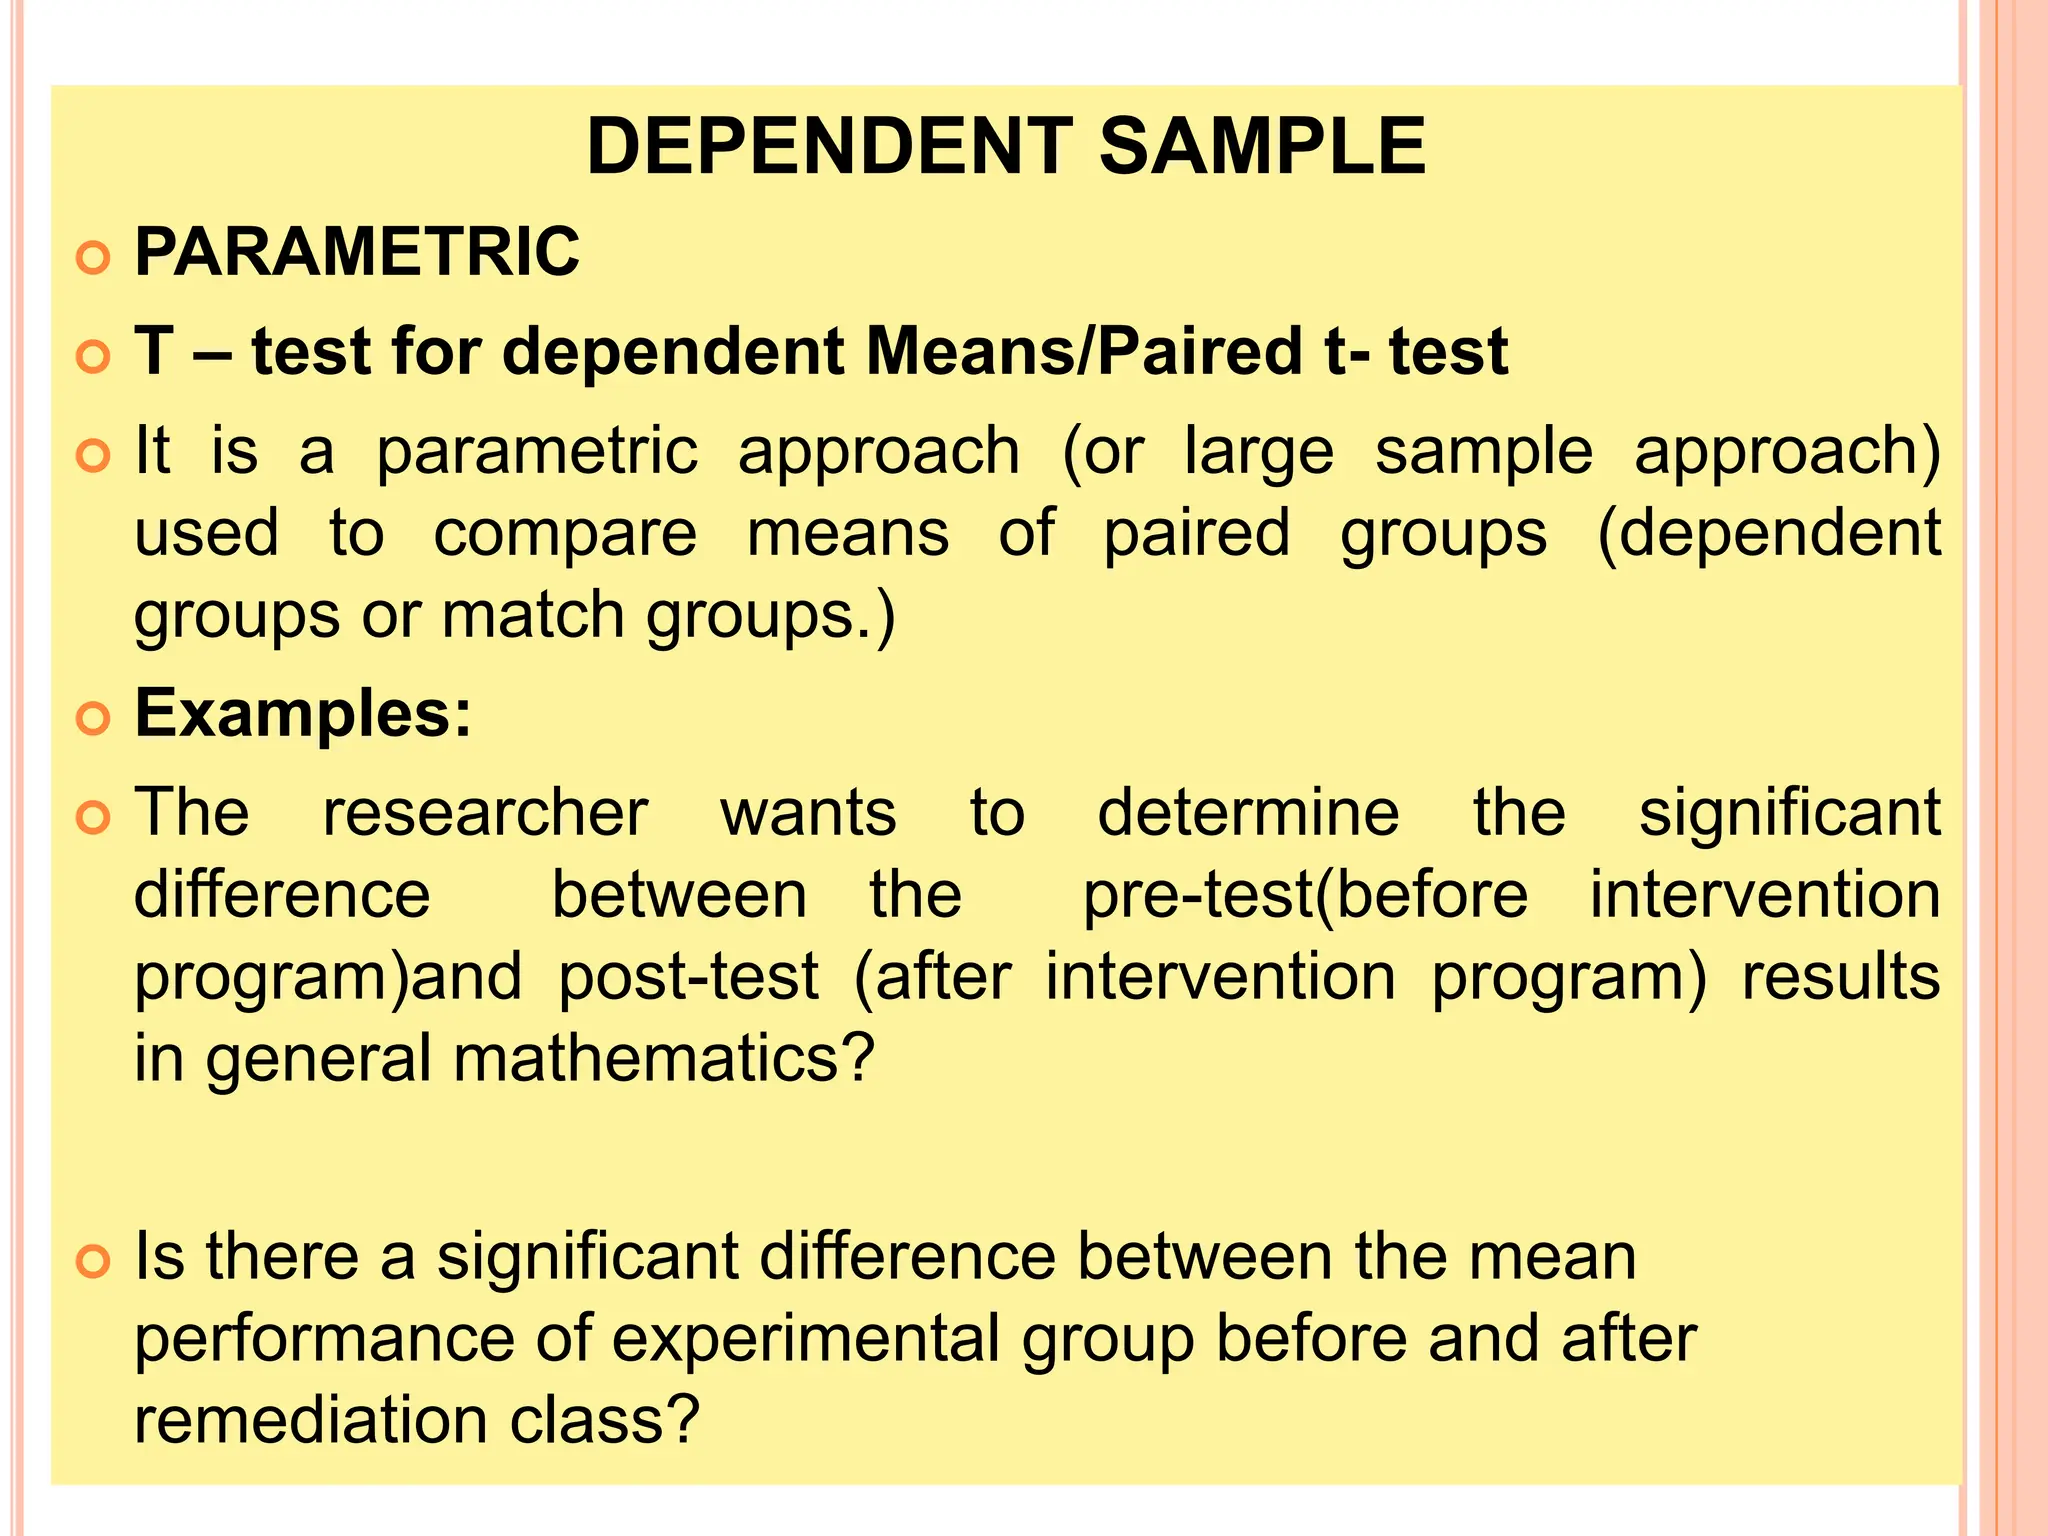
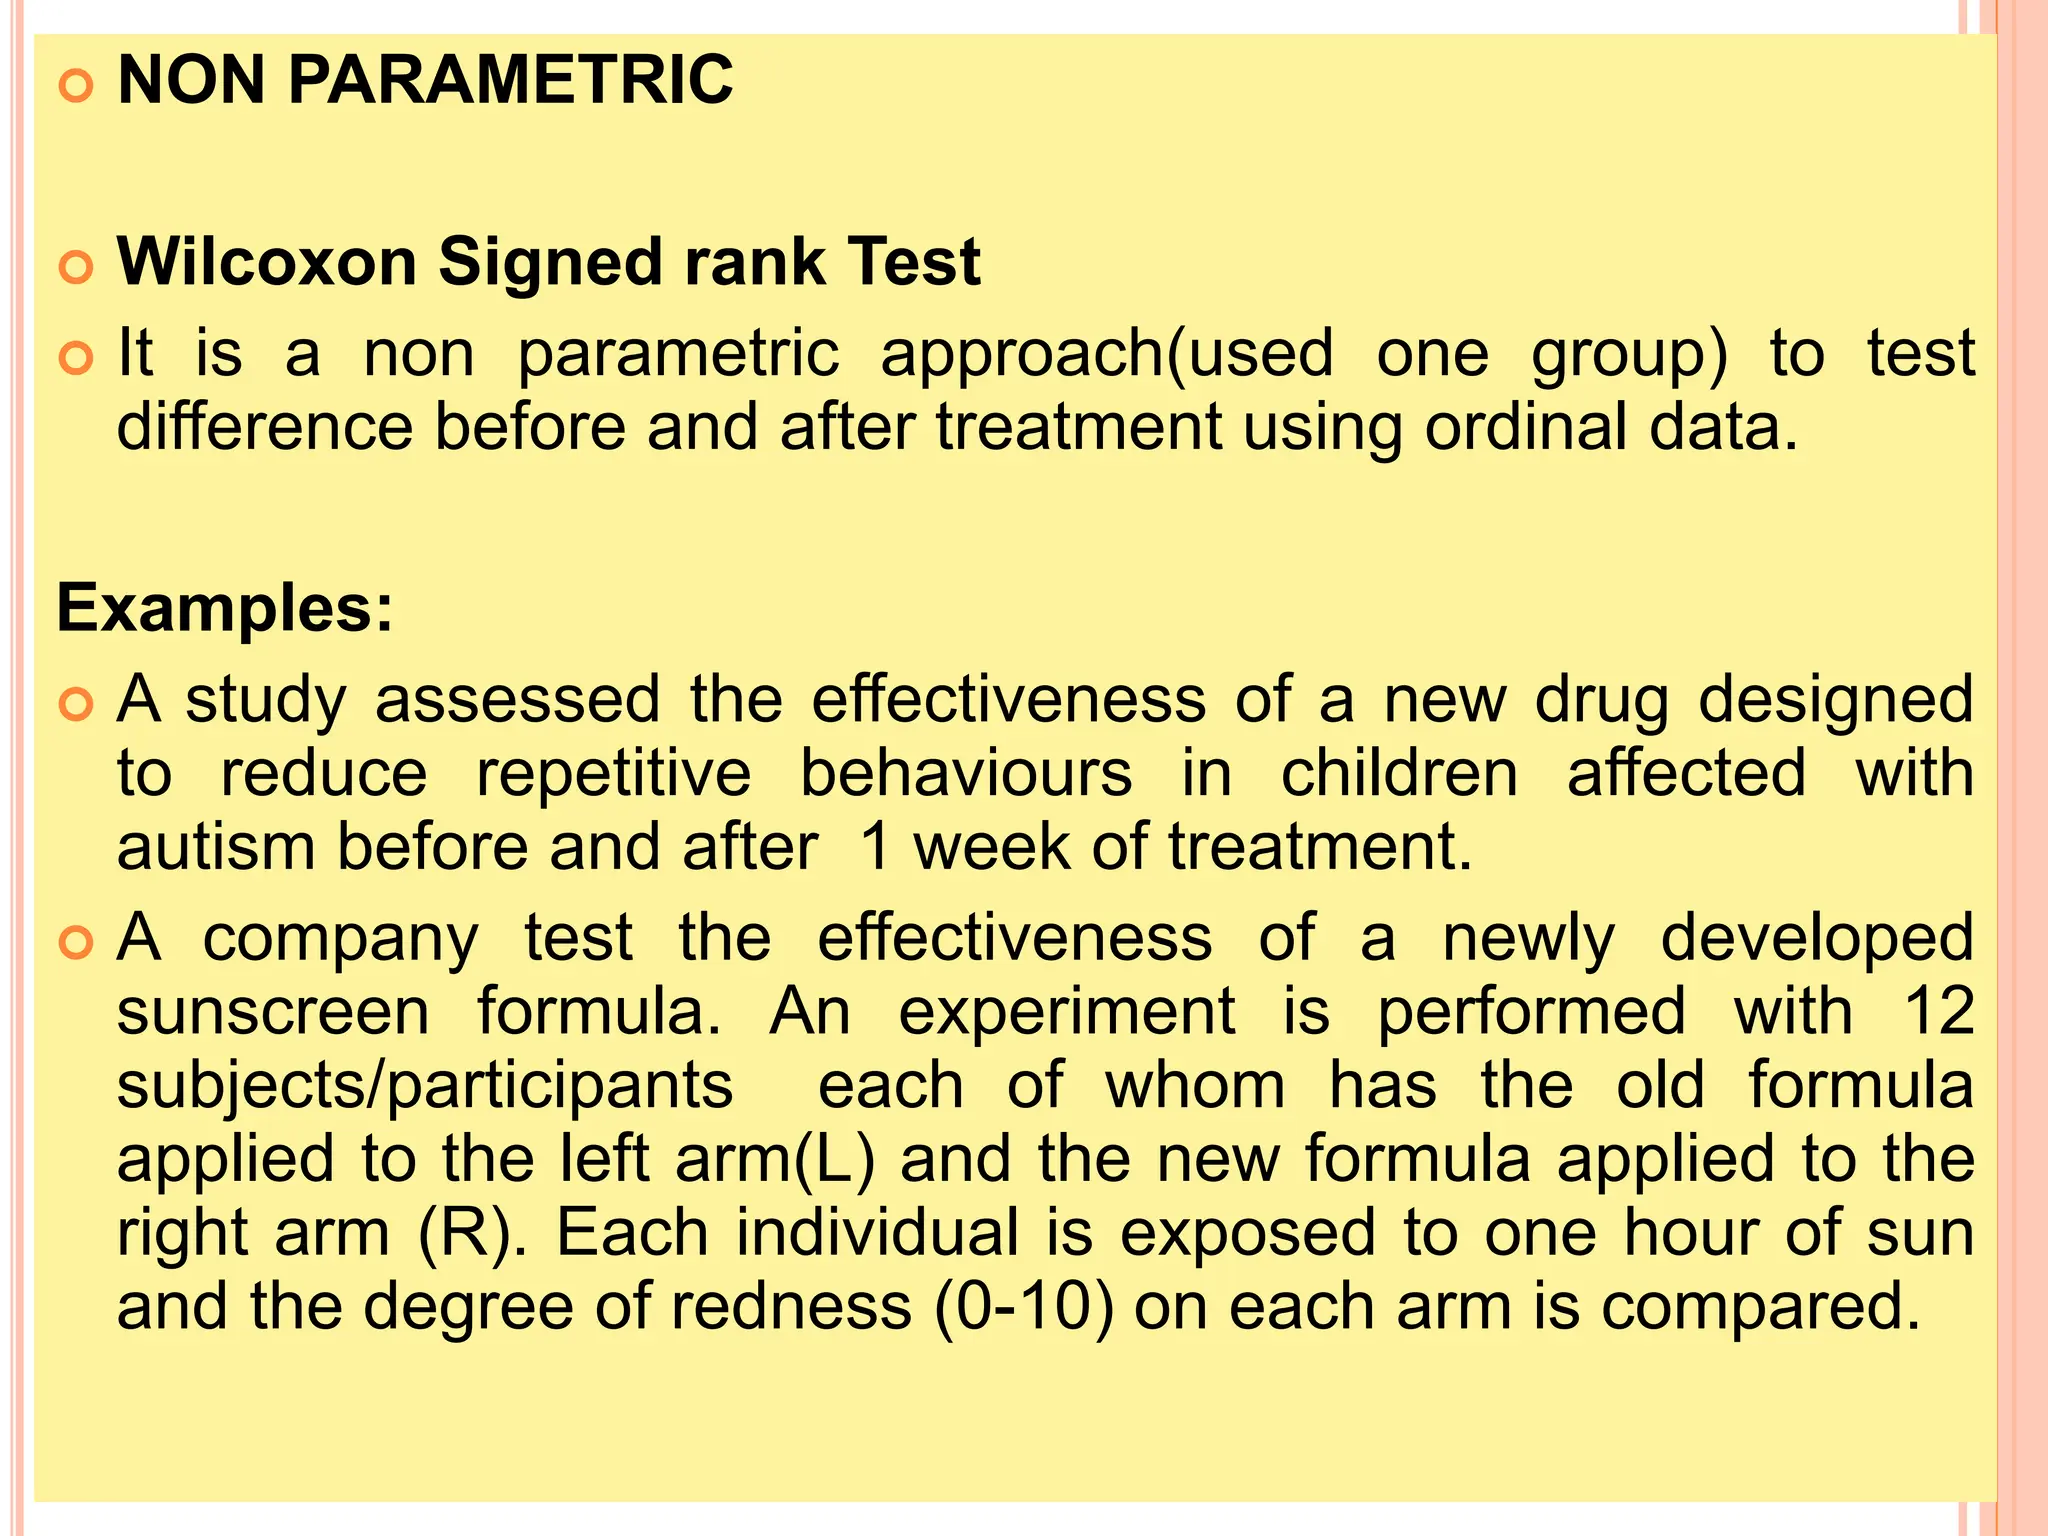
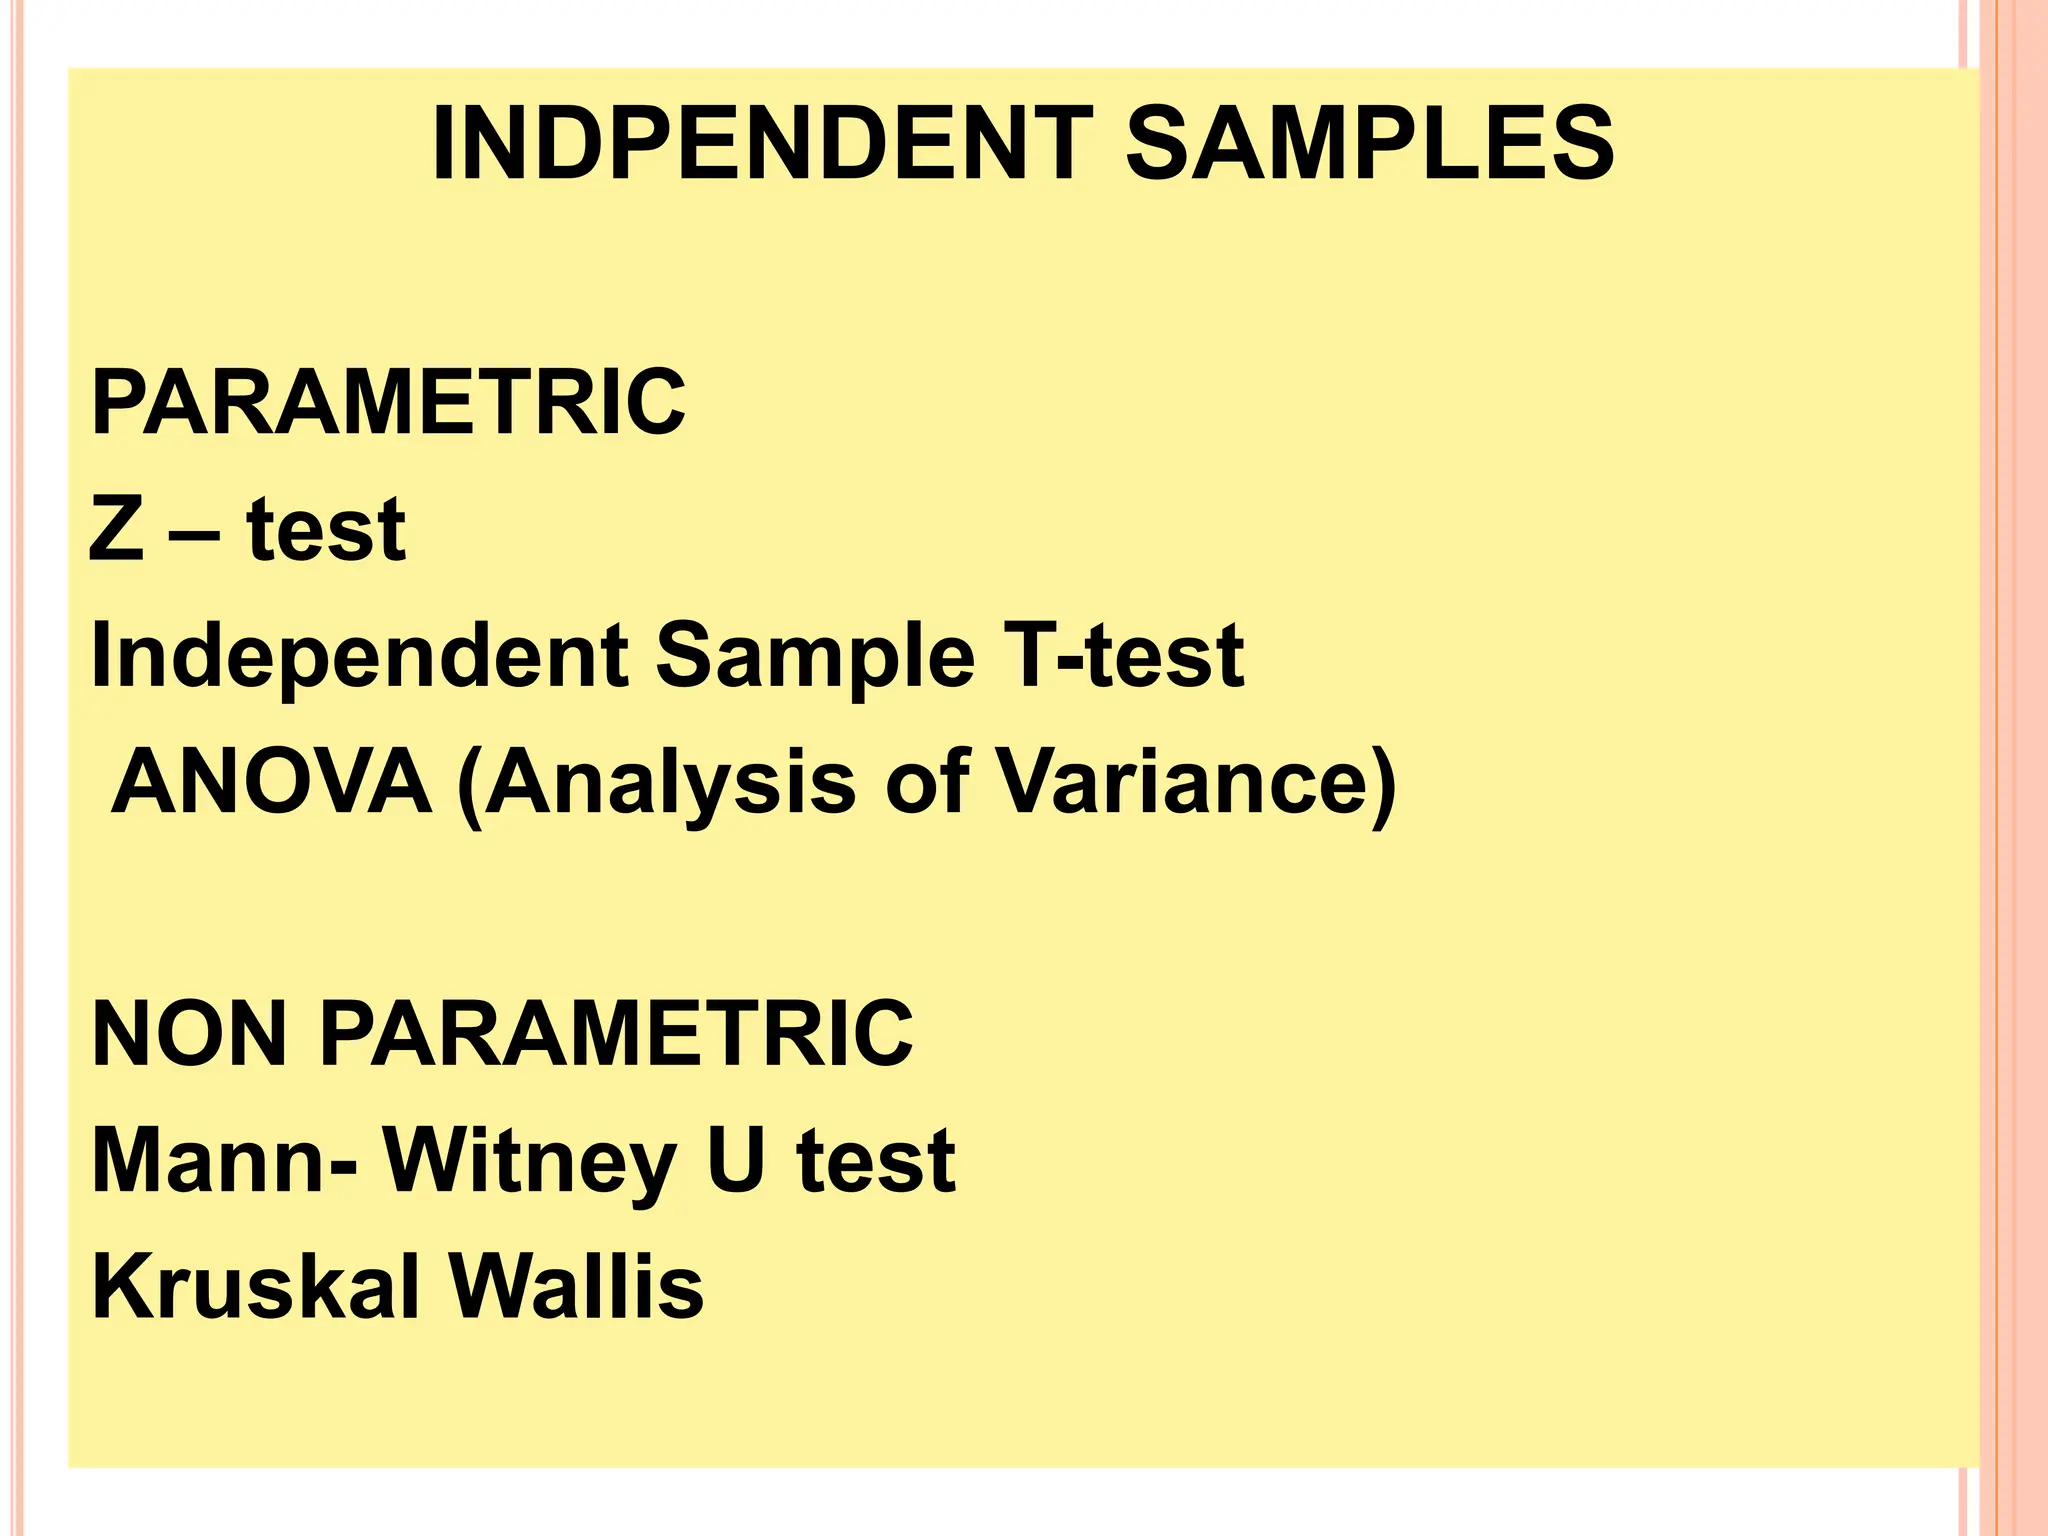
2. Key statistical tools covered include t-tests, ANOVA, correlation analysis, chi-square tests, and non-parametric equivalents for comparing groups and examining relationships.
3. The purpose of quantitative research is to systematically investigate phenomena through collecting and analyzing numerical data.