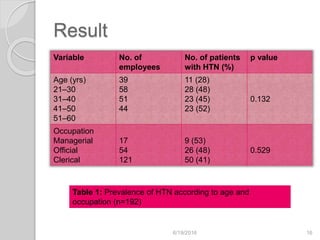
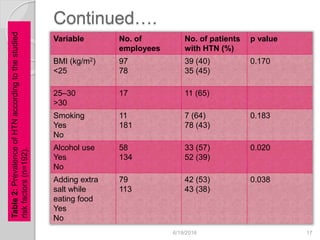
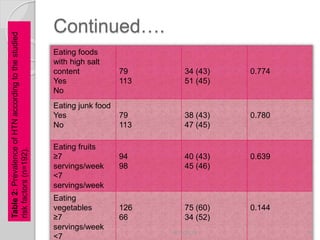
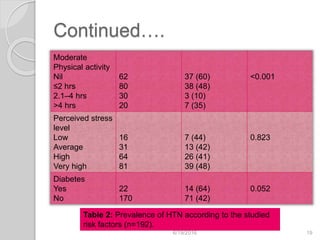
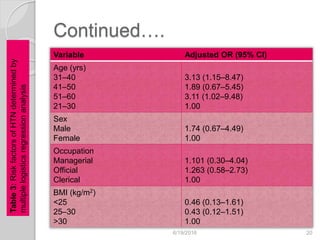
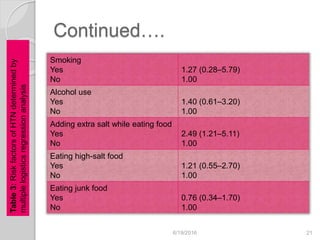
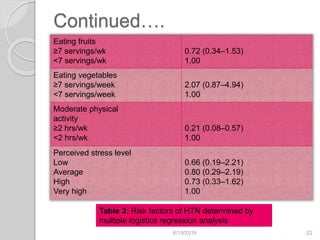
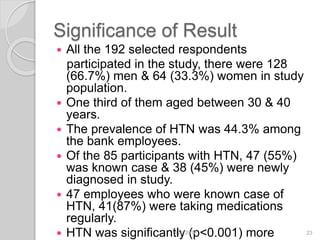
Presented by : Dr. Kunal Modak
Guided by : Dr. Abhay Mudey
Title:- Prevalence and Risk Factors of
Hypertension among Bank Employees in
Urban Puducherry, India
Authors:- S Ganesh Kumar, N Deivanai
Sundaram
Published in International Journal of
Occupational & Environmental Medicine
Month/ Year: April/2014 I Volume: 05 I
Issue:01
6/19/2016 2
Background
 The prevalence of cardiovascular diseases
(CVDs) is on the rise, It is expected that by
2020, this group of diseases will be the
largest cause of death in India.
 Hypertension (HTN) is globally one of the
most important risk factors for CVD.
 The risks of CVDs are higher among the
urban population.
 HTN has several risk factors of which
sedentary lifestyle and mental stress are a
major component.
6/19/2016 3
Continued….
 Since the bank employees have
exposed to higher levels of these risk
factors, they form an important high-
risk group for screening HTN.
 Bank employees undergo varying
levels of mental stress to reduce the
possibility of manual error and are
thus more prone for chronic diseases
like HTN.
6/19/2016 4
Objective
 To assess the prevalence and risk
factors of hypertension among bank
employees in Puducherry, India.
6/19/2016 5
Previous Work Done Which Has
Lead Up To The Study
 Mohan V, Deepa S, Farooq V, et al found
diabetes 11.9%; hypertension 25.4%;
dyslipidaemia 40.2%;
hypertriglyceridaemia 28.3%; overweight
(body mass index > or = 23 kg/m2) 60.2%;
and metabolic syndrome 34.1%. Use of
tobacco in any form was present in 22.9%
of men and 0.5% of women; 79% of the
subjects followed a sedentary lifestyle.
Among subjects receiving medication,
42.1% of subjects with diabetes and
55.3% of subjects with hypertension had
their disease under adequate control.6/19/2016 6
Continued….
 K. Srinath Reddy & Salim Yusuf, et al.
found if population levels of CVD risk
factors rise as a consequence of adverse
lifestyle changes accompanying
industrialization and urbanization, the rates
of CVD mortality and morbidity could rise
even higher than the rates predicted solely
by demographic changes.
 A cross sectional survey of urban Delhi and
its rural environs revealed that a higher
prevalence of coronary heart disease
(CHD) in the urban sample was associated
with higher levels of body mass index,
blood pressure, fasting blood lipids (total
cholesterol, ratio of cholesterol to HDL6/19/2016 7
Materials and Methods
 Study Area : 12 Nationalized Banks in
Urban Puducherry.
 Study Duration : May to August, 2012
 Study Design : The study design was
cross sectional. The sampling design
used was simple random sampling.
 Study Sample : Assuming non response
rate of 10% & consideration based on
various studies in the west as well as in
India and taking into account time
constraints the sample size of 192 was
taken.
6/19/2016 8
Inclusion Criteria:
 All the employees including
managerial, official and clerical staff of
the selected banks were included in
the study.
 Subject should be the national banks
in urban Puducherry were listed out.
 Subject should be willing to be in
study.
 If the selected subject could not be
contacted after at most three visits or
refused to participate in the study, they
were considered as non-respondents.6/19/2016 9
 The investigator took prior permission
from respective bank managers for
doing the study.
 Days and time were fixed as per the
convenience of workers and
investigator.
 Informed written consent was taken
from each participant before initiating
the study and strict confidentiality has
been maintained.
6/19/2016 10
Data Collection
 After taking informed consent from the
subject, a self-administered questionnaire
was given to them to obtain the baseline
characteristics and identify the risk factors.
 Blood pressure and height and weight of
each participant were also measured.
 Procedure Followed:-
1) Blood pressure was measured using a
mercury sphygmomanometer of
appropriate cuff size.
2) After 5 min of rest with the participant in
sitting position, feet relaxed on the floor
and arm supported at chest level.
6/19/2016 11
 Precaution Taken:-
the subject avoided caffeine, smoking or
exercise for at least 30 min prior to
measurement.
Data classified into:-
1) Normal
2) Pre- Hypertension
3) Hypertension
Criteria used:- Joint National Committee
(JNC) VII
6/19/2016 12
 A questionnaire on the risk factors of HTN
was prepared based on the questions taken
from World Health Organization (WHO)
STEPS self-administered instrument.
 Data on addition of extra salt while eating
food, eating foods with high-salt content,
eating junk food, and servings of fruits and
vegetables in the preceding week were also
collected.
 Assessment of Stress Scale:-
Cohen’s Perceived Scale
6/19/2016 13
 Stress level was Classified into;
1) Low
2) Average
3) High
4) Very High
 Height & Weight was measured using a non-
stretchable measuring tape. Standing against
a wall bare foot.
 Weight was measured using an electronic
weighing scale.
6/19/2016 14
Statistical analysis
 The collected data was analyzed by
SPSS® for Windows® vertion 16.
 χ2 test and multiple logistic regression
analysis were used for data analyses.
6/19/2016 15
Result
Variable No. of
employees
No. of patients
with HTN (%)
p value
Age (yrs)
21–30
31–40
41–50
51–60
39
58
51
44
11 (28)
28 (48)
23 (45)
23 (52)
0.132
Occupation
Managerial
Official
Clerical
17
54
121
9 (53)
26 (48)
50 (41)
0.529
6/19/2016 16
Table 1: Prevalence of HTN according to age and
occupation (n=192)
Continued….
Variable No. of
employees
No. of patients
with HTN (%)
p value
BMI (kg/m2)
<25
97
78
39 (40)
35 (45)
0.170
25–30
>30
17 11 (65)
Smoking
Yes
No
11
181
7 (64)
78 (43)
0.183
Alcohol use
Yes
No
58
134
33 (57)
52 (39)
0.020
Adding extra
salt while
eating food
Yes
No
79
113
42 (53)
43 (38)
0.038
6/19/2016 17
Table2:PrevalenceofHTNaccordingtothestudied
riskfactors(n=192).
Continued….
Eating foods
with high salt
content
Yes
No
79
113
34 (43)
51 (45)
0.774
Eating junk food
Yes
No
79
113
38 (43)
47 (45)
0.780
Eating fruits
≥7
servings/week
<7
servings/week
94
98
40 (43)
45 (46)
0.639
Eating
vegetables
≥7
servings/week
<7
126
66
75 (60)
34 (52)
0.144
6/19/2016 18
Table2:PrevalenceofHTNaccordingtothestudied
riskfactors(n=192).
Continued….
Moderate
Physical activity
Nil
≤2 hrs
2.1–4 hrs
>4 hrs
62
80
30
20
37 (60)
38 (48)
3 (10)
7 (35)
<0.001
Perceived stress
level
Low
Average
High
Very high
16
31
64
81
7 (44)
13 (42)
26 (41)
39 (48)
0.823
Diabetes
Yes
No
22
170
14 (64)
71 (42)
0.052
6/19/2016 19
Table 2: Prevalence of HTN according to the studied
risk factors (n=192).
Continued….
Variable Adjusted OR (95% CI)
Age (yrs)
31–40
41–50
51–60
21–30
3.13 (1.15–8.47)
1.89 (0.67–5.45)
3.11 (1.02–9.48)
1.00
Sex
Male
Female
1.74 (0.67–4.49)
1.00
Occupation
Managerial
Official
Clerical
1.101 (0.30–4.04)
1.263 (0.58–2.73)
1.00
BMI (kg/m2)
<25
25–30
>30
0.46 (0.13–1.61)
0.43 (0.12–1.51)
1.00
6/19/2016 20
Table3:RiskfactorsofHTNdeterminedby
multiplelogisticsregressionanalysis
Continued….
Smoking
Yes
No
1.27 (0.28–5.79)
1.00
Alcohol use
Yes
No
1.40 (0.61–3.20)
1.00
Adding extra salt while eating food
Yes
No
2.49 (1.21–5.11)
1.00
Eating high-salt food
Yes
No
1.21 (0.55–2.70)
1.00
Eating junk food
Yes
No
0.76 (0.34–1.70)
1.00
6/19/2016 21
Table3:RiskfactorsofHTNdeterminedby
multiplelogisticsregressionanalysis
Continued….
Eating fruits
≥7 servings/wk
<7 servings/wk
0.72 (0.34–1.53)
1.00
Eating vegetables
≥7 servings/week
<7 servings/week
2.07 (0.87–4.94)
1.00
Moderate physical
activity
≥2 hrs/wk
<2 hrs/wk
0.21 (0.08–0.57)
1.00
Perceived stress level
Low
Average
High
Very high
0.66 (0.19–2.21)
0.80 (0.29–2.19)
0.73 (0.33–1.62)
1.00
6/19/2016 22
Table 3: Risk factors of HTN determined by
multiple logistics regression analysis
Significance of Result
 All the 192 selected respondents
participated in the study, there were 128
(66.7%) men & 64 (33.3%) women in study
population.
 One third of them aged between 30 & 40
years.
 The prevalence of HTN was 44.3% among
the bank employees.
 Of the 85 participants with HTN, 47 (55%)
was known case & 38 (45%) were newly
diagnosed in study.
 47 employees who were known case of
HTN, 41(87%) were taking medications
regularly.
 HTN was significantly (p<0.001) more6/19/2016 23
 Whereas age & occupation of
participants did not significantly affect
the prevalence of HTN.
 Alcohol use, adding extra salt while
eating food & lesser physical activity
were significantly associated with the
prevalence of HTN.
6/19/2016 24
Discussion
 Like other studies, in study it was found that
prevalence is higher among those with higher
age.
 The prevalence was more in men than
women, this could be the attribute to the fact
that most of the studied women were young.
 Obesity, smoking and alcohol consumption
were shown to be significantly associated
with the prevalence of HTN.
 Yet BMI did not have any significant effect on
the prevalence that may be due to the
considerably few number of subjects with
BMI >30 kg/m2.
6/19/2016 25
 It was also found that significant
association between the prevalence of
HTN and smoking and alcohol
consumption.
 No significant association between the
level of perceived stress and the
prevalence of HTN.
 The study has got the inherent
limitations of a cross-sectional study.
6/19/2016 26
 Detailed dietary history and
quantification of certain risk factors
were not assessed due to feasibility
constraints.
 The study gave valuable information
regarding the prevalence of HTN and
its risk factors among this vulnerable
group.
6/19/2016 27
Reference
 Yusuf S, Reddy S, Ounpuu S, Anand S.
Global burden of cardiovascular diseases:
part II: variations in cardiovascular disease by
specific ethnic groups and geographic
regions and prevention
strategies. Circulation2001;104:2855-64.
 Grundy SM, Pasternak R, Greenland P, et
al. Assessment of cardiovascular risk by use
of multiple-risk-factor assessment equations:
a statement for healthcare professionals from
the American Heart Association and the
American College of
Cardiology. Circulation 1999;100;1481-92.
6/19/2016 28
Continued….
 Reddy KS, Yusuf S. Emerging epidemic of
cardiovascular disease in developing
countries. Circulation 1998;97:596-601.
 Mohan V, Deepa S, Farooq V, et
al. Surveillance for risk factors of
cardiovascular disease among an industrial
population in southern India. Natl Med J
India 2008;21:8-13.
 Chantal G, Chantal B, Gilles RD, et al. Effects
of job strain on blood pressure: a prospective
study of male and female white-collar
workers. Am J Public Health 2006;96:1436-
43.
6/19/2016 29
Continued….
 Maroof KA, Parashar P, Bansal R, Ahmad S.
A study on hypertension among the bank
employees of Meerut district of Uttar
Pradesh. Indian J Public Health 2007;51:225-
7.
 Shivaramakrishna HR, Wantamutte AS,
Sangolli HM, Mallapur MD. Risk factors of
coronary heart disease among bank
employees of Belgaum city—aross-sectional
study. Al Ameen J Sci 2010;3:152-9.
 Momin MH, Desai VK, Kavishkar AB. Study
of socio-demographic factors affecting
prevalence of hypertension among bank
employees of Surat city. Indian J Public6/19/2016 30
Continued….
 Ganesh Kumar S, Unnikrishnan B, Nagraj K.
Self reported chronic diseases and
occupational health risks among bank
employees of southern Karnataka city,
India. Indian J Community
Medicine 2013;1:63-4.
 Chor D. High blood pressure among bank
employees in Rio de Janeiro. Arq Bras
Cardiol 1998;71:653-60.
 Konradi AO, Rotar OP, Korostovtseva LS, et
al. Prevalence of metabolic syndrome
components in a population of bank
employees from St. Petersburg, Russia. Met
Syndr Relat Disord 2011;9:337-43.
6/19/2016 31
Continued….
 Thomas G P, John EH, Lawrence JA, et al.
Recommendations for blood pressure
measurement in humans: a statement for
professionals from the subcommittee of
professional and public education of the
American Heart Association council on high
blood pressure
research. Hypertension 2005;45;142-61.
 Chobanian AV, Bakris GL, Black HR, et al.
The seventh report of the joint national
committee on prevention, detection,
evaluation, and treatment of high blood
pressure: the JNC 7
report. JAMA 2003;289:2560-726/19/2016 32
Continued….
 WHO. WHO STEPwise approach to chronic
disease risk factor surveillance—instrument
v2.1, Available
from www.who.int/chp/steps/STEPS_Instrum
ent_v2.1.pdf (Accessed August 20, 2013).
 Cohen S, Kamark T, Mermelstein R. A global
measure of perceived stress. J Health Soc
Behav 1983;24:385-96.
 Mohan V, Deepa M, Farooq S, et
al. Prevention, Awareness and control of
hypertension in Chennai—the Chennai Urban
Rural Epidemiological study (CURES-52). J
Assoc Physicians India 2007;55:326-32.
6/19/2016 33
Conclusion
 The prevalence of cardiovascular
diseases is on the rise worldwide.
 Bank employees experience varying
levels of mental stress to reduce the
possibility of manual error and are
thus more prone for chronic diseases
like hypertension.
 The prevalence of hypertension has
been found to be higher among bank
employees than in the general urban
population.
6/19/2016 34
6/19/2016 35

Journal Club presentation on Hypertension Study

  • 1.
    Presented by :Dr. Kunal Modak Guided by : Dr. Abhay Mudey
  • 2.
    Title:- Prevalence andRisk Factors of Hypertension among Bank Employees in Urban Puducherry, India Authors:- S Ganesh Kumar, N Deivanai Sundaram Published in International Journal of Occupational & Environmental Medicine Month/ Year: April/2014 I Volume: 05 I Issue:01 6/19/2016 2
  • 3.
    Background  The prevalenceof cardiovascular diseases (CVDs) is on the rise, It is expected that by 2020, this group of diseases will be the largest cause of death in India.  Hypertension (HTN) is globally one of the most important risk factors for CVD.  The risks of CVDs are higher among the urban population.  HTN has several risk factors of which sedentary lifestyle and mental stress are a major component. 6/19/2016 3
  • 4.
    Continued….  Since thebank employees have exposed to higher levels of these risk factors, they form an important high- risk group for screening HTN.  Bank employees undergo varying levels of mental stress to reduce the possibility of manual error and are thus more prone for chronic diseases like HTN. 6/19/2016 4
  • 5.
    Objective  To assessthe prevalence and risk factors of hypertension among bank employees in Puducherry, India. 6/19/2016 5
  • 6.
    Previous Work DoneWhich Has Lead Up To The Study  Mohan V, Deepa S, Farooq V, et al found diabetes 11.9%; hypertension 25.4%; dyslipidaemia 40.2%; hypertriglyceridaemia 28.3%; overweight (body mass index > or = 23 kg/m2) 60.2%; and metabolic syndrome 34.1%. Use of tobacco in any form was present in 22.9% of men and 0.5% of women; 79% of the subjects followed a sedentary lifestyle. Among subjects receiving medication, 42.1% of subjects with diabetes and 55.3% of subjects with hypertension had their disease under adequate control.6/19/2016 6
  • 7.
    Continued….  K. SrinathReddy & Salim Yusuf, et al. found if population levels of CVD risk factors rise as a consequence of adverse lifestyle changes accompanying industrialization and urbanization, the rates of CVD mortality and morbidity could rise even higher than the rates predicted solely by demographic changes.  A cross sectional survey of urban Delhi and its rural environs revealed that a higher prevalence of coronary heart disease (CHD) in the urban sample was associated with higher levels of body mass index, blood pressure, fasting blood lipids (total cholesterol, ratio of cholesterol to HDL6/19/2016 7
  • 8.
    Materials and Methods Study Area : 12 Nationalized Banks in Urban Puducherry.  Study Duration : May to August, 2012  Study Design : The study design was cross sectional. The sampling design used was simple random sampling.  Study Sample : Assuming non response rate of 10% & consideration based on various studies in the west as well as in India and taking into account time constraints the sample size of 192 was taken. 6/19/2016 8
  • 9.
    Inclusion Criteria:  Allthe employees including managerial, official and clerical staff of the selected banks were included in the study.  Subject should be the national banks in urban Puducherry were listed out.  Subject should be willing to be in study.  If the selected subject could not be contacted after at most three visits or refused to participate in the study, they were considered as non-respondents.6/19/2016 9
  • 10.
     The investigatortook prior permission from respective bank managers for doing the study.  Days and time were fixed as per the convenience of workers and investigator.  Informed written consent was taken from each participant before initiating the study and strict confidentiality has been maintained. 6/19/2016 10
  • 11.
    Data Collection  Aftertaking informed consent from the subject, a self-administered questionnaire was given to them to obtain the baseline characteristics and identify the risk factors.  Blood pressure and height and weight of each participant were also measured.  Procedure Followed:- 1) Blood pressure was measured using a mercury sphygmomanometer of appropriate cuff size. 2) After 5 min of rest with the participant in sitting position, feet relaxed on the floor and arm supported at chest level. 6/19/2016 11
  • 12.
     Precaution Taken:- thesubject avoided caffeine, smoking or exercise for at least 30 min prior to measurement. Data classified into:- 1) Normal 2) Pre- Hypertension 3) Hypertension Criteria used:- Joint National Committee (JNC) VII 6/19/2016 12
  • 13.
     A questionnaireon the risk factors of HTN was prepared based on the questions taken from World Health Organization (WHO) STEPS self-administered instrument.  Data on addition of extra salt while eating food, eating foods with high-salt content, eating junk food, and servings of fruits and vegetables in the preceding week were also collected.  Assessment of Stress Scale:- Cohen’s Perceived Scale 6/19/2016 13
  • 14.
     Stress levelwas Classified into; 1) Low 2) Average 3) High 4) Very High  Height & Weight was measured using a non- stretchable measuring tape. Standing against a wall bare foot.  Weight was measured using an electronic weighing scale. 6/19/2016 14
  • 15.
    Statistical analysis  Thecollected data was analyzed by SPSS® for Windows® vertion 16.  χ2 test and multiple logistic regression analysis were used for data analyses. 6/19/2016 15
  • 16.
    Result Variable No. of employees No.of patients with HTN (%) p value Age (yrs) 21–30 31–40 41–50 51–60 39 58 51 44 11 (28) 28 (48) 23 (45) 23 (52) 0.132 Occupation Managerial Official Clerical 17 54 121 9 (53) 26 (48) 50 (41) 0.529 6/19/2016 16 Table 1: Prevalence of HTN according to age and occupation (n=192)
  • 17.
    Continued…. Variable No. of employees No.of patients with HTN (%) p value BMI (kg/m2) <25 97 78 39 (40) 35 (45) 0.170 25–30 >30 17 11 (65) Smoking Yes No 11 181 7 (64) 78 (43) 0.183 Alcohol use Yes No 58 134 33 (57) 52 (39) 0.020 Adding extra salt while eating food Yes No 79 113 42 (53) 43 (38) 0.038 6/19/2016 17 Table2:PrevalenceofHTNaccordingtothestudied riskfactors(n=192).
  • 18.
    Continued…. Eating foods with highsalt content Yes No 79 113 34 (43) 51 (45) 0.774 Eating junk food Yes No 79 113 38 (43) 47 (45) 0.780 Eating fruits ≥7 servings/week <7 servings/week 94 98 40 (43) 45 (46) 0.639 Eating vegetables ≥7 servings/week <7 126 66 75 (60) 34 (52) 0.144 6/19/2016 18 Table2:PrevalenceofHTNaccordingtothestudied riskfactors(n=192).
  • 19.
    Continued…. Moderate Physical activity Nil ≤2 hrs 2.1–4hrs >4 hrs 62 80 30 20 37 (60) 38 (48) 3 (10) 7 (35) <0.001 Perceived stress level Low Average High Very high 16 31 64 81 7 (44) 13 (42) 26 (41) 39 (48) 0.823 Diabetes Yes No 22 170 14 (64) 71 (42) 0.052 6/19/2016 19 Table 2: Prevalence of HTN according to the studied risk factors (n=192).
  • 20.
    Continued…. Variable Adjusted OR(95% CI) Age (yrs) 31–40 41–50 51–60 21–30 3.13 (1.15–8.47) 1.89 (0.67–5.45) 3.11 (1.02–9.48) 1.00 Sex Male Female 1.74 (0.67–4.49) 1.00 Occupation Managerial Official Clerical 1.101 (0.30–4.04) 1.263 (0.58–2.73) 1.00 BMI (kg/m2) <25 25–30 >30 0.46 (0.13–1.61) 0.43 (0.12–1.51) 1.00 6/19/2016 20 Table3:RiskfactorsofHTNdeterminedby multiplelogisticsregressionanalysis
  • 21.
    Continued…. Smoking Yes No 1.27 (0.28–5.79) 1.00 Alcohol use Yes No 1.40(0.61–3.20) 1.00 Adding extra salt while eating food Yes No 2.49 (1.21–5.11) 1.00 Eating high-salt food Yes No 1.21 (0.55–2.70) 1.00 Eating junk food Yes No 0.76 (0.34–1.70) 1.00 6/19/2016 21 Table3:RiskfactorsofHTNdeterminedby multiplelogisticsregressionanalysis
  • 22.
    Continued…. Eating fruits ≥7 servings/wk <7servings/wk 0.72 (0.34–1.53) 1.00 Eating vegetables ≥7 servings/week <7 servings/week 2.07 (0.87–4.94) 1.00 Moderate physical activity ≥2 hrs/wk <2 hrs/wk 0.21 (0.08–0.57) 1.00 Perceived stress level Low Average High Very high 0.66 (0.19–2.21) 0.80 (0.29–2.19) 0.73 (0.33–1.62) 1.00 6/19/2016 22 Table 3: Risk factors of HTN determined by multiple logistics regression analysis
  • 23.
    Significance of Result All the 192 selected respondents participated in the study, there were 128 (66.7%) men & 64 (33.3%) women in study population.  One third of them aged between 30 & 40 years.  The prevalence of HTN was 44.3% among the bank employees.  Of the 85 participants with HTN, 47 (55%) was known case & 38 (45%) were newly diagnosed in study.  47 employees who were known case of HTN, 41(87%) were taking medications regularly.  HTN was significantly (p<0.001) more6/19/2016 23
  • 24.
     Whereas age& occupation of participants did not significantly affect the prevalence of HTN.  Alcohol use, adding extra salt while eating food & lesser physical activity were significantly associated with the prevalence of HTN. 6/19/2016 24
  • 25.
    Discussion  Like otherstudies, in study it was found that prevalence is higher among those with higher age.  The prevalence was more in men than women, this could be the attribute to the fact that most of the studied women were young.  Obesity, smoking and alcohol consumption were shown to be significantly associated with the prevalence of HTN.  Yet BMI did not have any significant effect on the prevalence that may be due to the considerably few number of subjects with BMI >30 kg/m2. 6/19/2016 25
  • 26.
     It wasalso found that significant association between the prevalence of HTN and smoking and alcohol consumption.  No significant association between the level of perceived stress and the prevalence of HTN.  The study has got the inherent limitations of a cross-sectional study. 6/19/2016 26
  • 27.
     Detailed dietaryhistory and quantification of certain risk factors were not assessed due to feasibility constraints.  The study gave valuable information regarding the prevalence of HTN and its risk factors among this vulnerable group. 6/19/2016 27
  • 28.
    Reference  Yusuf S,Reddy S, Ounpuu S, Anand S. Global burden of cardiovascular diseases: part II: variations in cardiovascular disease by specific ethnic groups and geographic regions and prevention strategies. Circulation2001;104:2855-64.  Grundy SM, Pasternak R, Greenland P, et al. Assessment of cardiovascular risk by use of multiple-risk-factor assessment equations: a statement for healthcare professionals from the American Heart Association and the American College of Cardiology. Circulation 1999;100;1481-92. 6/19/2016 28
  • 29.
    Continued….  Reddy KS,Yusuf S. Emerging epidemic of cardiovascular disease in developing countries. Circulation 1998;97:596-601.  Mohan V, Deepa S, Farooq V, et al. Surveillance for risk factors of cardiovascular disease among an industrial population in southern India. Natl Med J India 2008;21:8-13.  Chantal G, Chantal B, Gilles RD, et al. Effects of job strain on blood pressure: a prospective study of male and female white-collar workers. Am J Public Health 2006;96:1436- 43. 6/19/2016 29
  • 30.
    Continued….  Maroof KA,Parashar P, Bansal R, Ahmad S. A study on hypertension among the bank employees of Meerut district of Uttar Pradesh. Indian J Public Health 2007;51:225- 7.  Shivaramakrishna HR, Wantamutte AS, Sangolli HM, Mallapur MD. Risk factors of coronary heart disease among bank employees of Belgaum city—aross-sectional study. Al Ameen J Sci 2010;3:152-9.  Momin MH, Desai VK, Kavishkar AB. Study of socio-demographic factors affecting prevalence of hypertension among bank employees of Surat city. Indian J Public6/19/2016 30
  • 31.
    Continued….  Ganesh KumarS, Unnikrishnan B, Nagraj K. Self reported chronic diseases and occupational health risks among bank employees of southern Karnataka city, India. Indian J Community Medicine 2013;1:63-4.  Chor D. High blood pressure among bank employees in Rio de Janeiro. Arq Bras Cardiol 1998;71:653-60.  Konradi AO, Rotar OP, Korostovtseva LS, et al. Prevalence of metabolic syndrome components in a population of bank employees from St. Petersburg, Russia. Met Syndr Relat Disord 2011;9:337-43. 6/19/2016 31
  • 32.
    Continued….  Thomas GP, John EH, Lawrence JA, et al. Recommendations for blood pressure measurement in humans: a statement for professionals from the subcommittee of professional and public education of the American Heart Association council on high blood pressure research. Hypertension 2005;45;142-61.  Chobanian AV, Bakris GL, Black HR, et al. The seventh report of the joint national committee on prevention, detection, evaluation, and treatment of high blood pressure: the JNC 7 report. JAMA 2003;289:2560-726/19/2016 32
  • 33.
    Continued….  WHO. WHOSTEPwise approach to chronic disease risk factor surveillance—instrument v2.1, Available from www.who.int/chp/steps/STEPS_Instrum ent_v2.1.pdf (Accessed August 20, 2013).  Cohen S, Kamark T, Mermelstein R. A global measure of perceived stress. J Health Soc Behav 1983;24:385-96.  Mohan V, Deepa M, Farooq S, et al. Prevention, Awareness and control of hypertension in Chennai—the Chennai Urban Rural Epidemiological study (CURES-52). J Assoc Physicians India 2007;55:326-32. 6/19/2016 33
  • 34.
    Conclusion  The prevalenceof cardiovascular diseases is on the rise worldwide.  Bank employees experience varying levels of mental stress to reduce the possibility of manual error and are thus more prone for chronic diseases like hypertension.  The prevalence of hypertension has been found to be higher among bank employees than in the general urban population. 6/19/2016 34
  • 35.

Editor's Notes

  • #8 Both the degree and the duration of exposure to CVD risk factors would increase due to higher risk factor levels coupled with a longer life expectancy.
  • #14 The original questionnaire was in English. Reliability & Validating was done by the piloting Cohen’s Scale on 10 participants.
  • #26 White-collar work is performed in an office, cubicle, or other administrative setting. 
  • #27 Inherent Limitations:- 1. Use of judgement in establishing estimates for reporting purposes 2. Human error 3. Room for more then one possible interpretations of the requirements or more than one possible treatments 4. Degree of uncertainty and complexity of the transactions involved