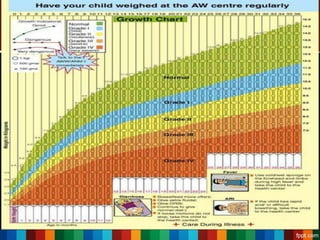
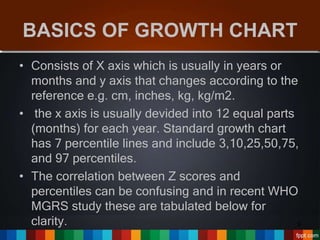
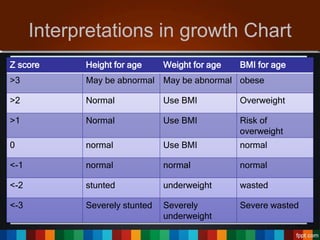
Pedagogy on Growth Chart
WHO
Presented By: Dr. Kunal
Guided By: Dr. Abhay Mudey
1
Contents
• Introduction
• Uses of Growth Charts
• WHO Growth Charts
• Basics Of Growth Chart
• Interpretations in growth Chart
• Advantages
• Limitations
• References 2
Introduction
• Growth: Increase in the physical size of the
body as whole or any of its parts associated
with increase in cell number & / or cell size.
• Growth Chart: The growth of the child is
monitored by recording the weight of the child
periodically & plotting against the age, in a
specially designed chart called Growth Chart.
• It was 1st designed by David Morley.
• The chart is a visible display of a graph, showing
horizontal X axis & longitudinal Y axis.
3
Continued.…
• Well baby clinics, PHC, and ICDS programmes
utilize growth charts.
• The wt. measurments of a child over a period of
time are plotted on the growth chart and any
deviation from the normal pattern can be visualised
and interpreted.
• An upward curve in the road to health is ideal.
• A flat and downward curves are not desirable.
• WHO charts – blue for boys and pink for girls
4
USES OF GROWTH CHART
• Diagnostic tool-To identify high risk children.
• Planning and policy making
• Education tool for educating mothers
• Tool for action helps in type of intervention that is
needed
• Evaluation of effectiveness of corrective measure
and impact of a programme of special interventions
for improving Childs growth and development
• Tool for teaching.
• Calculate drug dosage. 5
WHO GROWTH CHART
• MULTICENTRIC GROWTH REFERENCE STUDY(MGRS)-
• Participating countries include Brazil, Ghana, India, Norway,
Oman, and USA.
• Data collected by trained staff using a common protocol
• Sample selected from communities where there were no
environmental constraints to growth.
• The new growth reference is based on breastfeeding as the
biological norm.
• Measurements include weight/age, height/age, and
weight/height. Data on BMI was generated for children under
5 for the 1st time.
6
Growth Chart for Girls
7
8
BASICS OF GROWTH CHART
• Consists of X axis which is usually in years or
months and y axis that changes according to the
reference e.g. cm, inches, kg, kg/m2.
• the x axis is usually devided into 12 equal parts
(months) for each year. Standard growth chart
has 7 percentile lines and include 3,10,25,50,75,
and 97 percentiles.
• The correlation between Z scores and
percentiles can be confusing and in recent WHO
MGRS study these are tabulated below for
clarity. 9
Interpretations in growth Chart
10
Z score Exact percentile Rounded
percentile
0 50 50
-1 15.9 15
-2 2.3 3
-3 0.1 1
1 84.1 85
2 97.7 97
3 99.9 99
Z score Height for age Weight for age BMI for age
>3 May be abnormal May be abnormal obese
>2 Normal Use BMI Overweight
>1 Normal Use BMI Risk of
overweight
0 normal Use BMI normal
<-1 normal normal normal
<-2 stunted underweight wasted
<-3 Severely stunted Severely
underweight
Severe wasted
Advantages
• Seen as ‘gold standard’ of growth charts in terms of
promoting good health outcomes, including across
cultures.
• Establishes breastfeeding as the biological norm.
• More suitable to the aboriginal population as the
infants, especially in remote communities, are
predominantly brestfed.
• Have greater capacity to assist the early
identification of development of overweight
11
Limitations of growth chart
• It dose not reflect current feeding practices
• The rapid gain demonstrated in breastfed
infants first six months may not be
appropriate for all breastfed babies i.e
may indirectly discourage exclusive breast
feeding.
• Slower than the expected growth rates
may be interpreted as neglect especially in
aboriginal communities.
12
References
• Parks Textbook Of PSM
• Community Medicine with Recent
Advances- Suryakantha (3rd Edition)
• Nutrition And Child Development -
ELZABETH
13
14

WHO Growth Chart

  • 1.
    Pedagogy on GrowthChart WHO Presented By: Dr. Kunal Guided By: Dr. Abhay Mudey 1
  • 2.
    Contents • Introduction • Usesof Growth Charts • WHO Growth Charts • Basics Of Growth Chart • Interpretations in growth Chart • Advantages • Limitations • References 2
  • 3.
    Introduction • Growth: Increasein the physical size of the body as whole or any of its parts associated with increase in cell number & / or cell size. • Growth Chart: The growth of the child is monitored by recording the weight of the child periodically & plotting against the age, in a specially designed chart called Growth Chart. • It was 1st designed by David Morley. • The chart is a visible display of a graph, showing horizontal X axis & longitudinal Y axis. 3
  • 4.
    Continued.… • Well babyclinics, PHC, and ICDS programmes utilize growth charts. • The wt. measurments of a child over a period of time are plotted on the growth chart and any deviation from the normal pattern can be visualised and interpreted. • An upward curve in the road to health is ideal. • A flat and downward curves are not desirable. • WHO charts – blue for boys and pink for girls 4
  • 5.
    USES OF GROWTHCHART • Diagnostic tool-To identify high risk children. • Planning and policy making • Education tool for educating mothers • Tool for action helps in type of intervention that is needed • Evaluation of effectiveness of corrective measure and impact of a programme of special interventions for improving Childs growth and development • Tool for teaching. • Calculate drug dosage. 5
  • 6.
    WHO GROWTH CHART •MULTICENTRIC GROWTH REFERENCE STUDY(MGRS)- • Participating countries include Brazil, Ghana, India, Norway, Oman, and USA. • Data collected by trained staff using a common protocol • Sample selected from communities where there were no environmental constraints to growth. • The new growth reference is based on breastfeeding as the biological norm. • Measurements include weight/age, height/age, and weight/height. Data on BMI was generated for children under 5 for the 1st time. 6
  • 7.
  • 8.
  • 9.
    BASICS OF GROWTHCHART • Consists of X axis which is usually in years or months and y axis that changes according to the reference e.g. cm, inches, kg, kg/m2. • the x axis is usually devided into 12 equal parts (months) for each year. Standard growth chart has 7 percentile lines and include 3,10,25,50,75, and 97 percentiles. • The correlation between Z scores and percentiles can be confusing and in recent WHO MGRS study these are tabulated below for clarity. 9
  • 10.
    Interpretations in growthChart 10 Z score Exact percentile Rounded percentile 0 50 50 -1 15.9 15 -2 2.3 3 -3 0.1 1 1 84.1 85 2 97.7 97 3 99.9 99 Z score Height for age Weight for age BMI for age >3 May be abnormal May be abnormal obese >2 Normal Use BMI Overweight >1 Normal Use BMI Risk of overweight 0 normal Use BMI normal <-1 normal normal normal <-2 stunted underweight wasted <-3 Severely stunted Severely underweight Severe wasted
  • 11.
    Advantages • Seen as‘gold standard’ of growth charts in terms of promoting good health outcomes, including across cultures. • Establishes breastfeeding as the biological norm. • More suitable to the aboriginal population as the infants, especially in remote communities, are predominantly brestfed. • Have greater capacity to assist the early identification of development of overweight 11
  • 12.
    Limitations of growthchart • It dose not reflect current feeding practices • The rapid gain demonstrated in breastfed infants first six months may not be appropriate for all breastfed babies i.e may indirectly discourage exclusive breast feeding. • Slower than the expected growth rates may be interpreted as neglect especially in aboriginal communities. 12
  • 13.
    References • Parks TextbookOf PSM • Community Medicine with Recent Advances- Suryakantha (3rd Edition) • Nutrition And Child Development - ELZABETH 13
  • 14.