The document provides a comprehensive overview of database management systems (DBMS), discussing key concepts such as types of databases, data models, and the differences between file management systems and DBMS. It highlights the importance of data integrity, operations, and various models including hierarchical, network, and relational models. Additionally, it addresses the applications, advantages, and disadvantages of DBMS, as well as data warehousing and its significance in integrating and analyzing data for decision-making.
Overview of the course unit on Database Management Systems including key topics such as data types, DBMS basics, advantages, and applications.
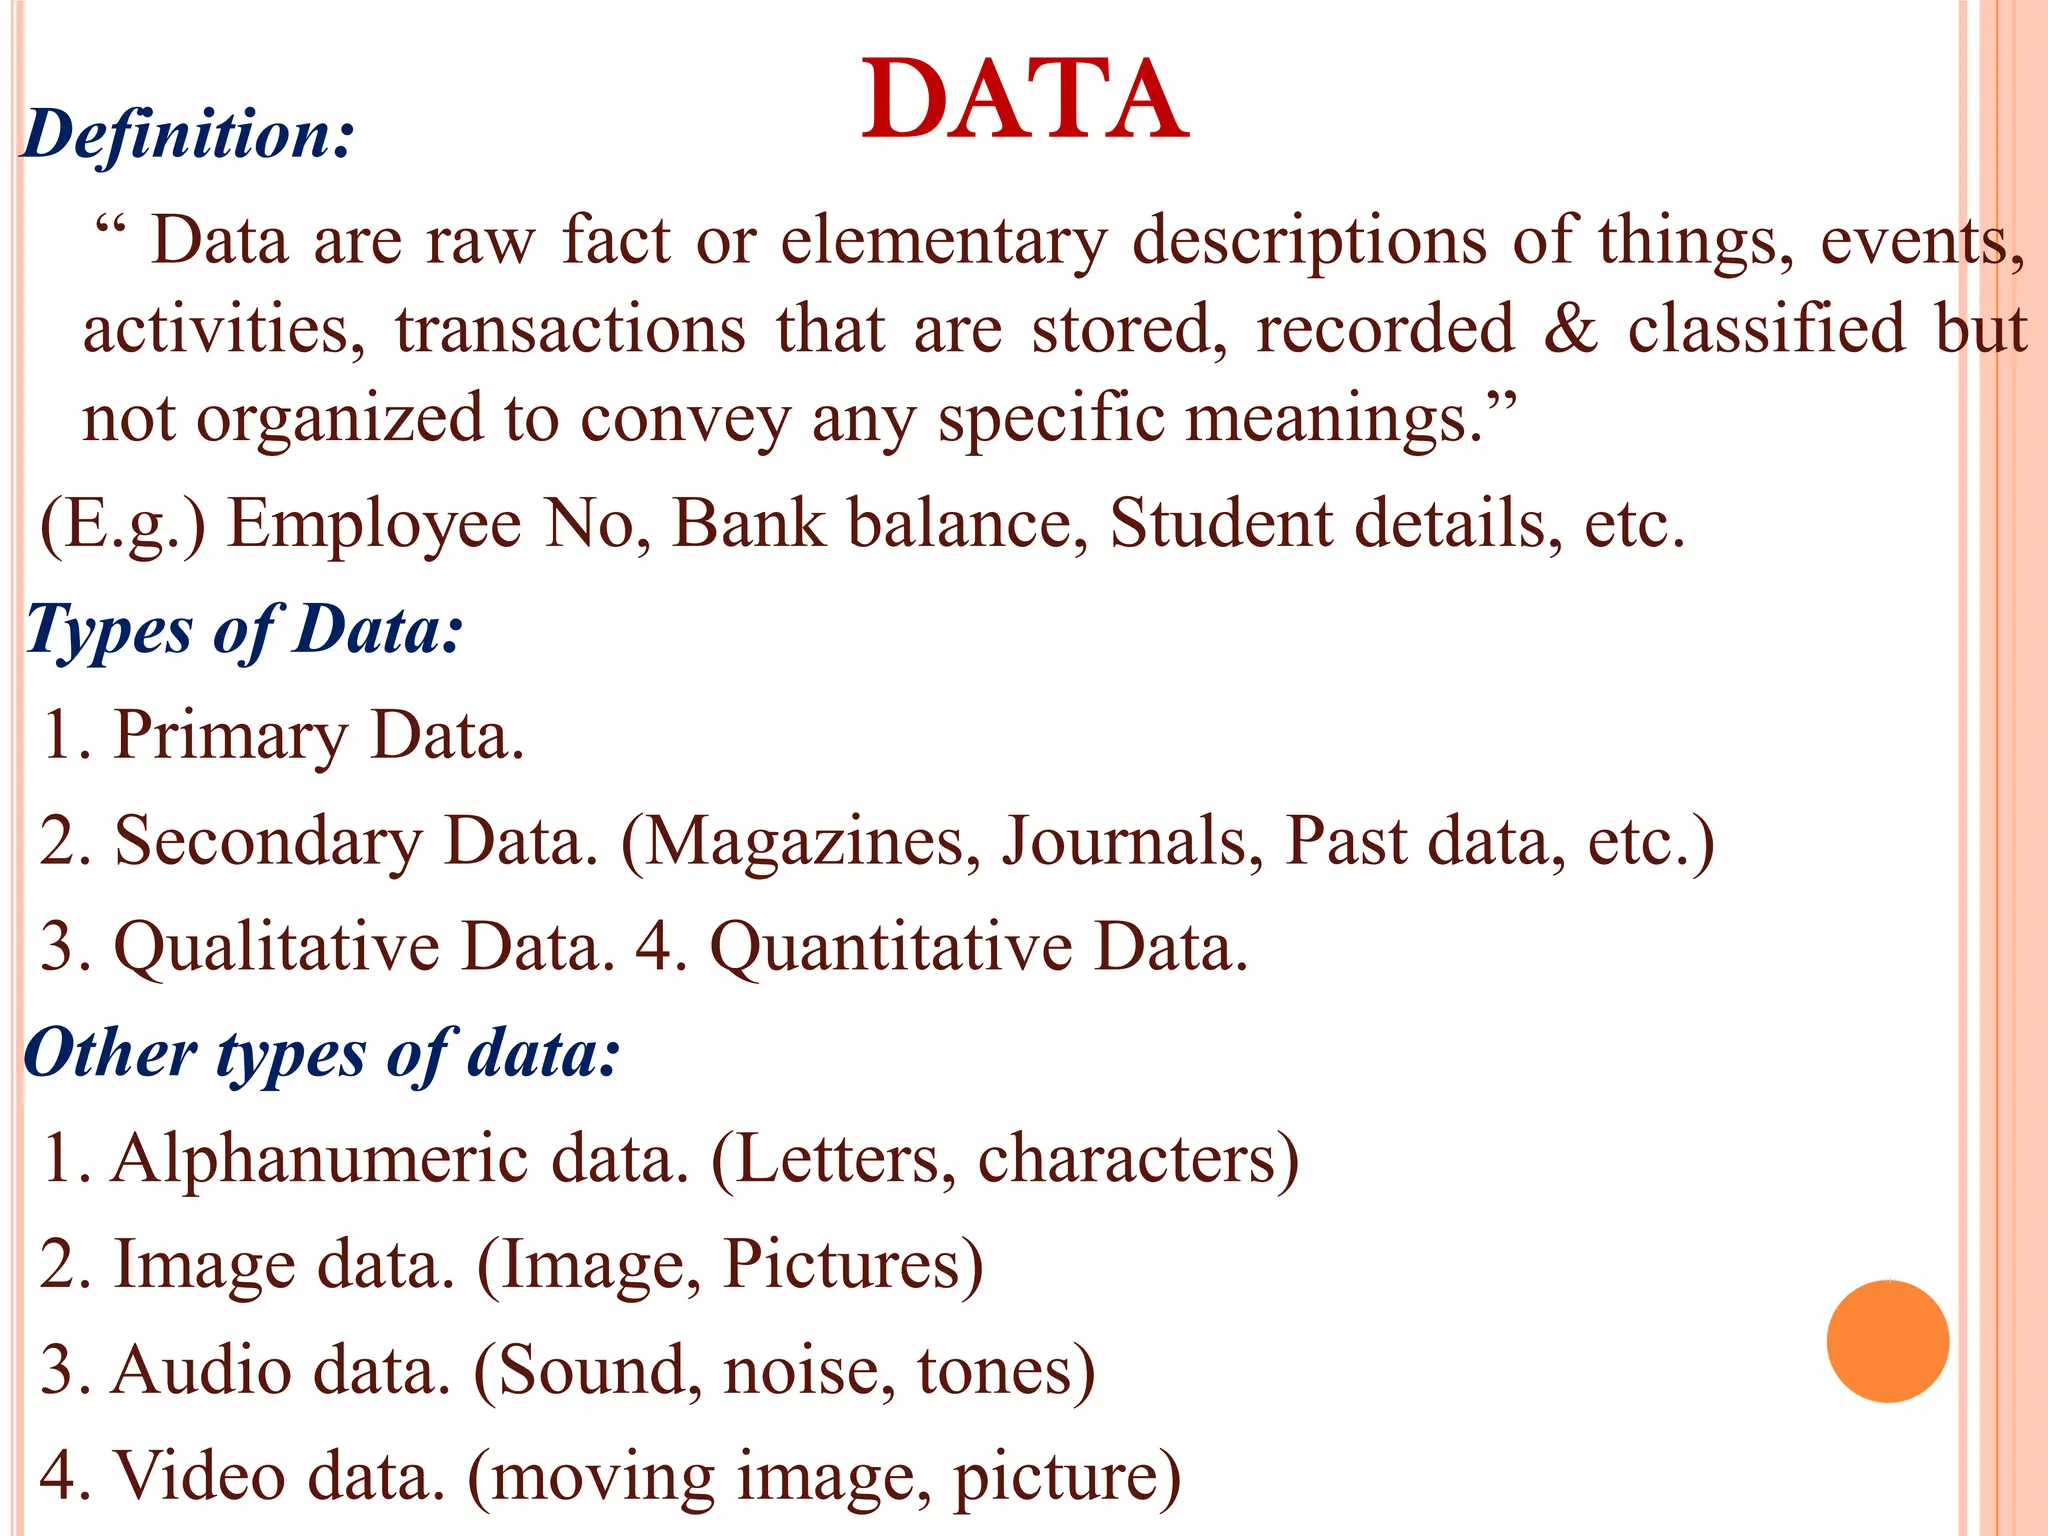
Defining data, its types (primary, secondary, qualitative, quantitative) and characteristics of a database, emphasizing organization and relationships.
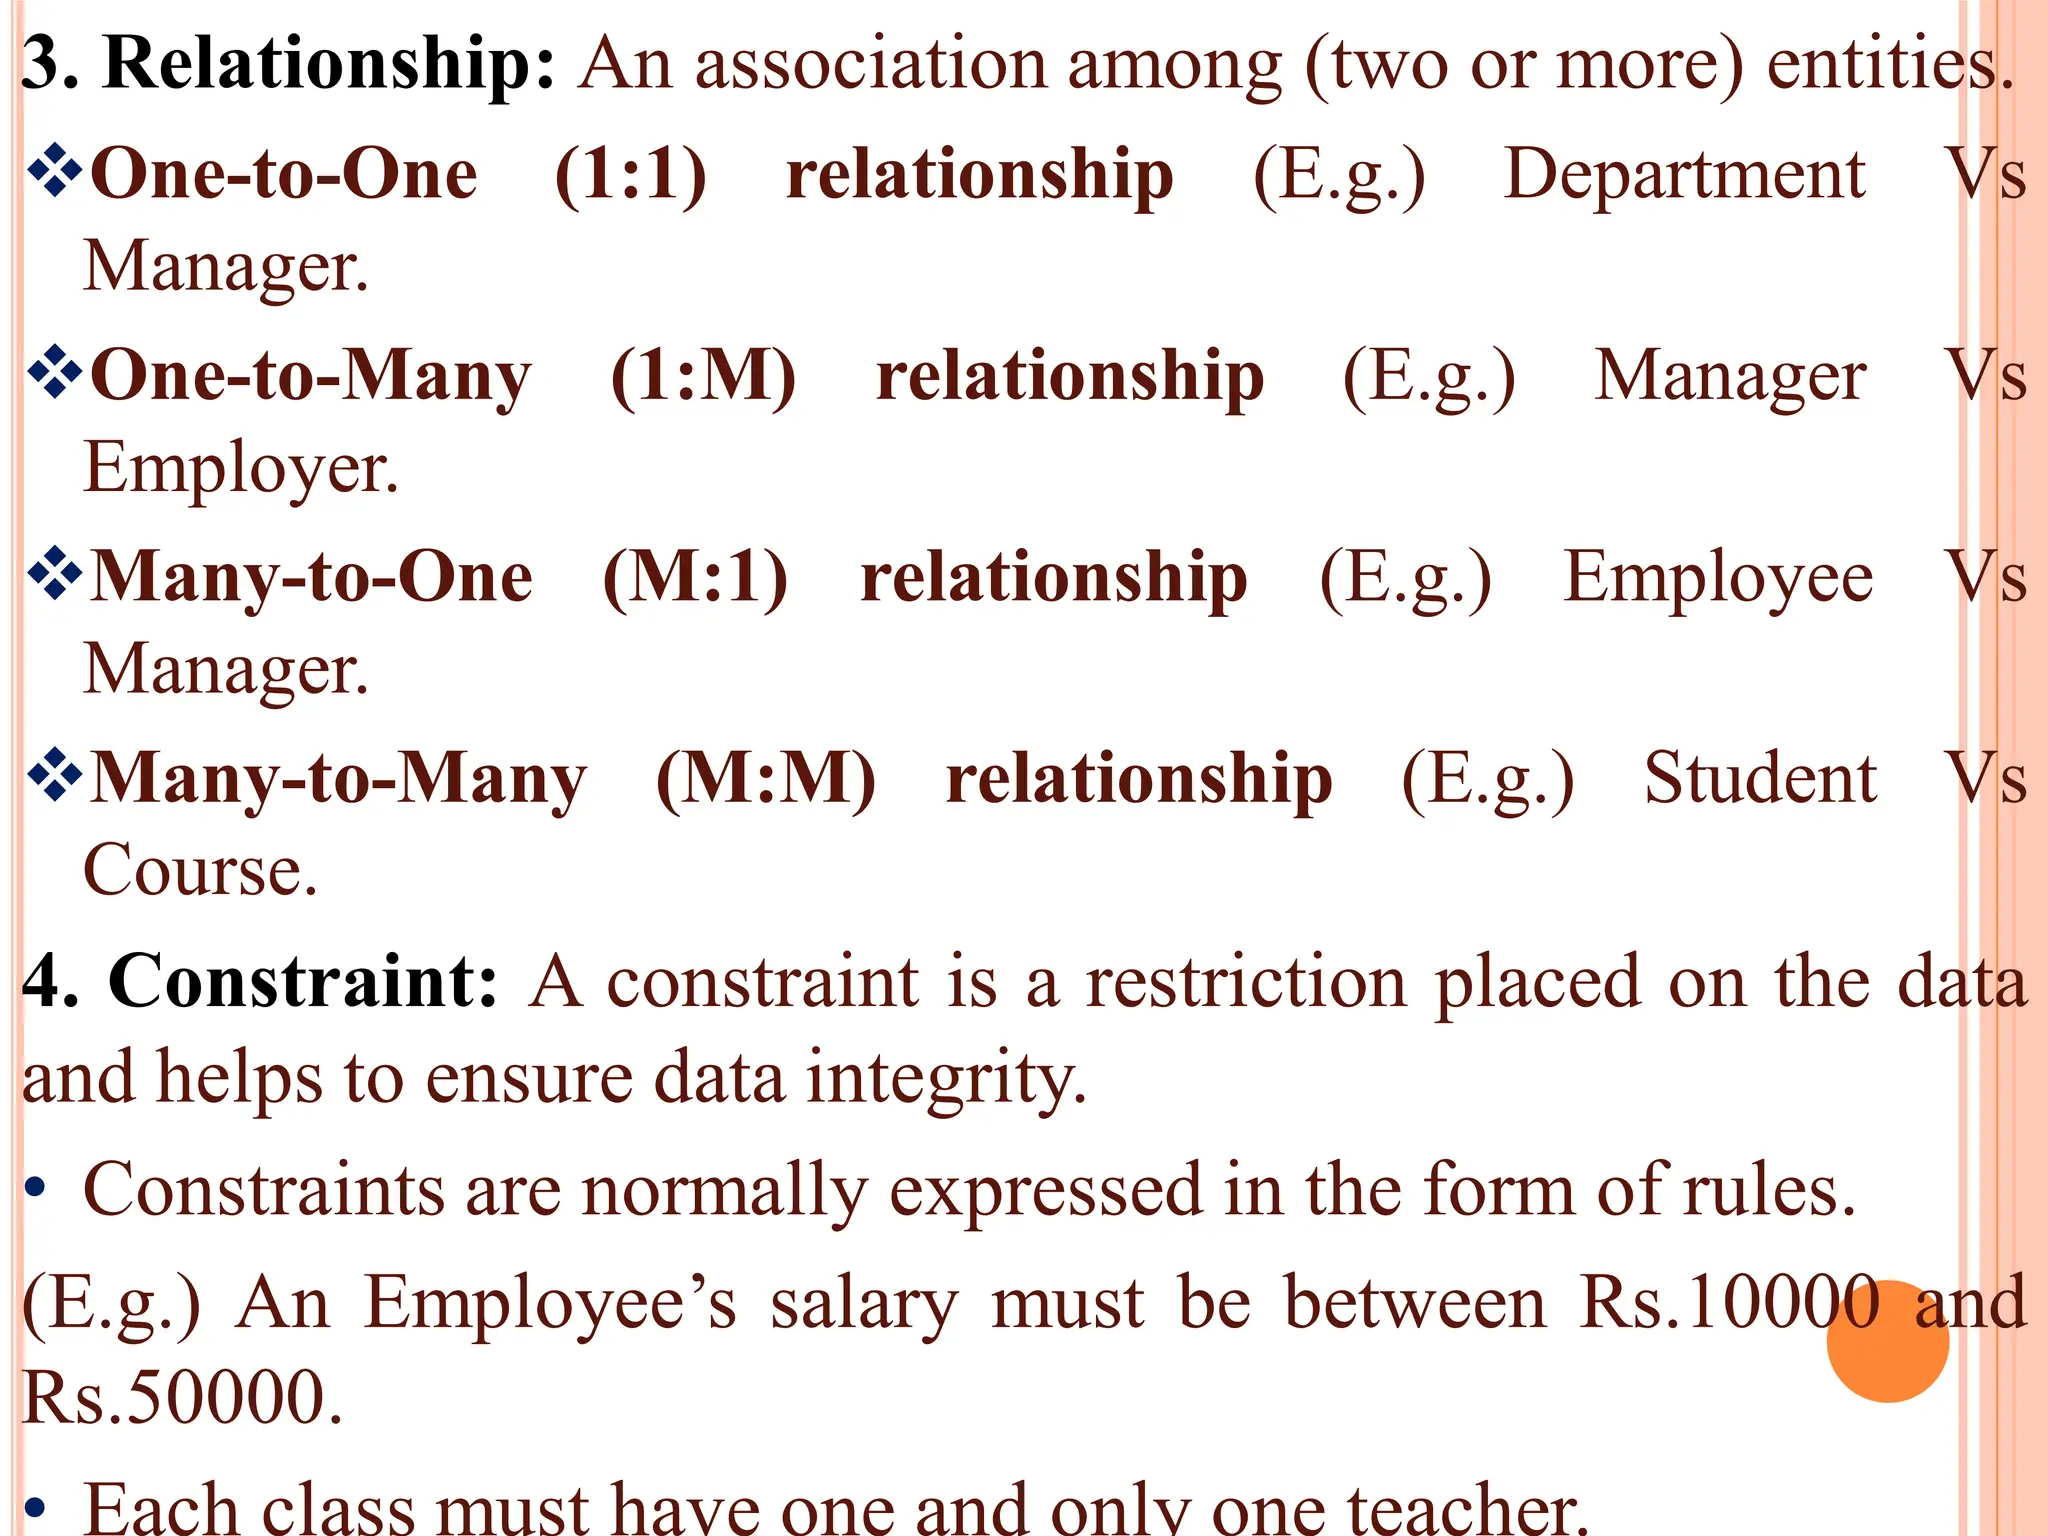
Common database operations like insertion, selection, updation, and deletion, along with an introduction to database models and their components.
Importance and characteristics of data models, including their roles in structuring, relationships, and integrity rules within databases.
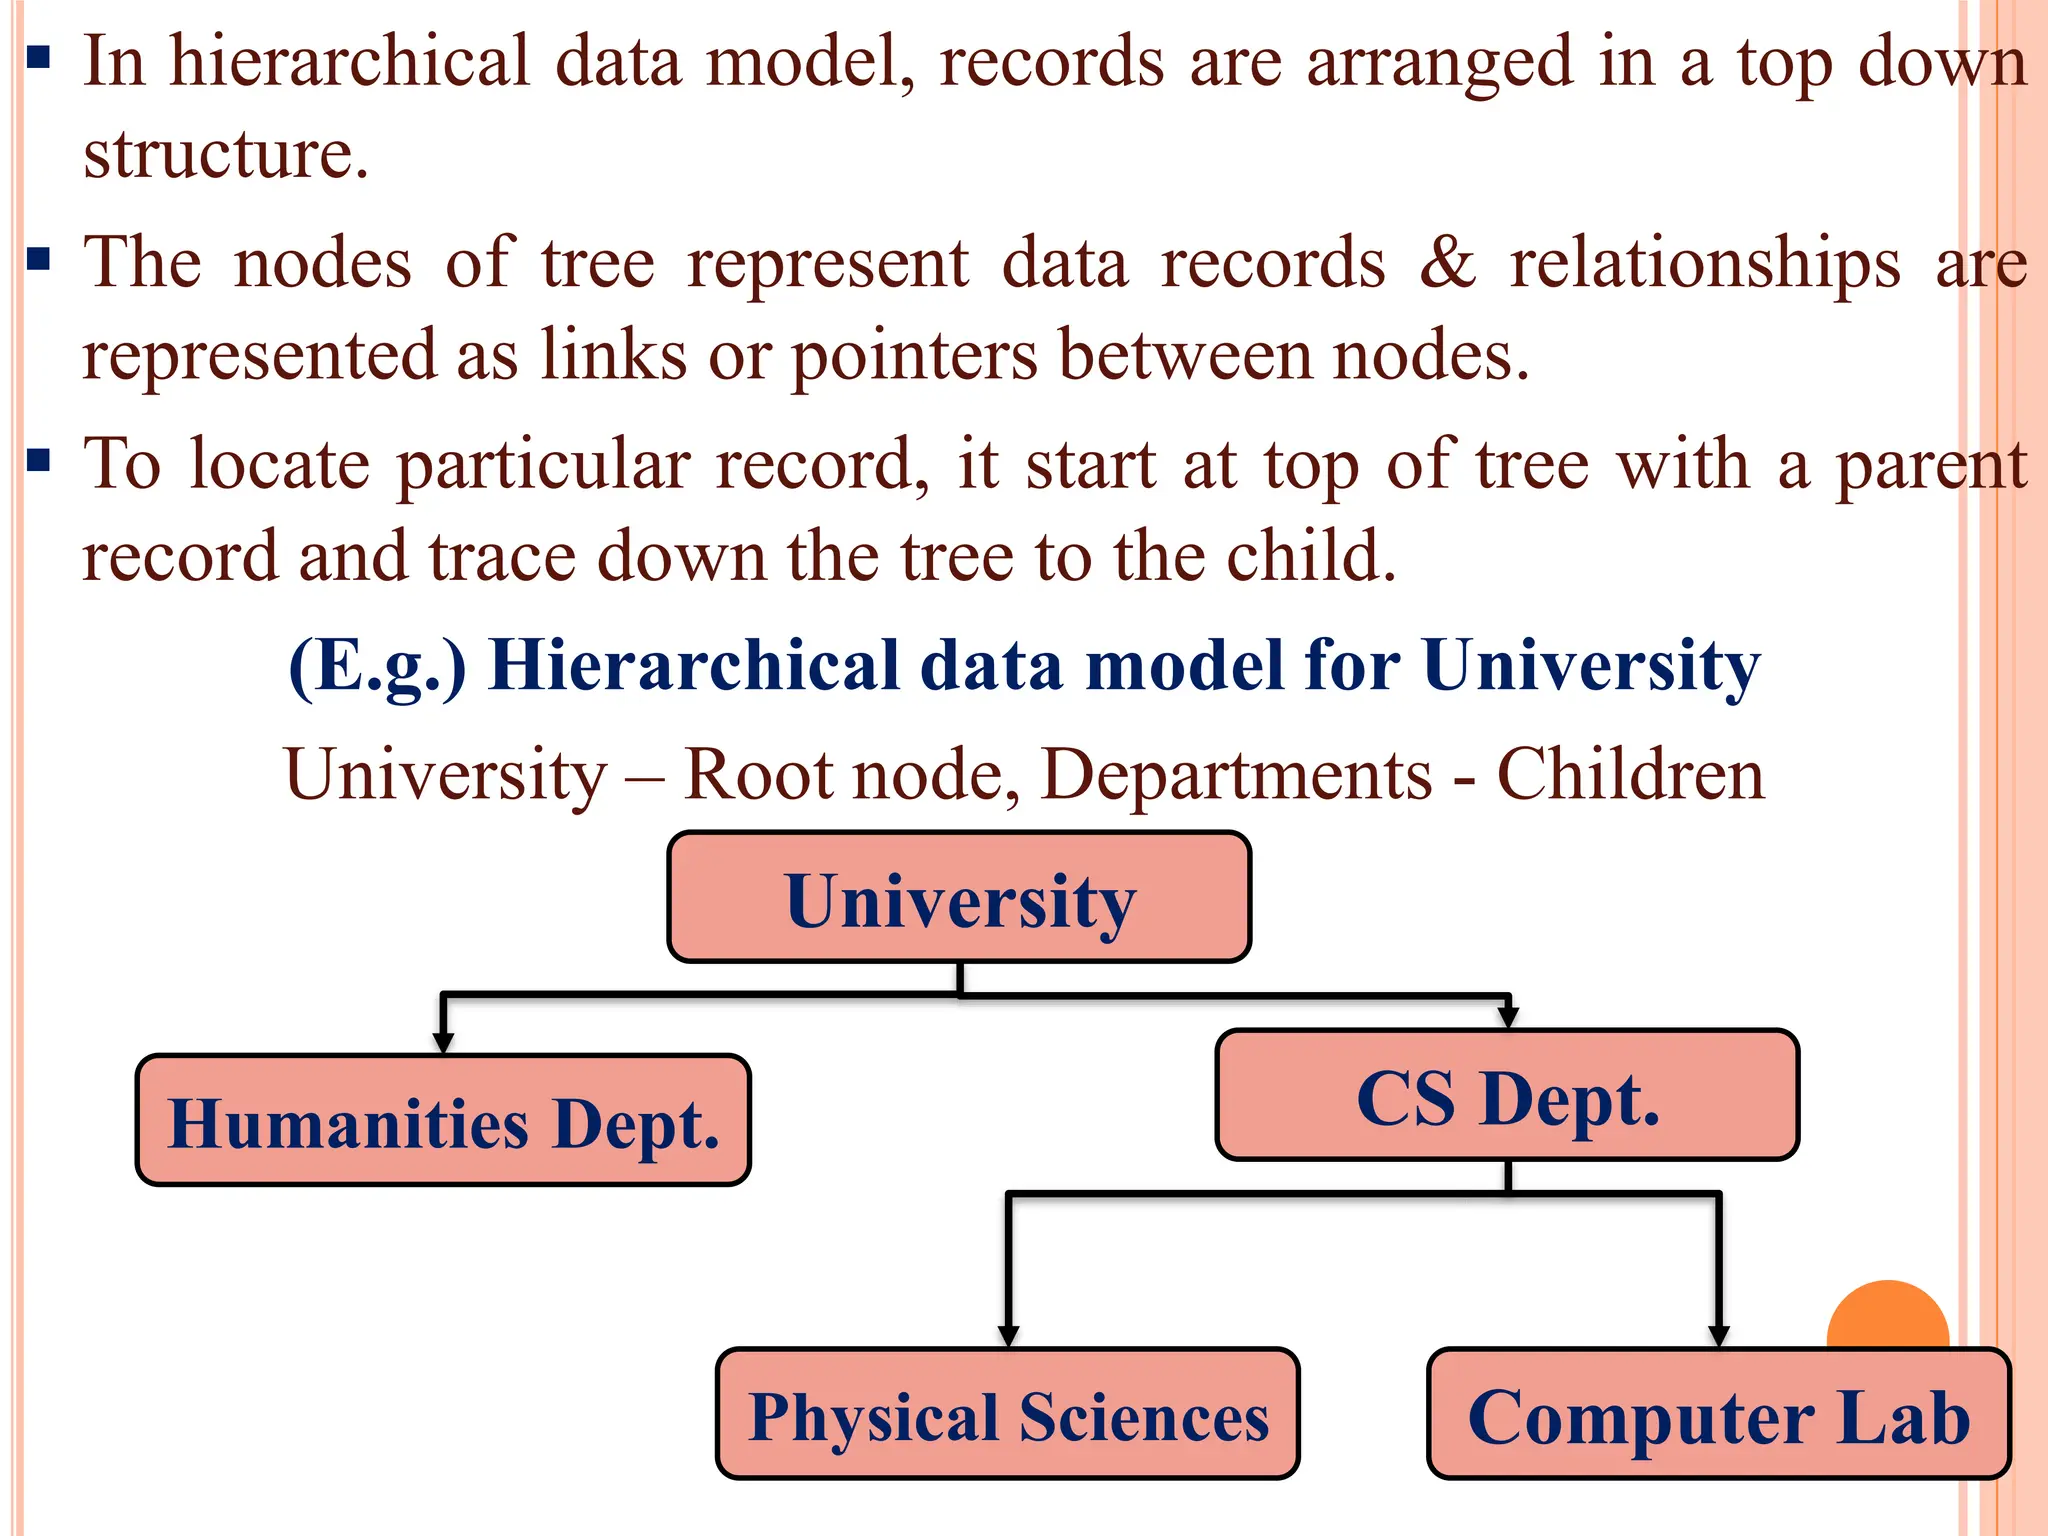
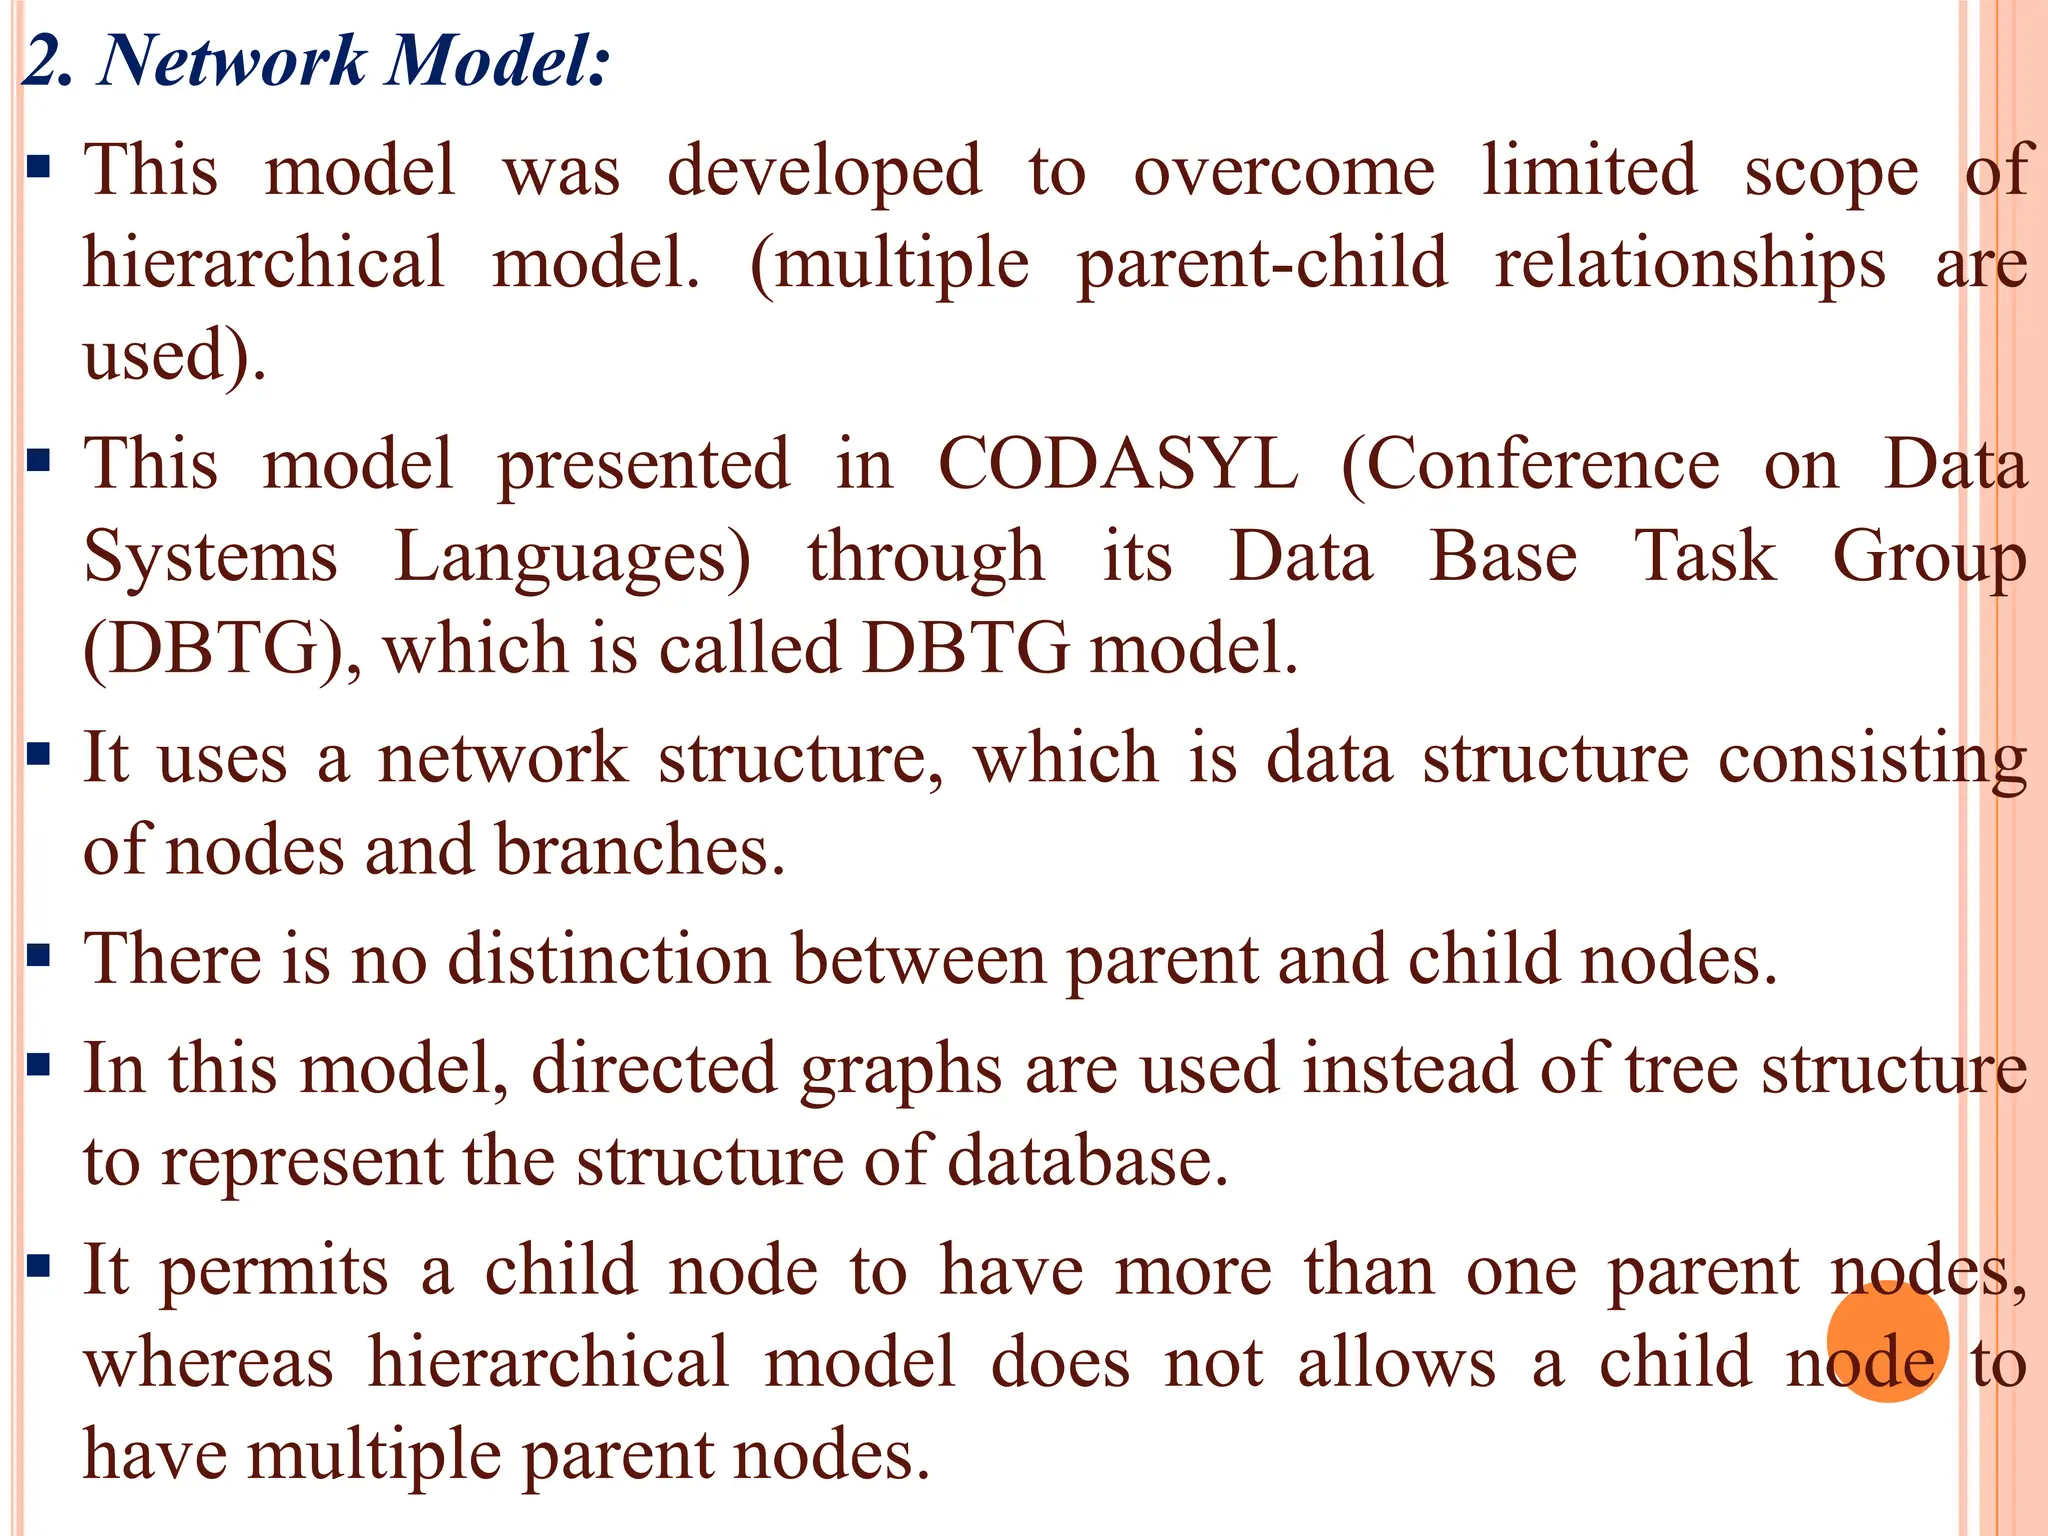
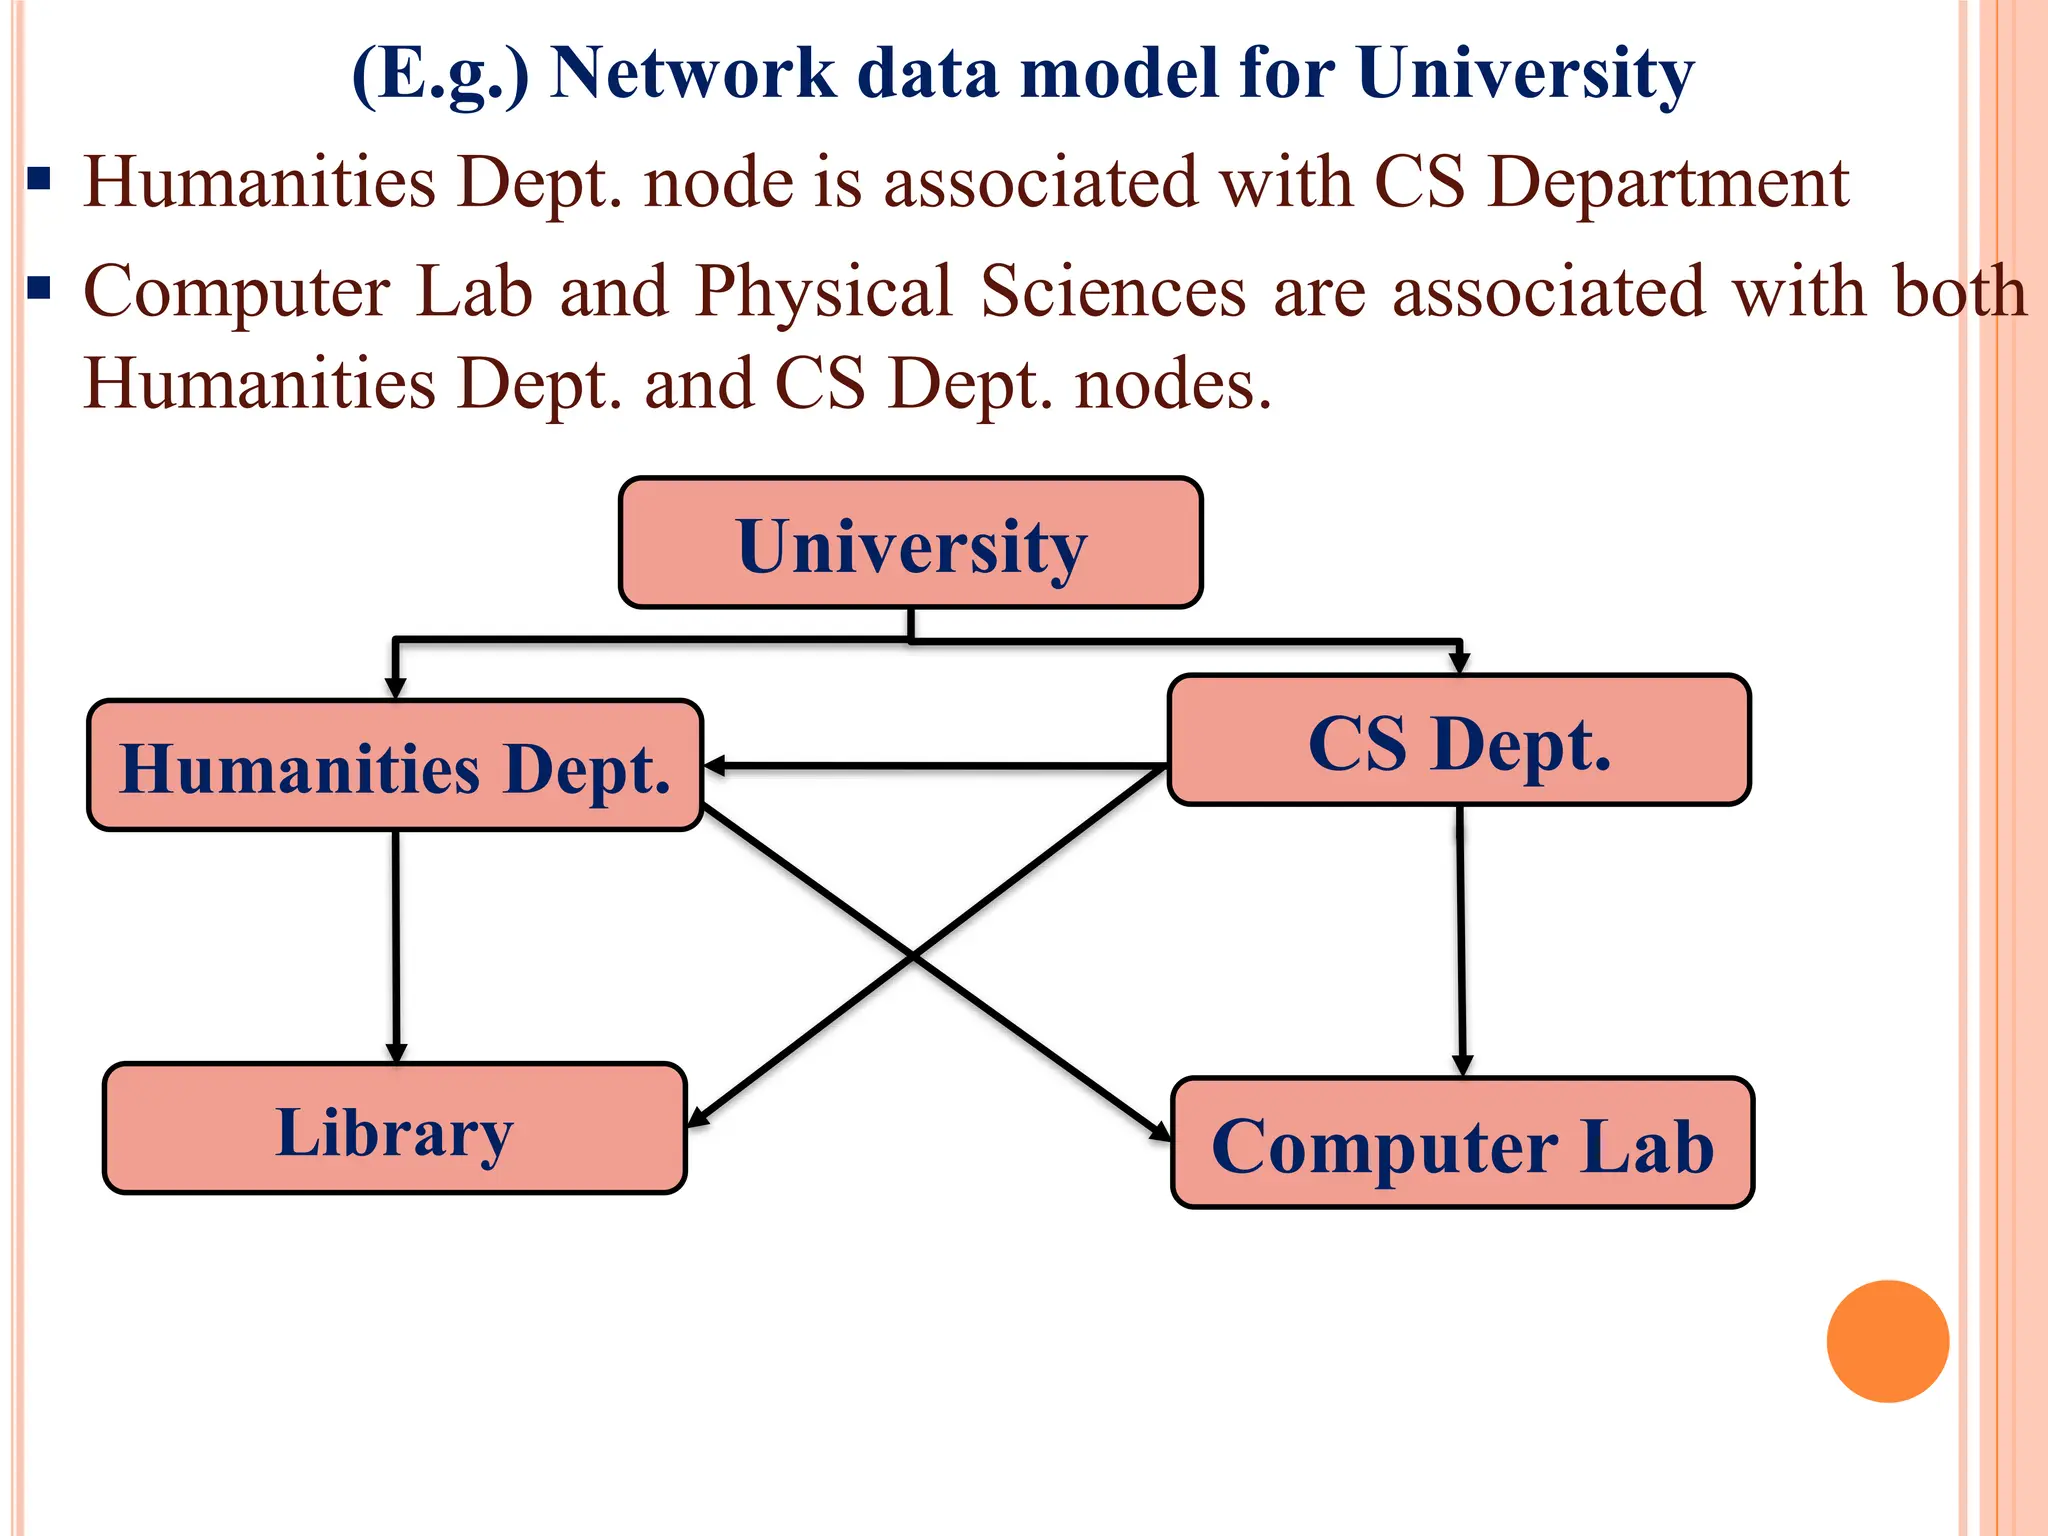
Transition from hierarchical models to network models, explaining their structures and examples, emphasizing relationships between nodes.
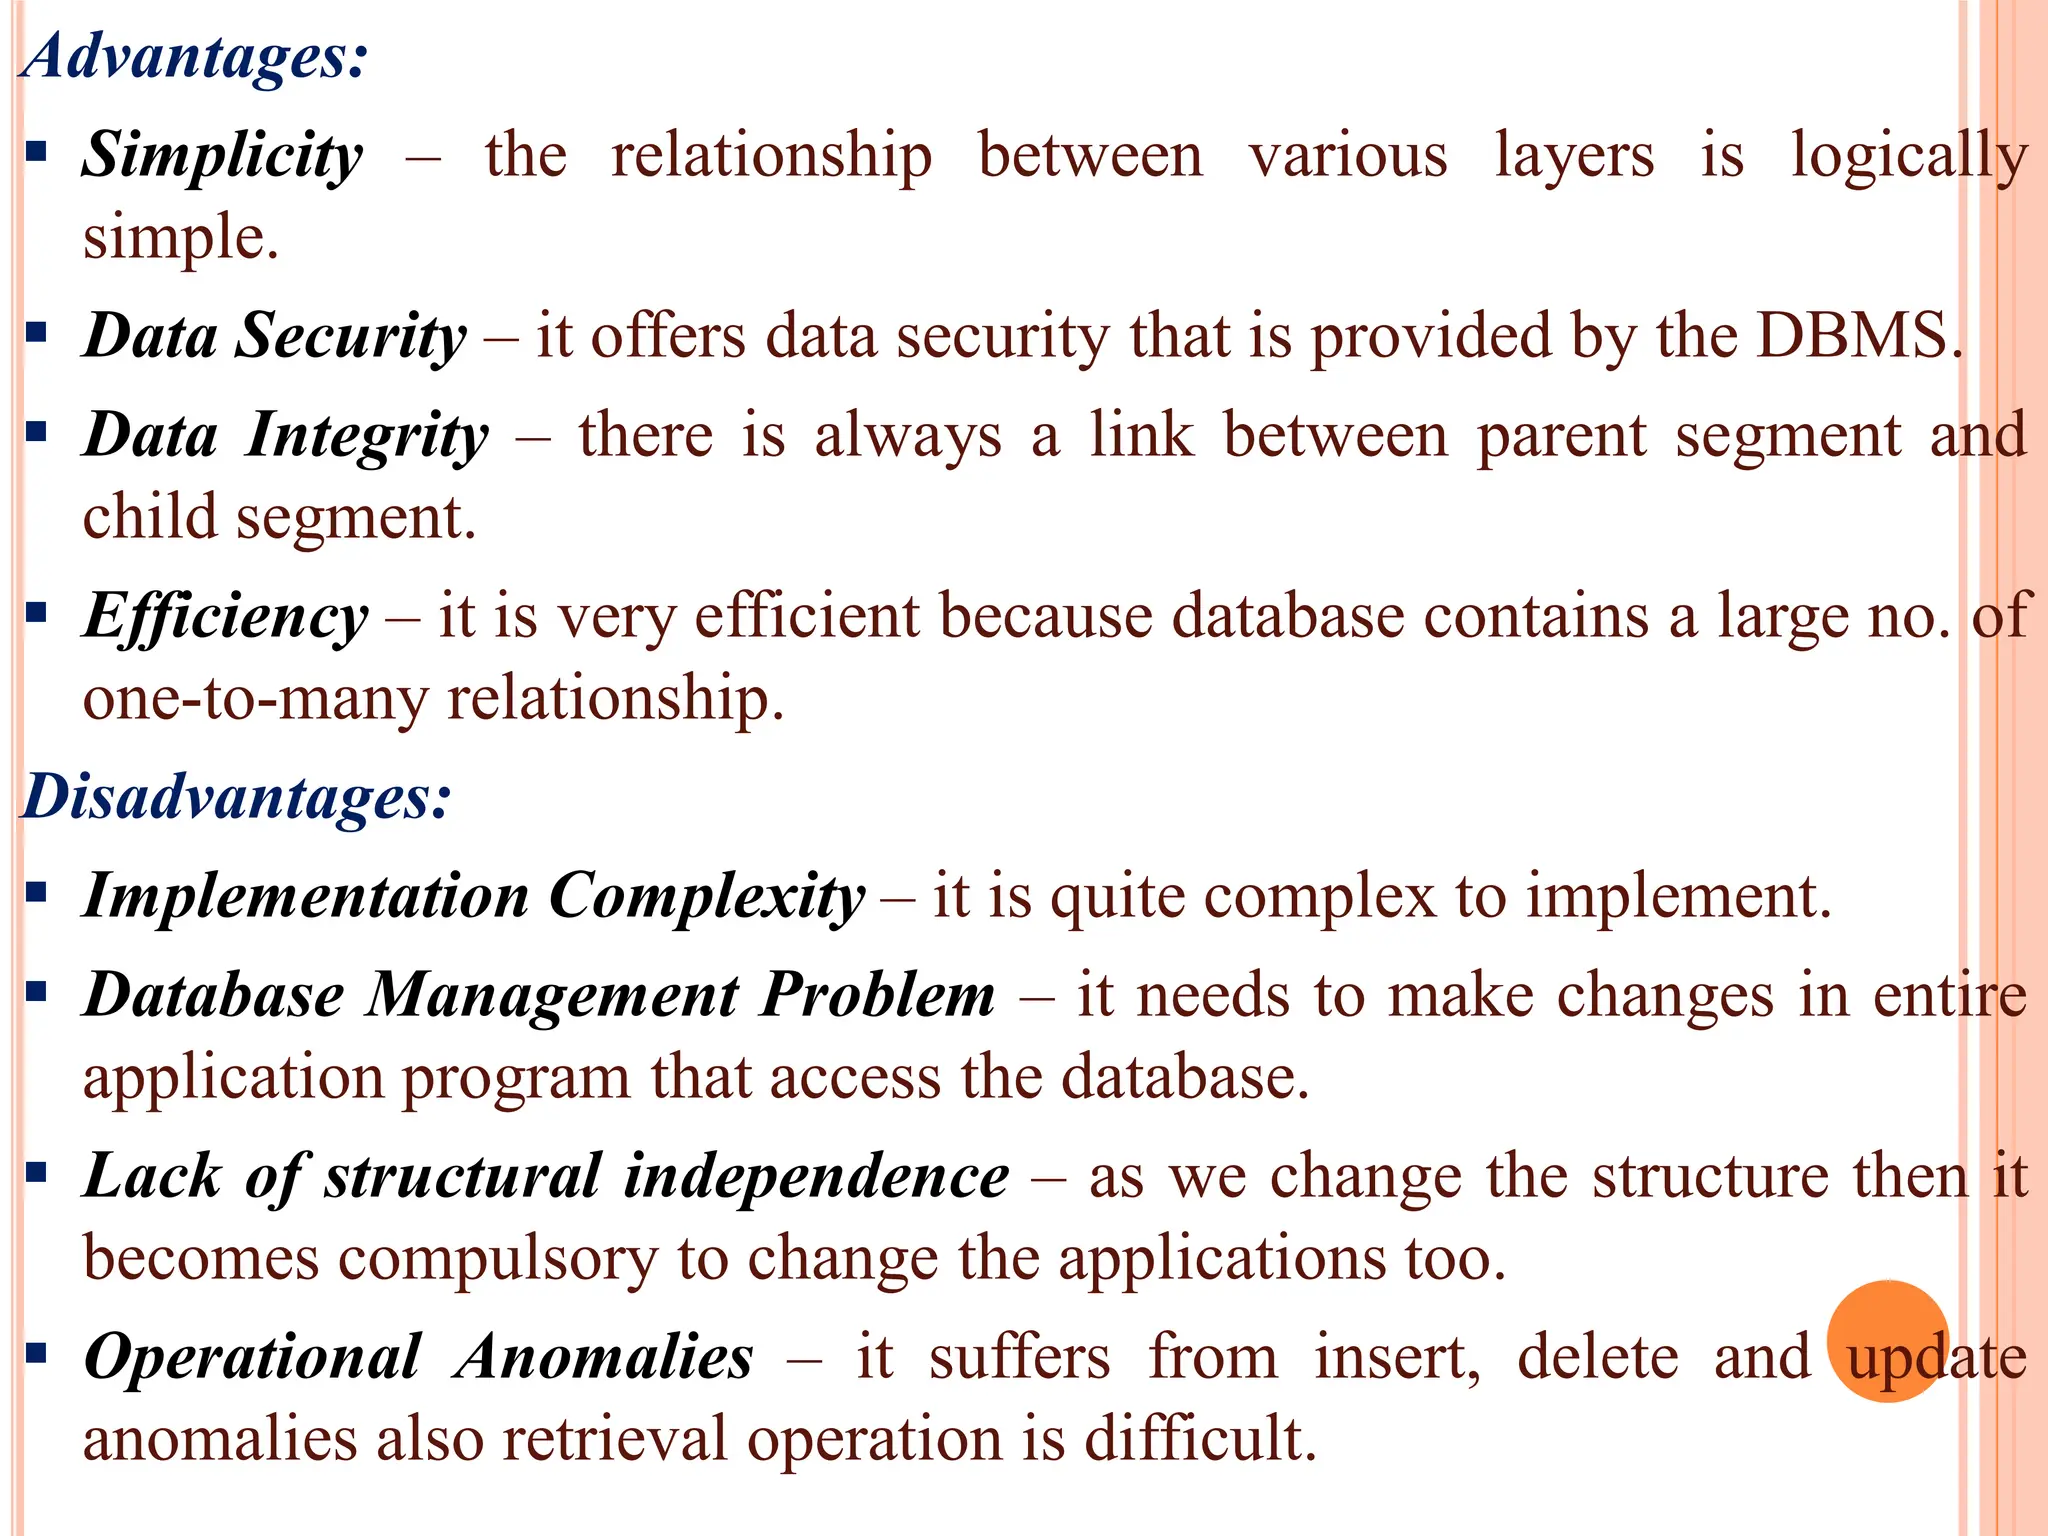
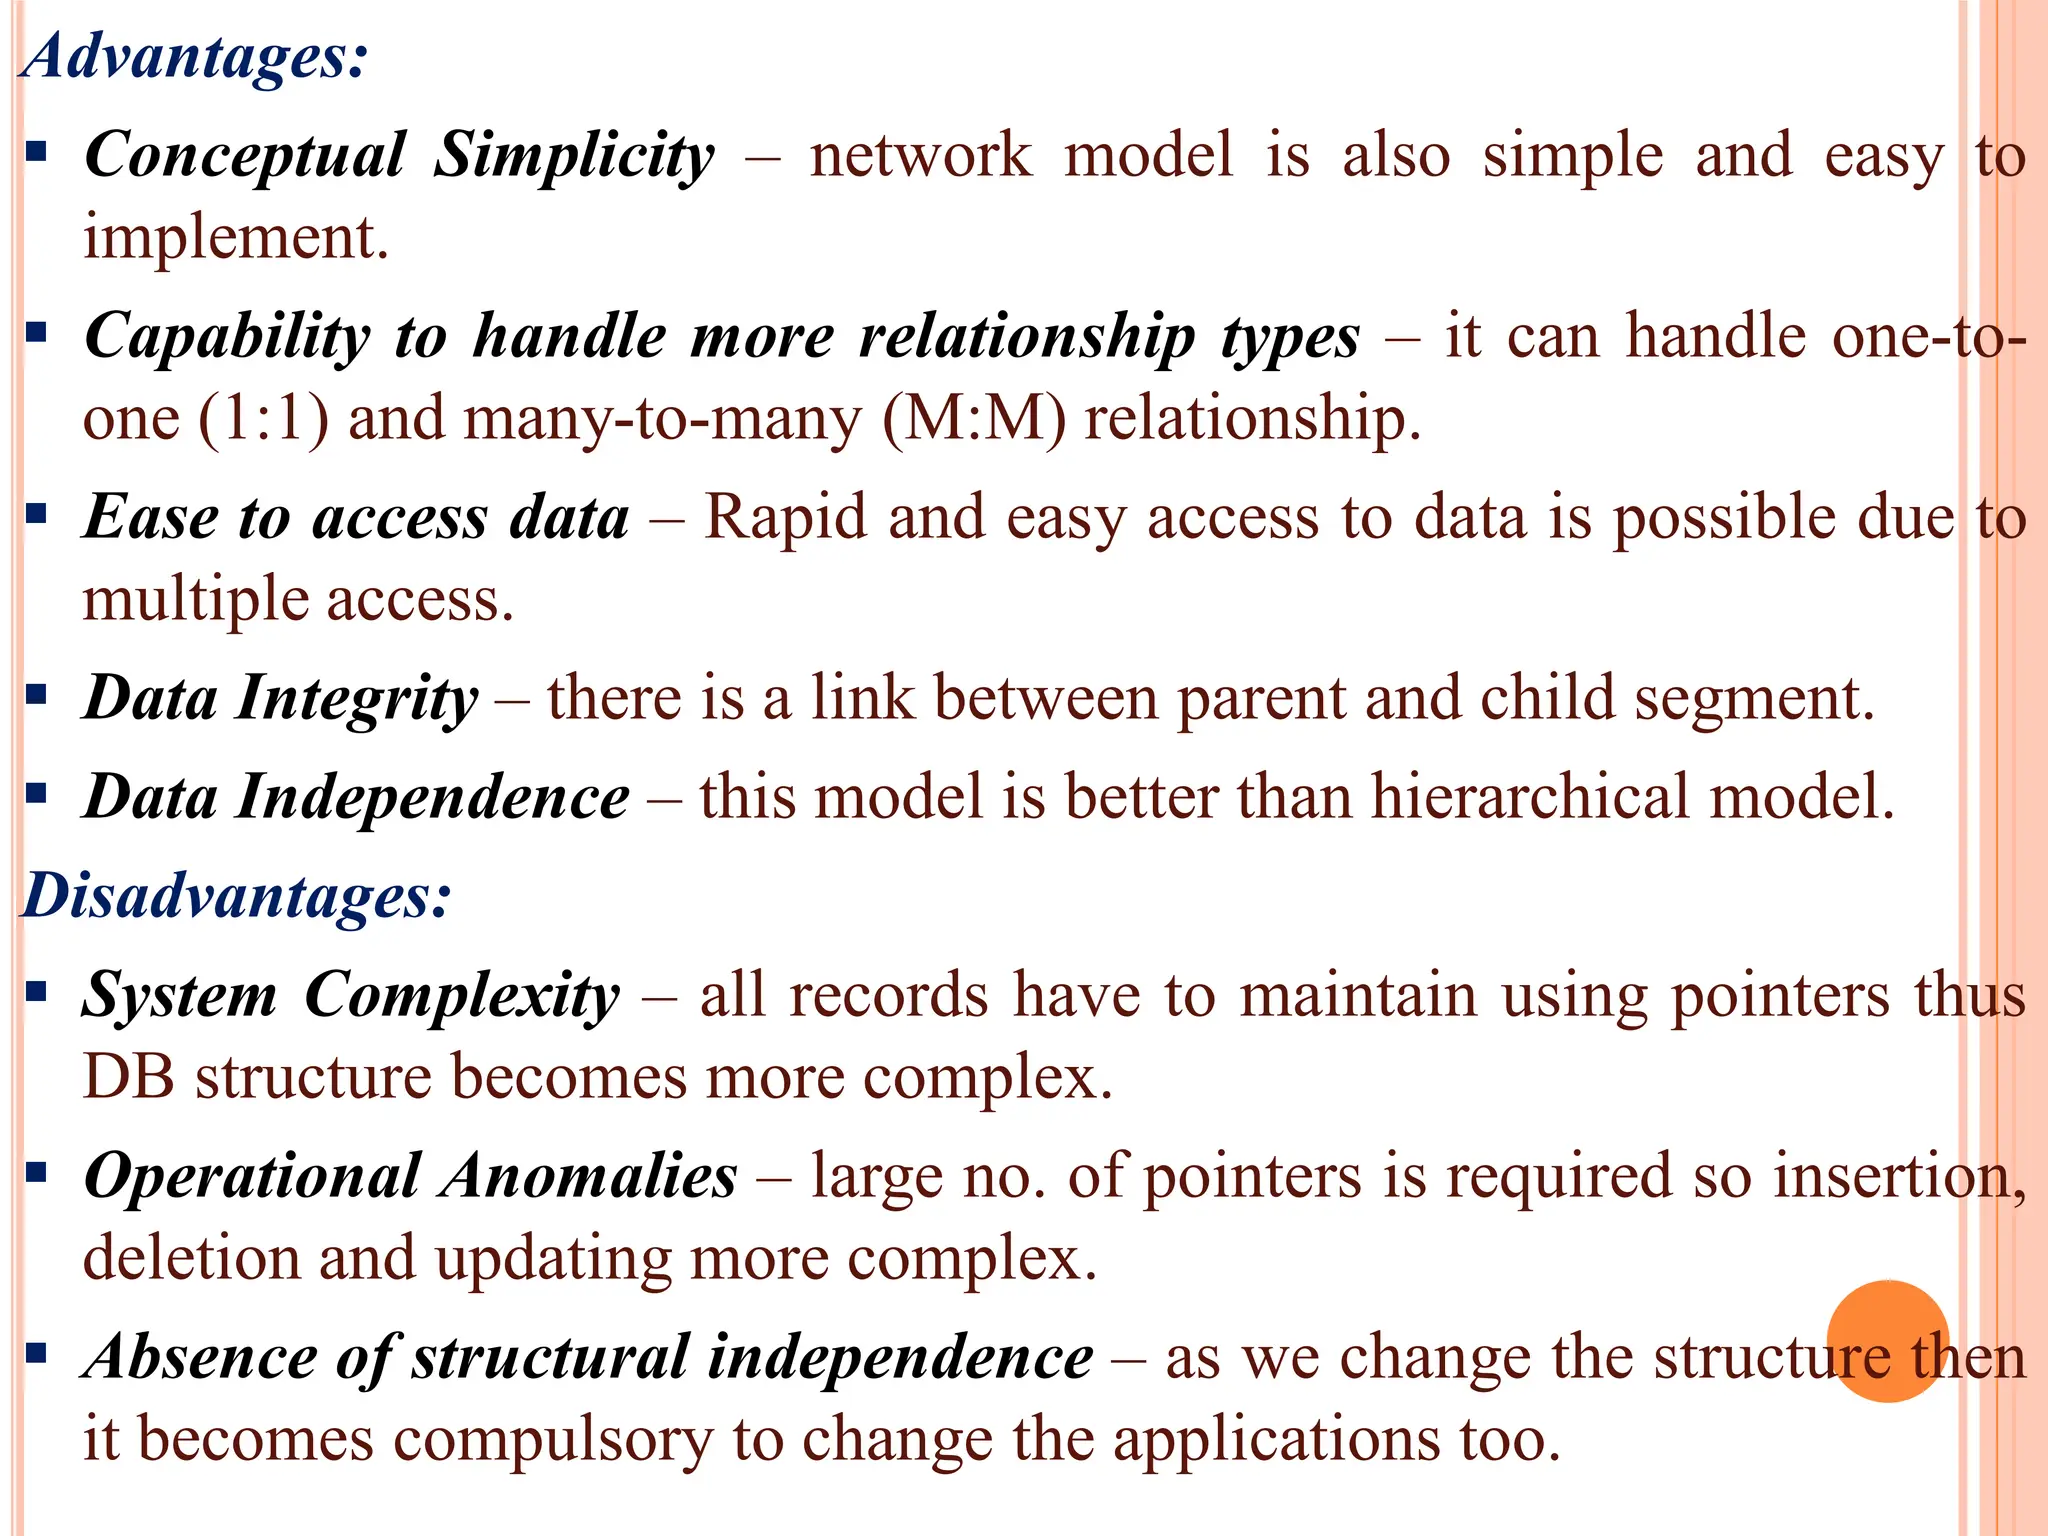
Advantages and drawbacks of the network model compared to hierarchical models, including complexity and operational issues.
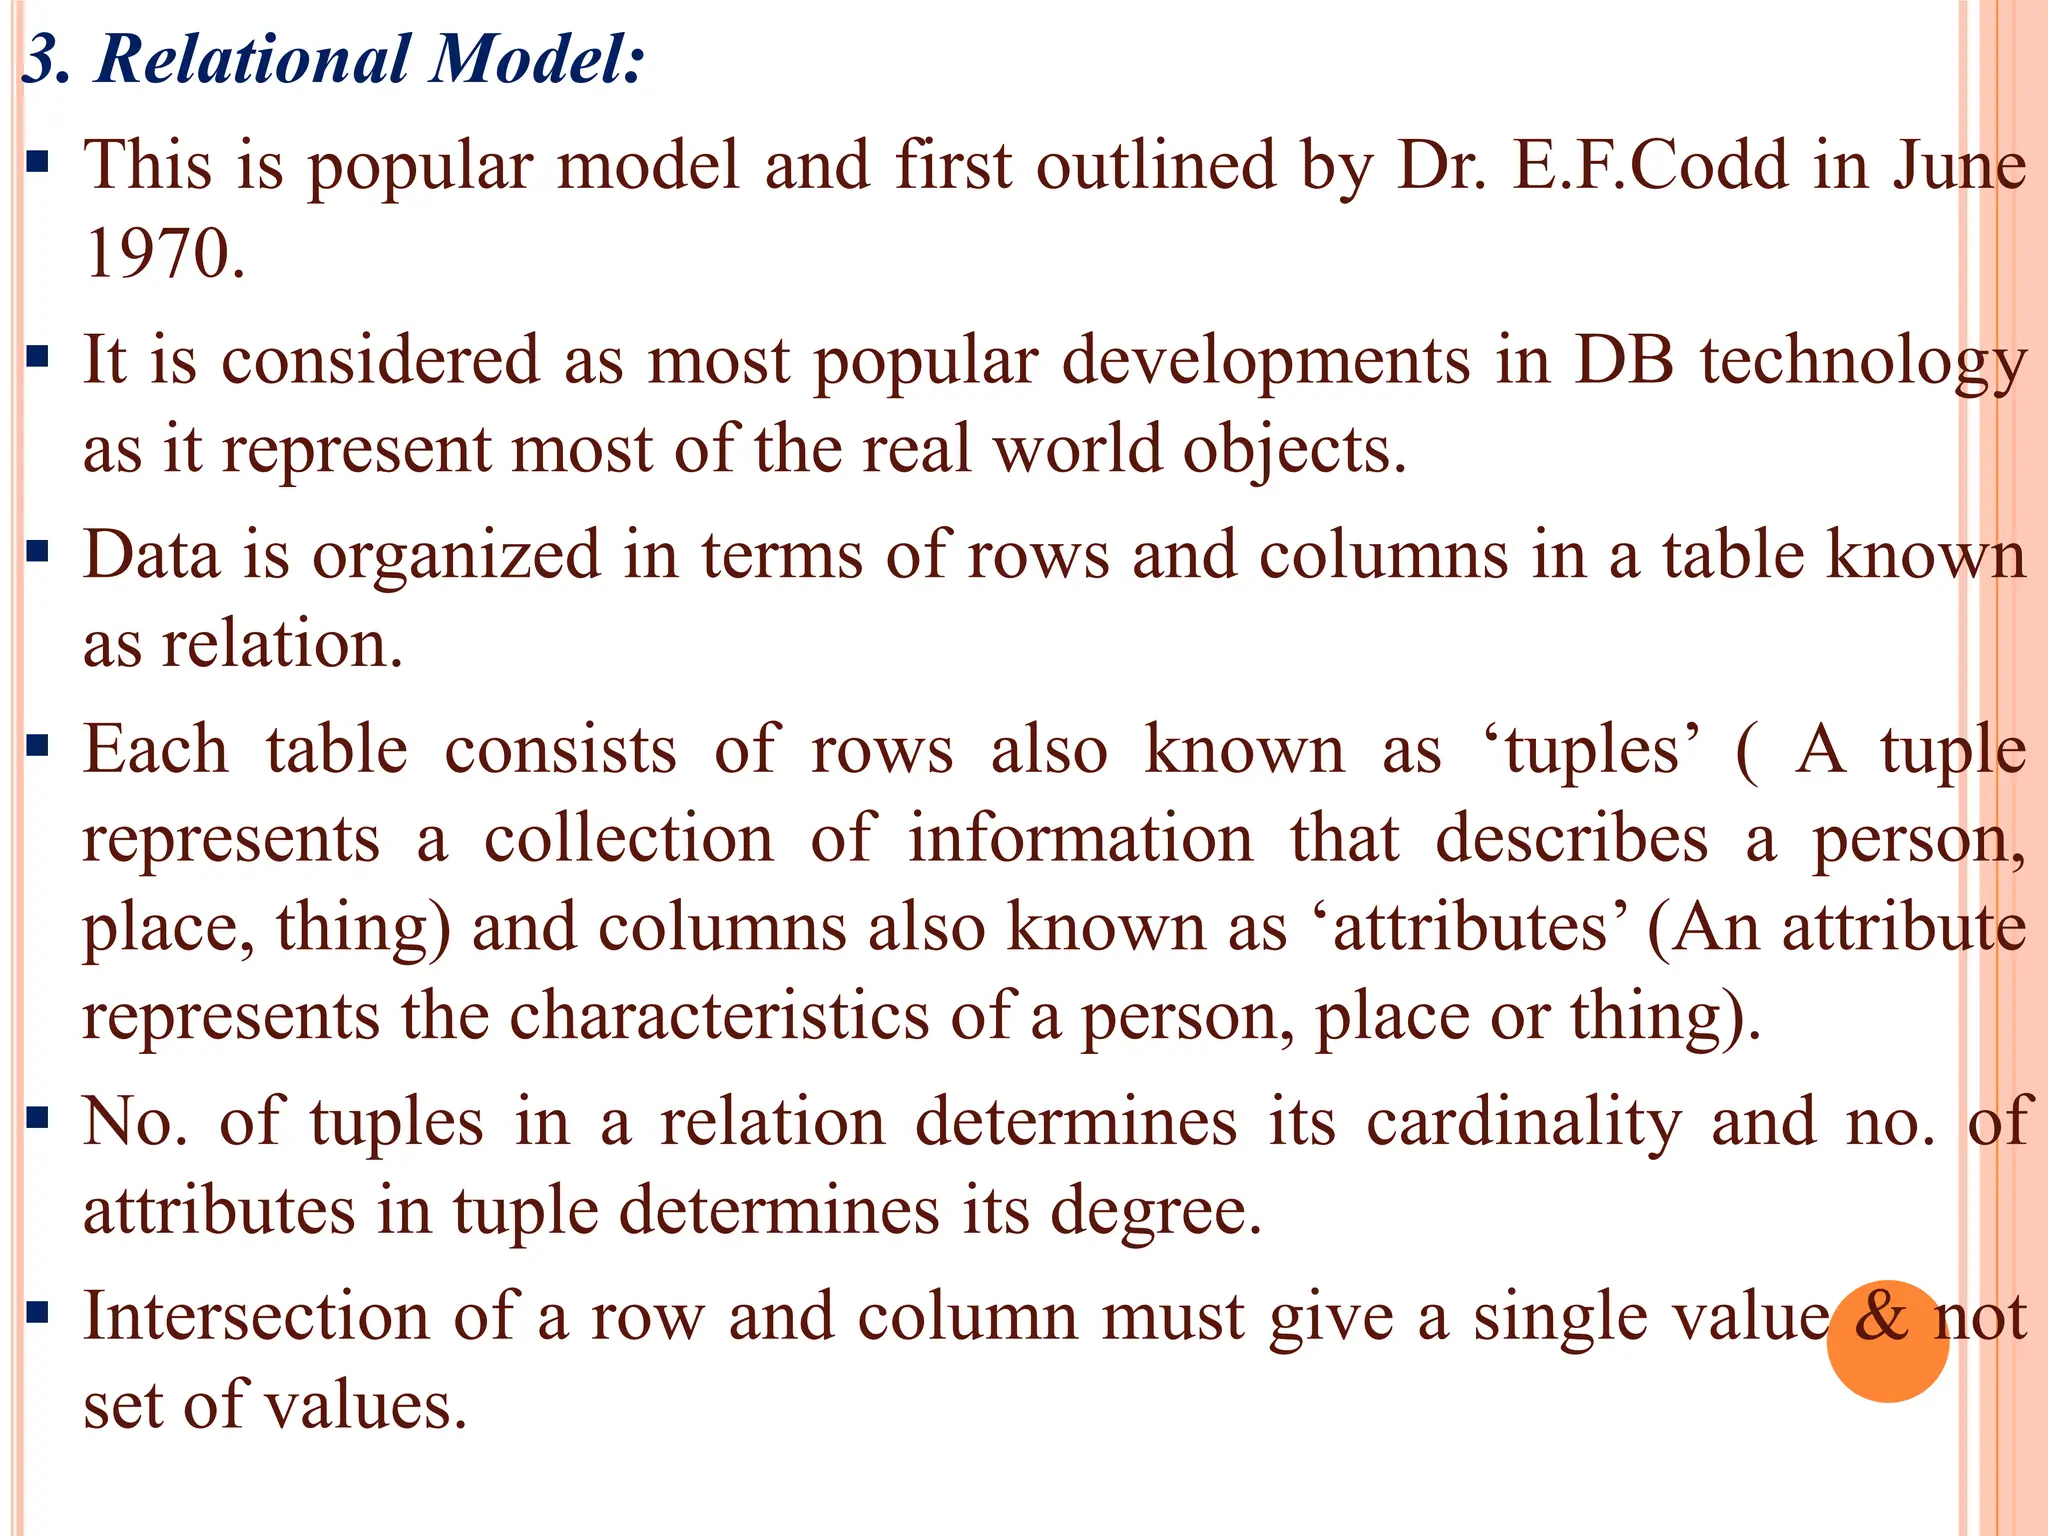
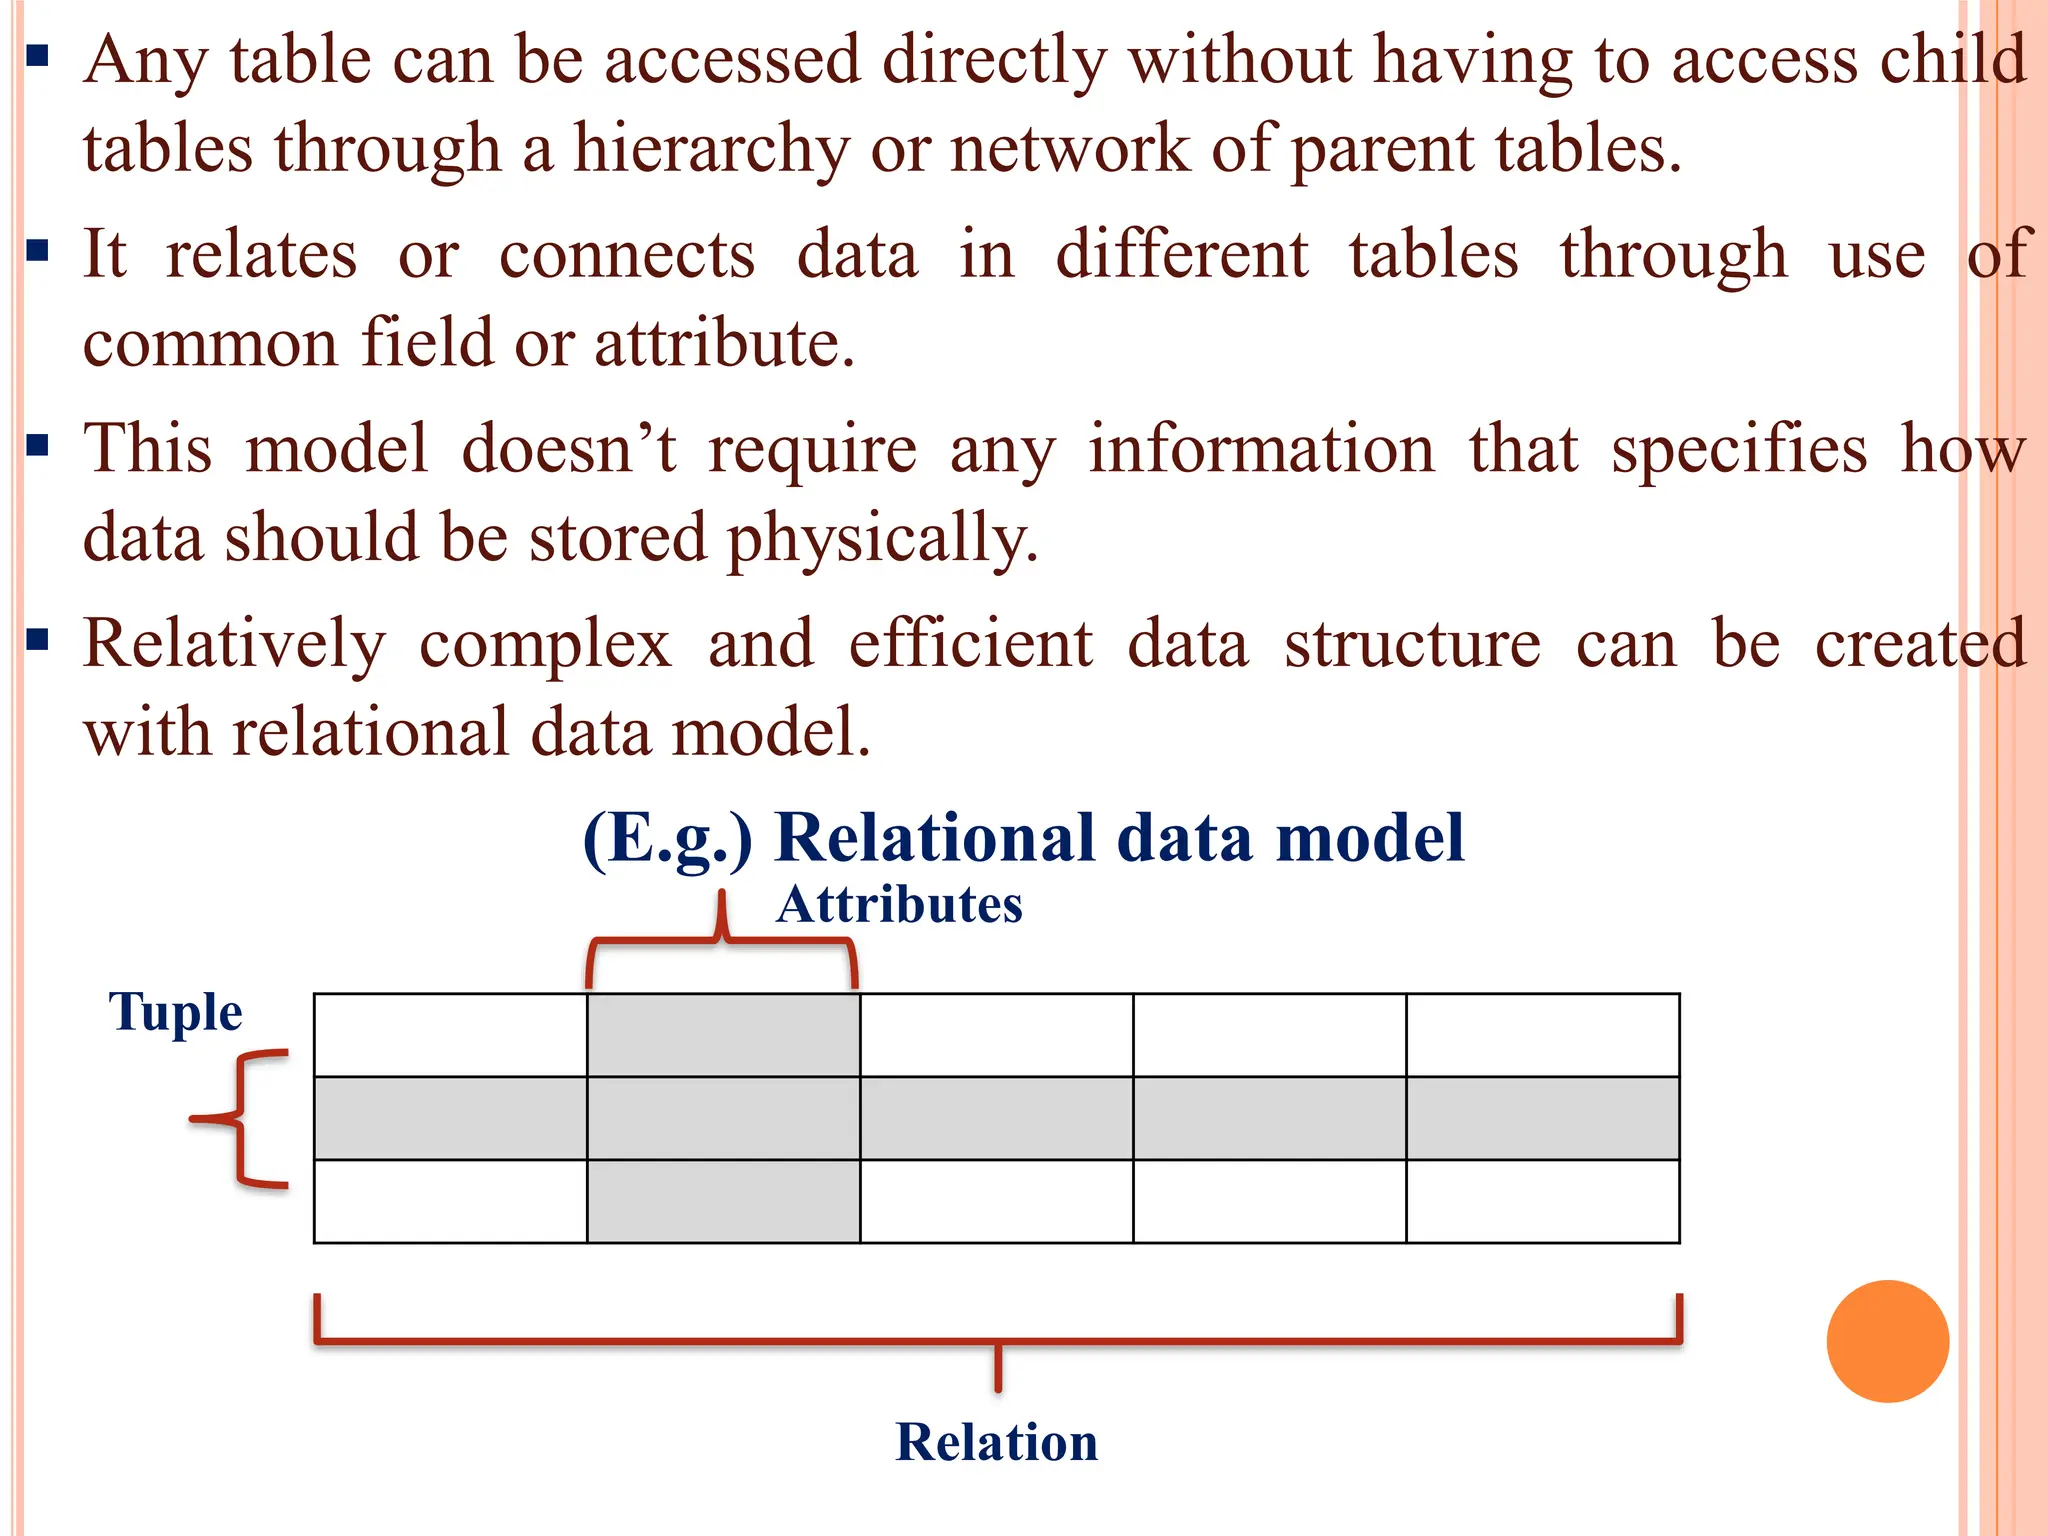
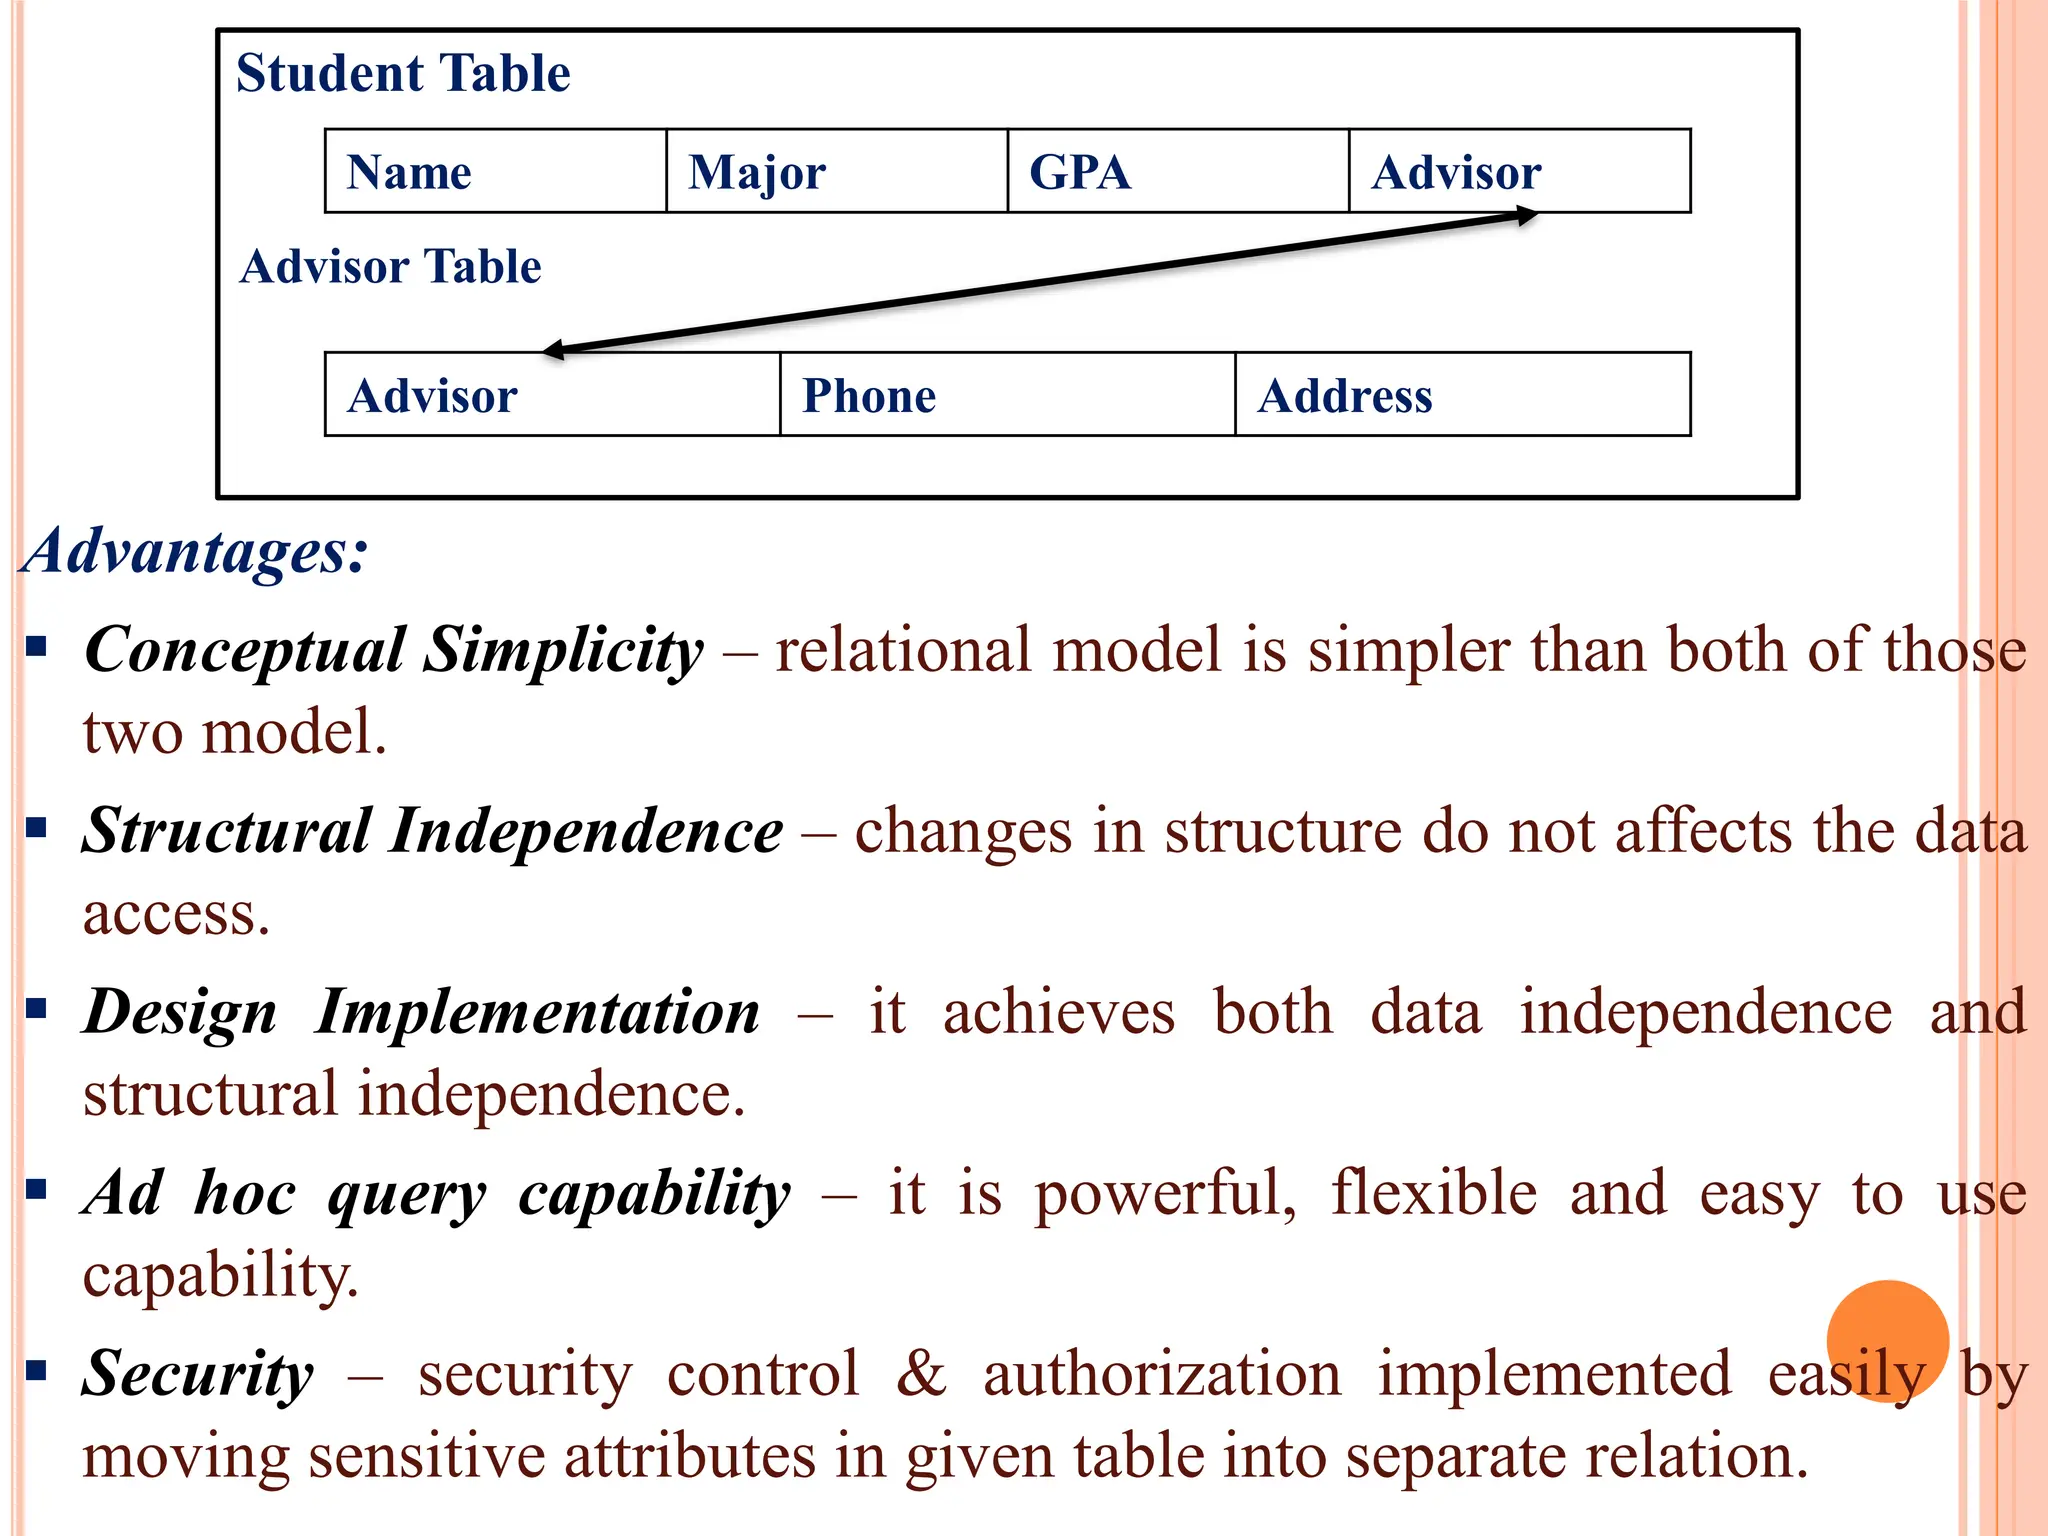
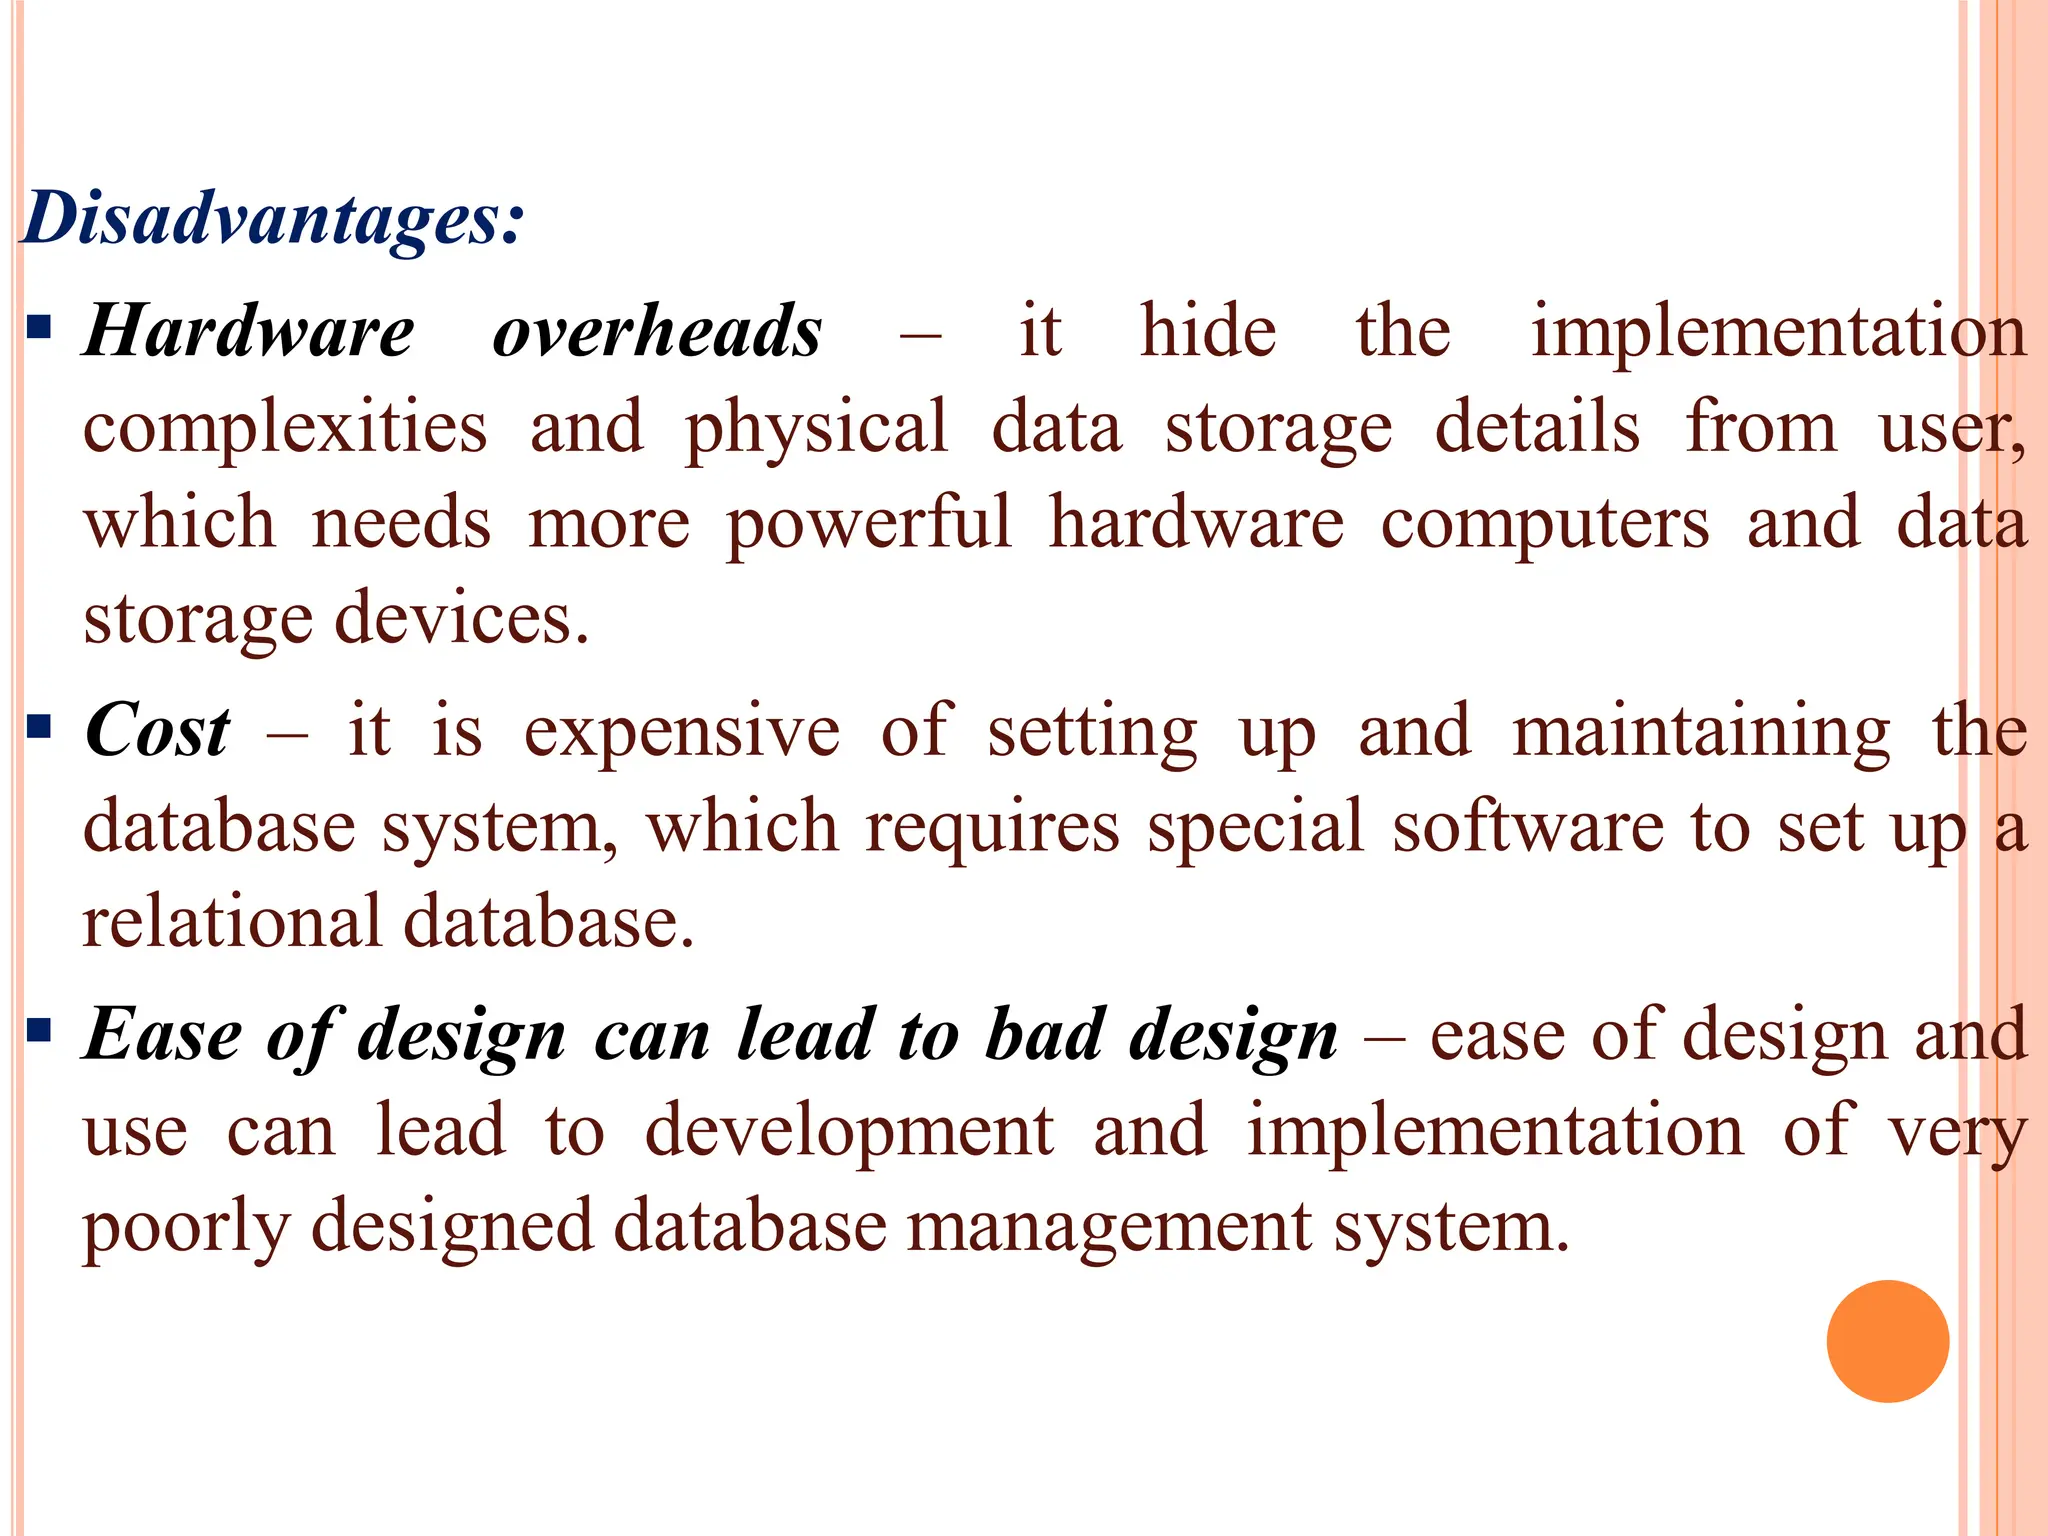
Introduction to the relational model, its structure of rows and columns, and advantages like simplicity, independence, and ad hoc querying.
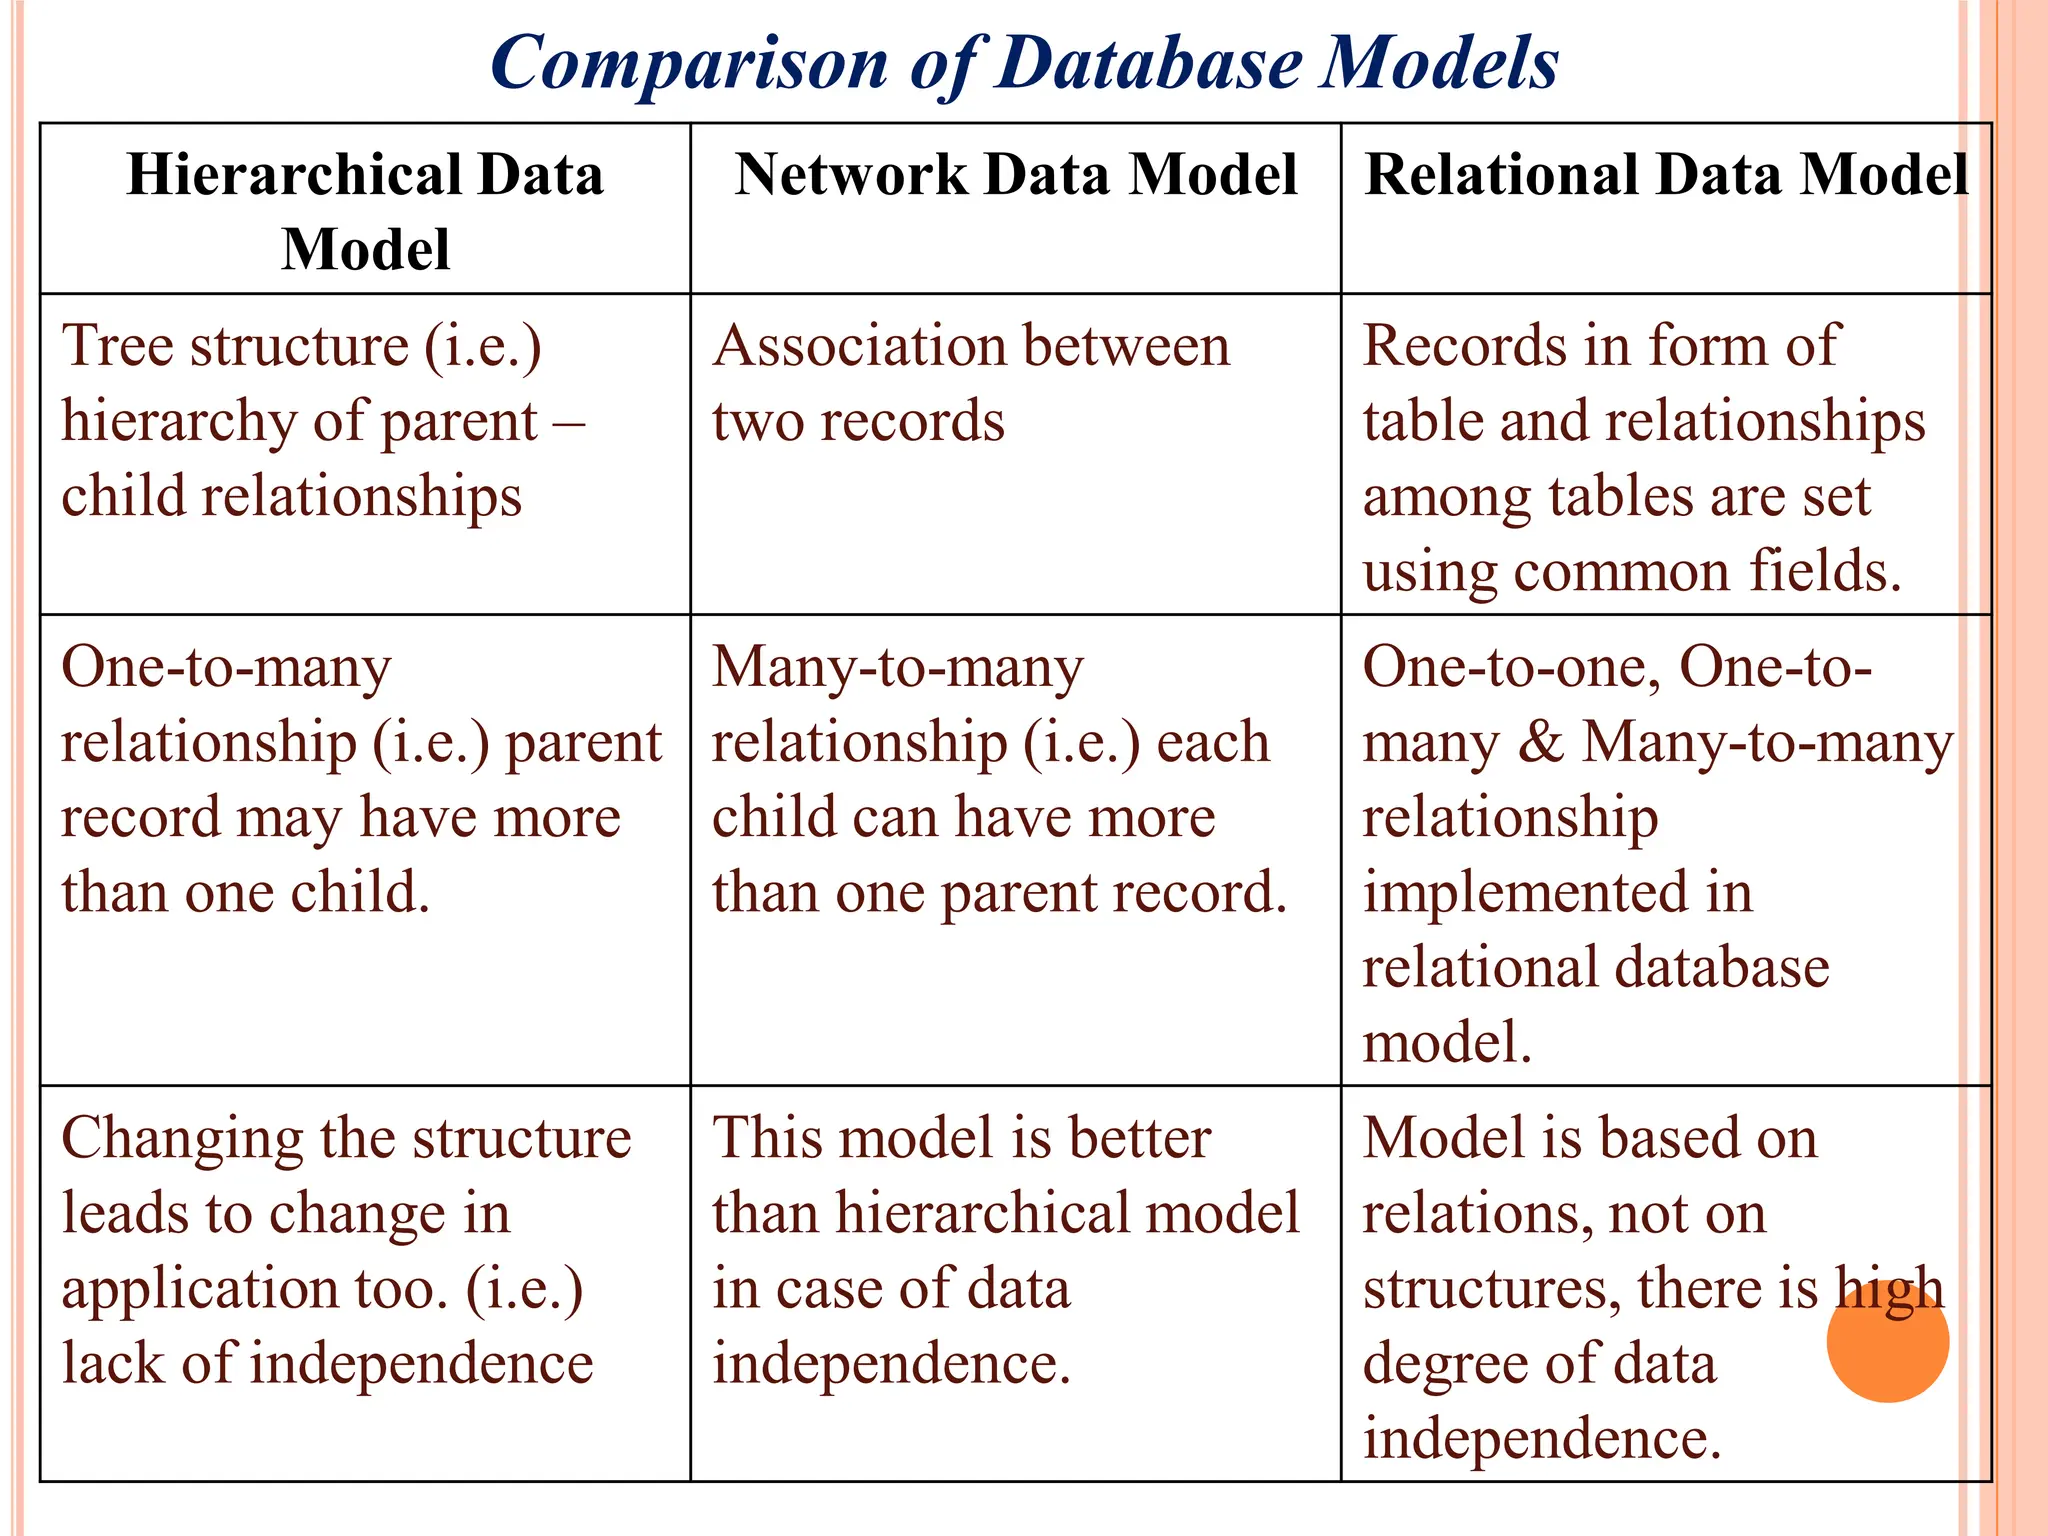
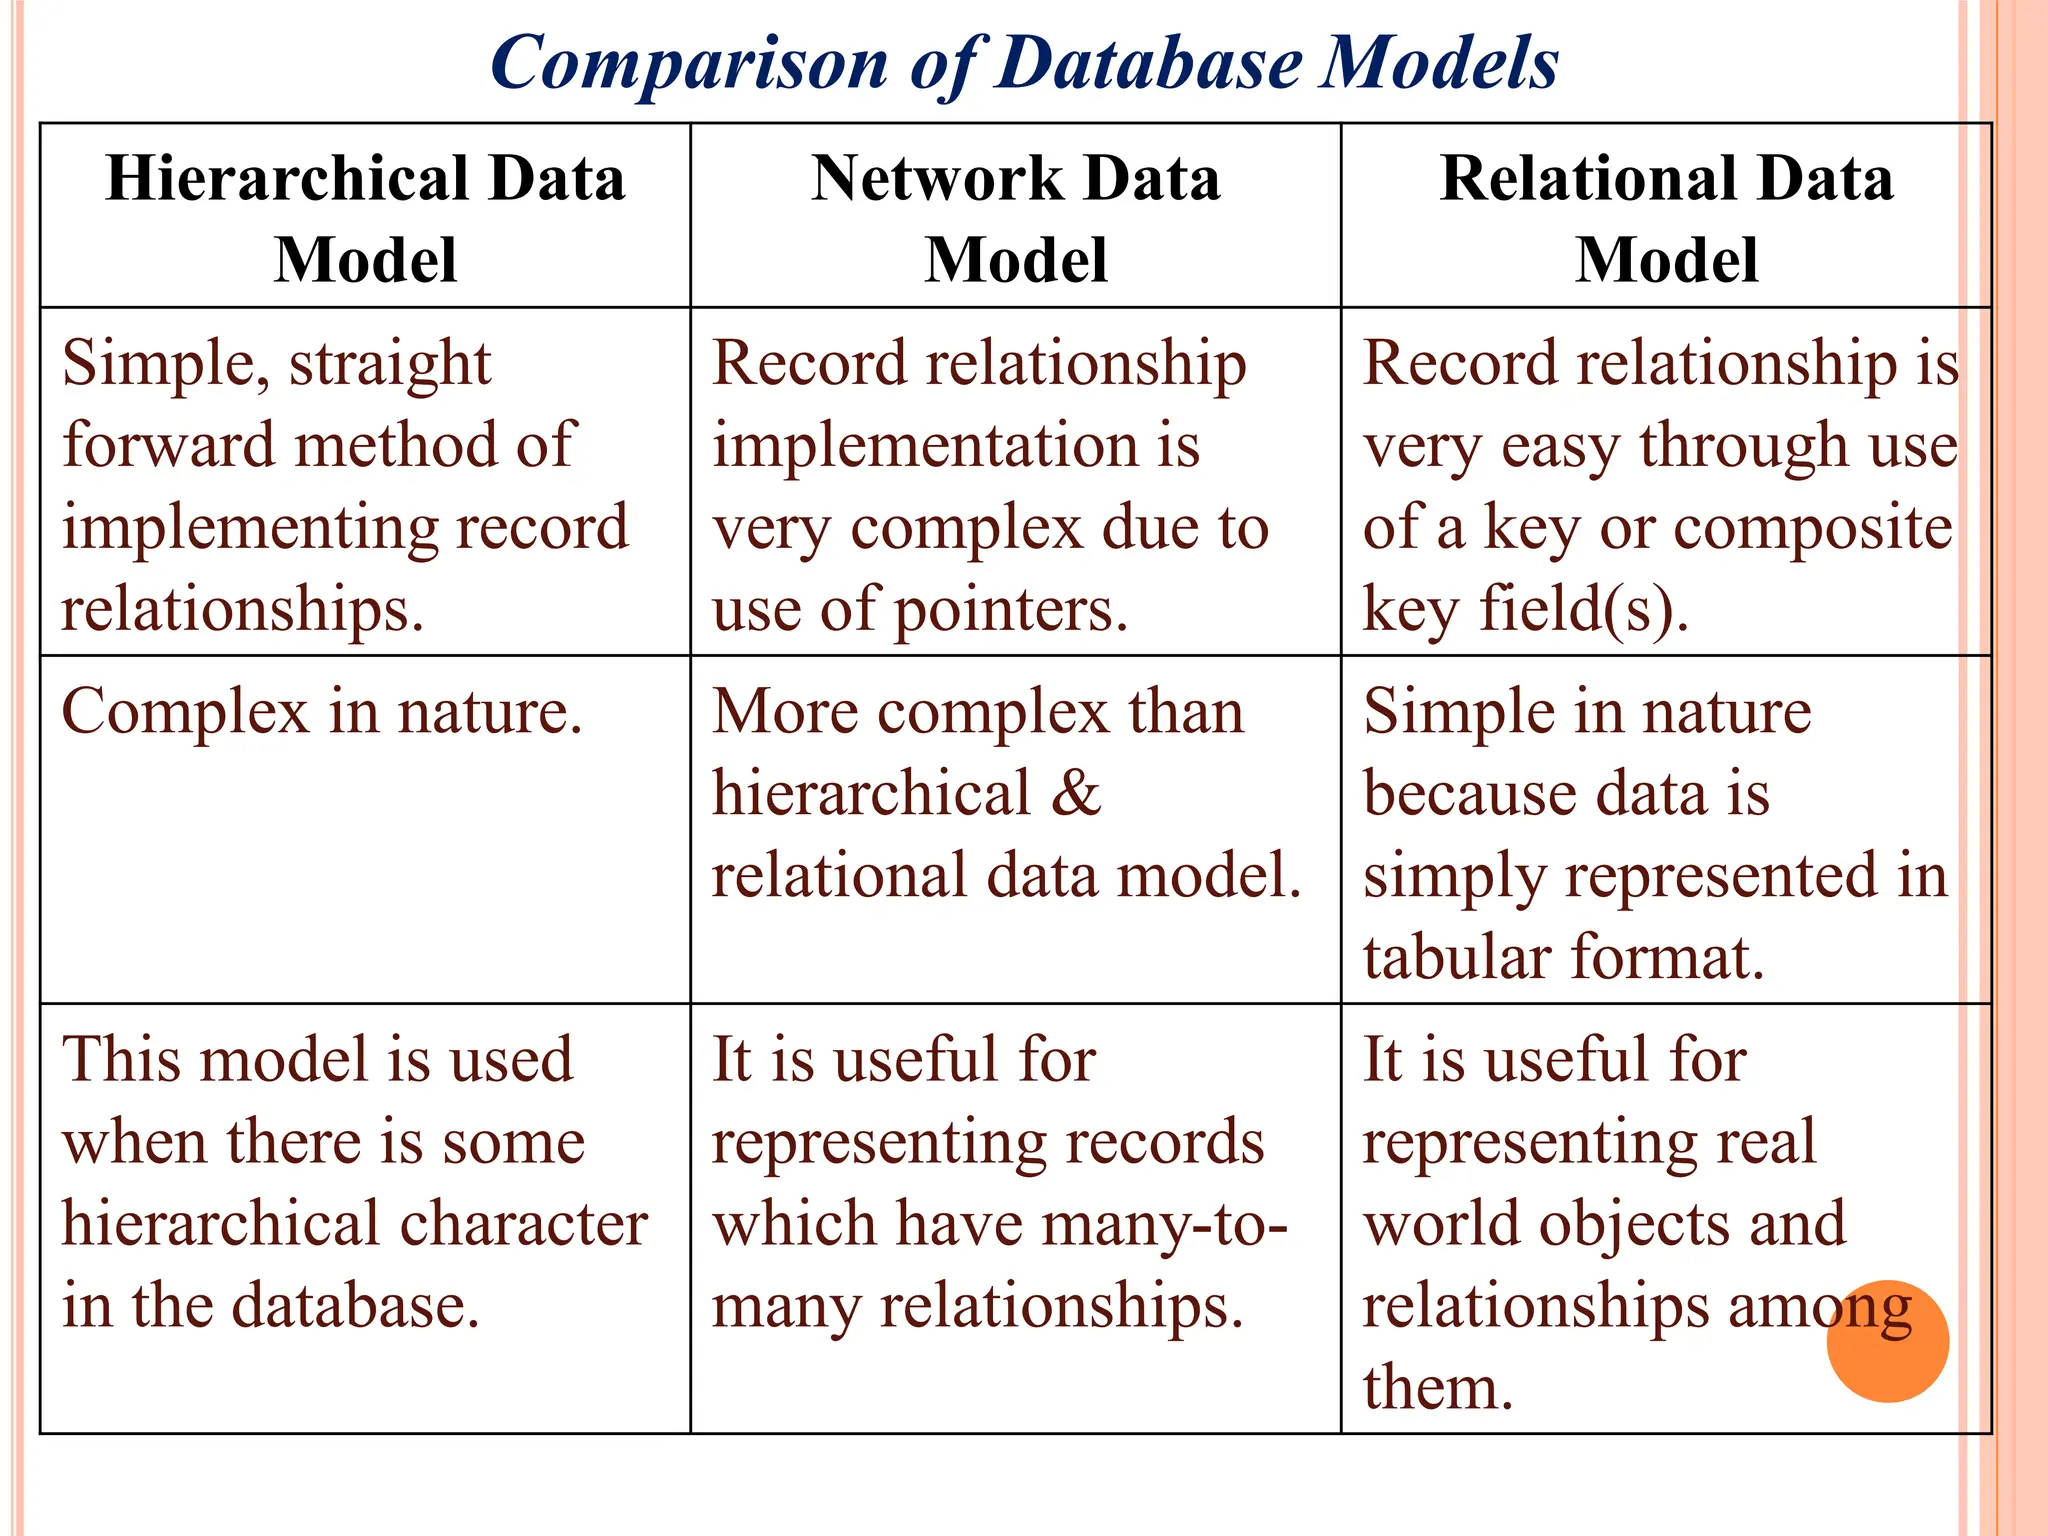
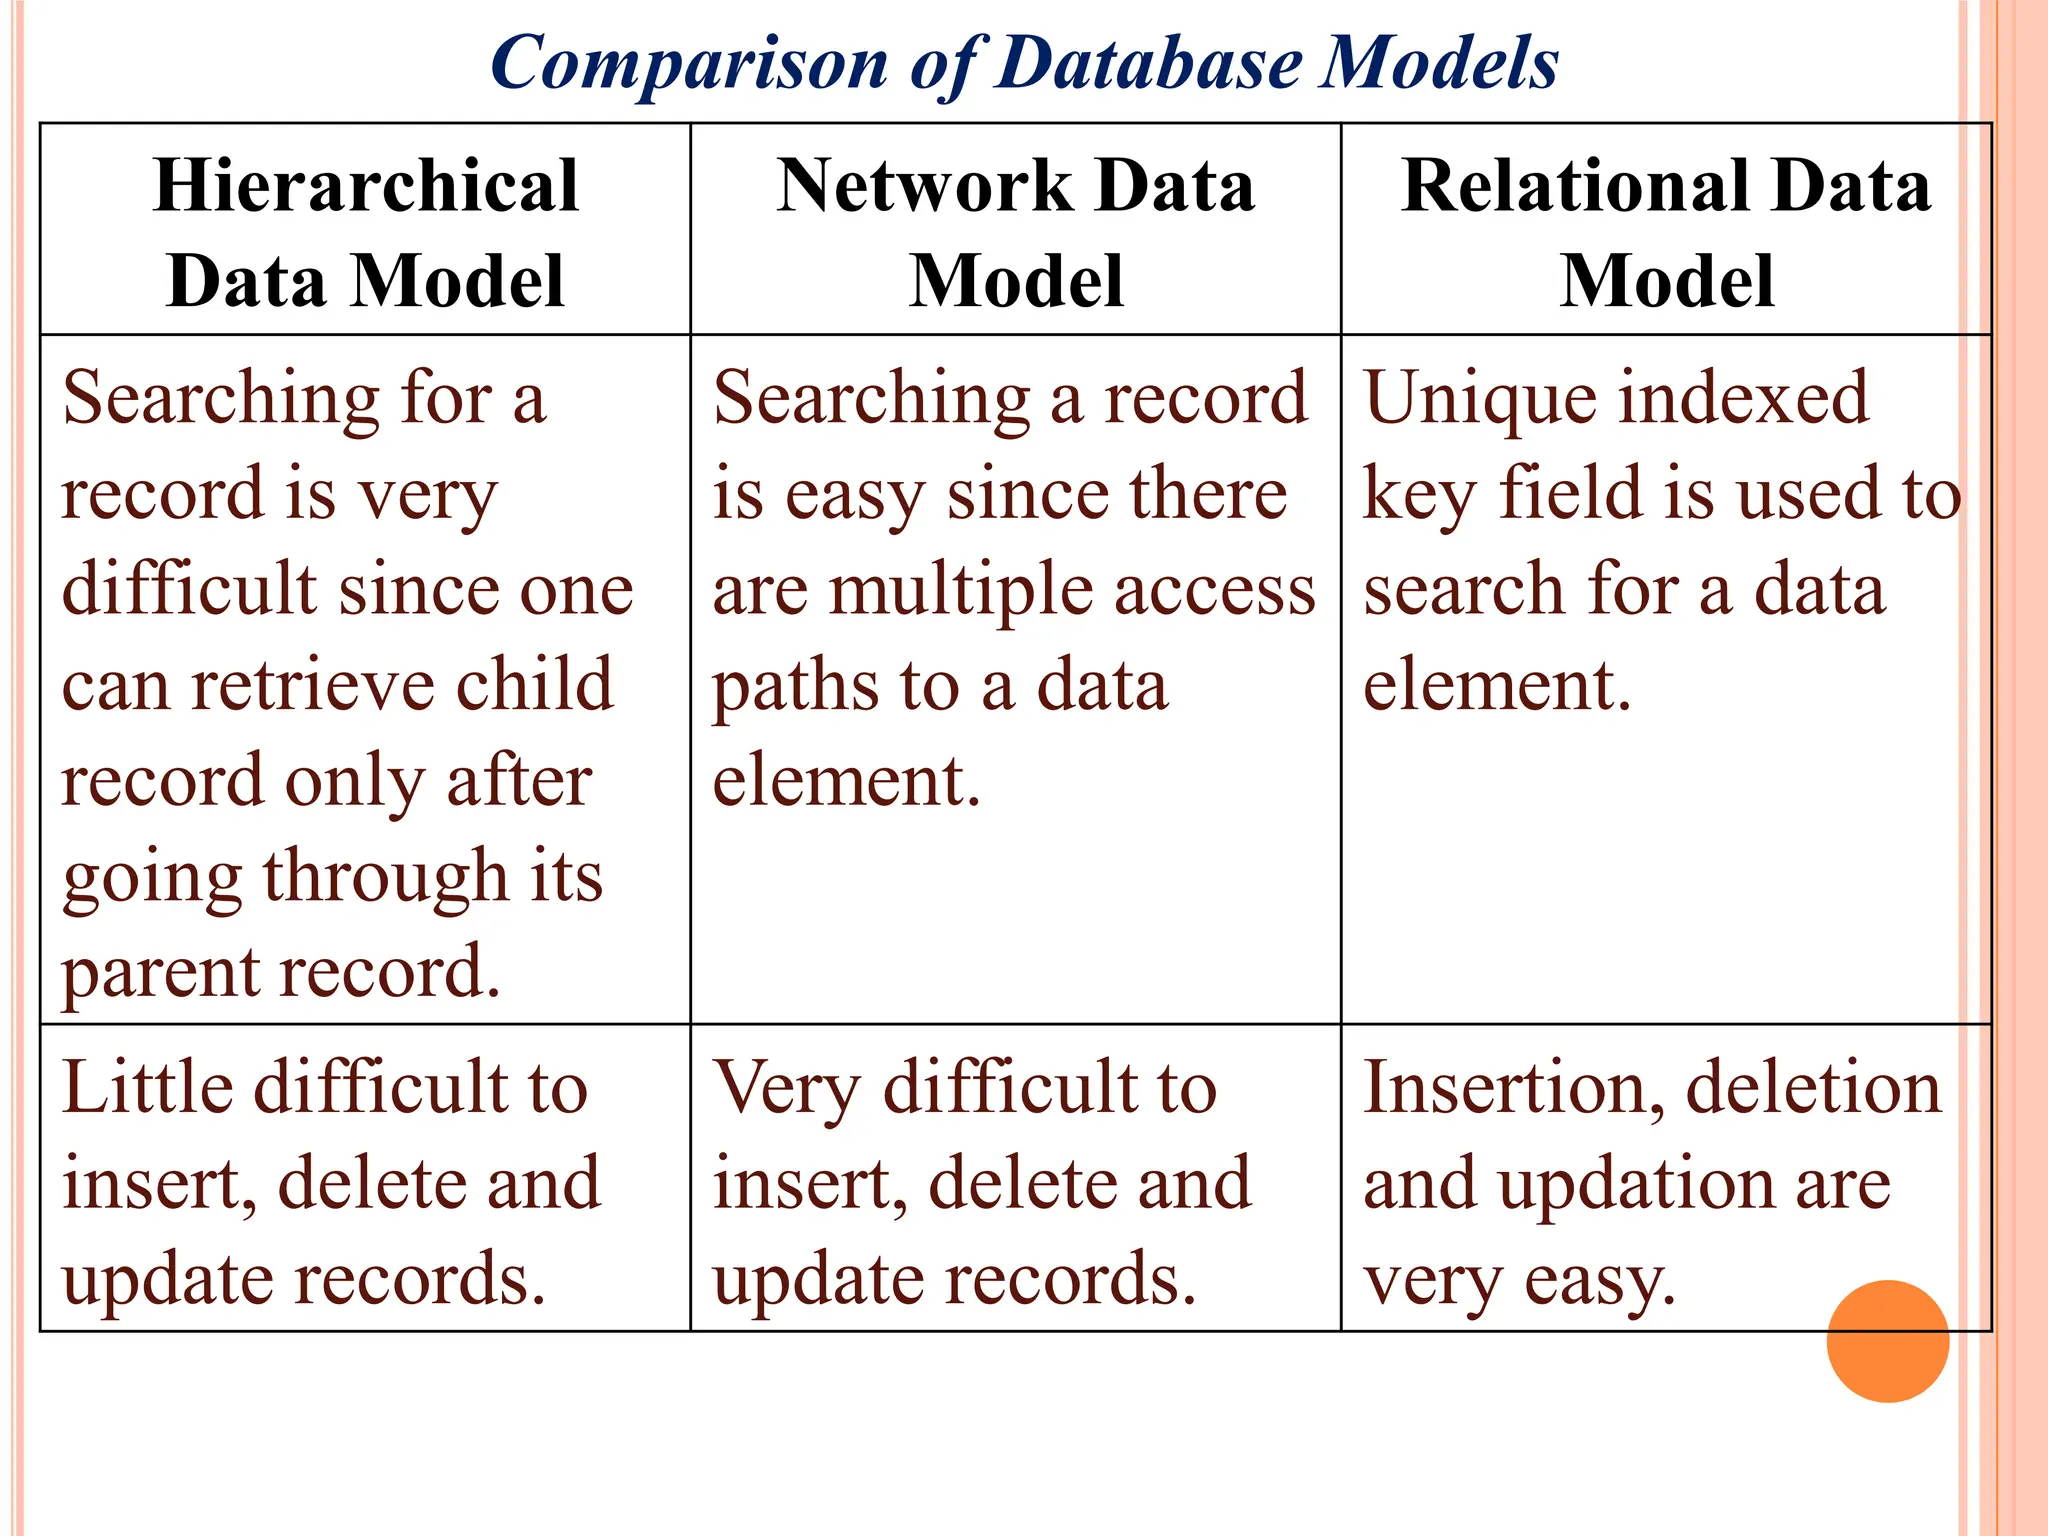
Comparison of hierarchical, network, and relational database models focusing on structure, relationships, ease of use, and challenges.
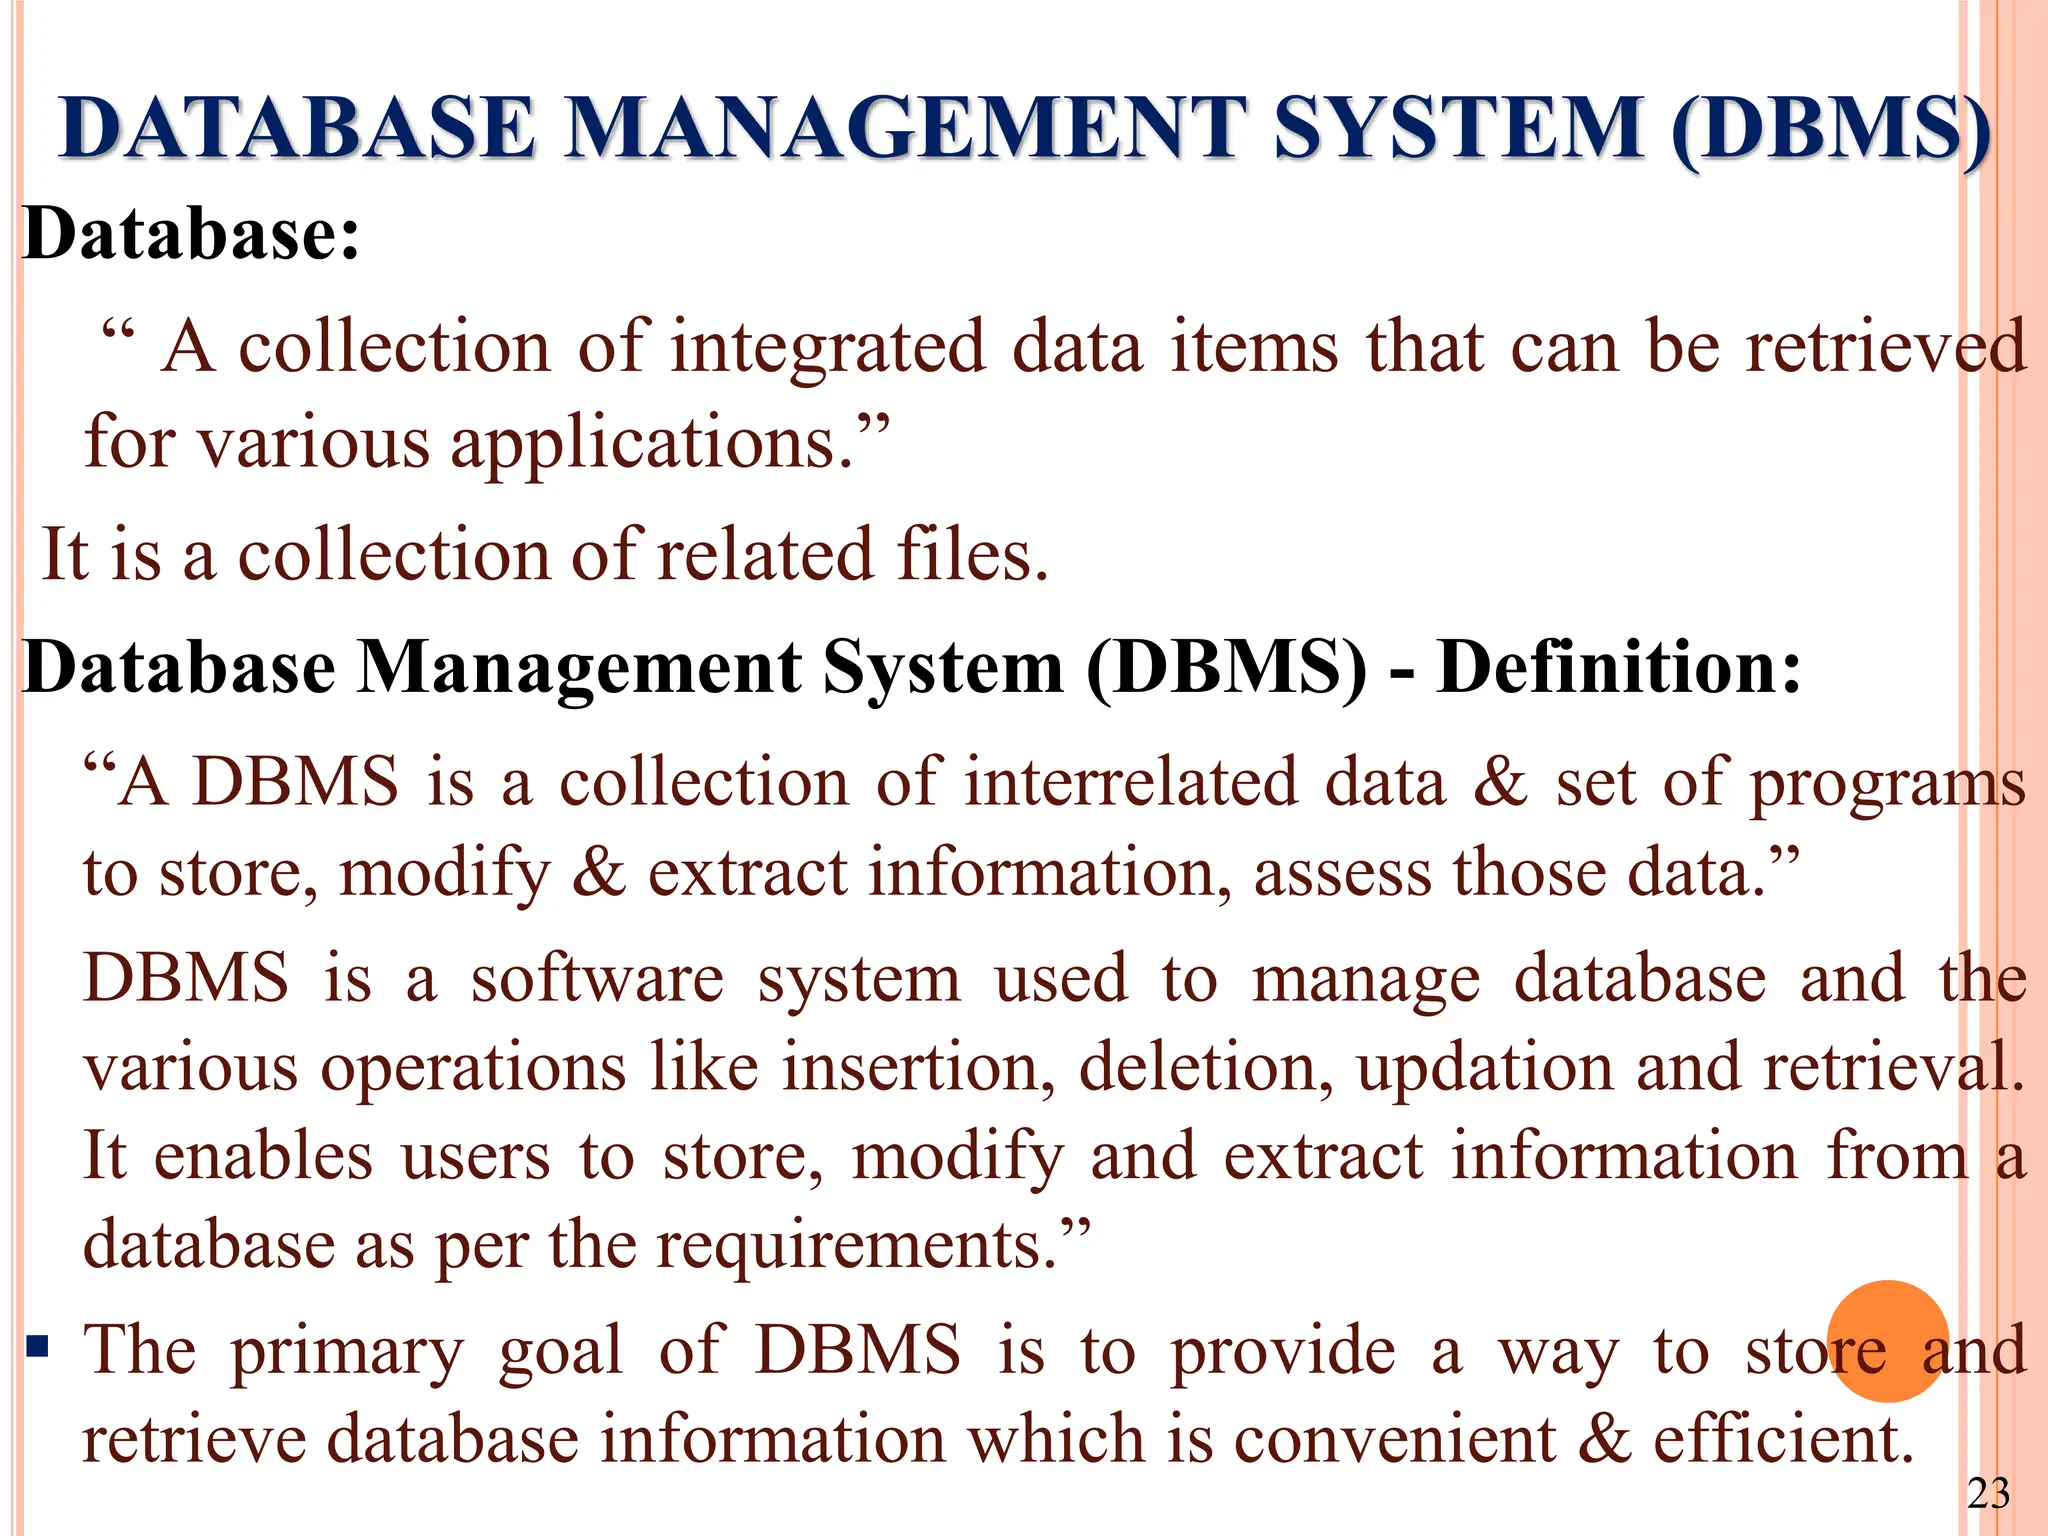
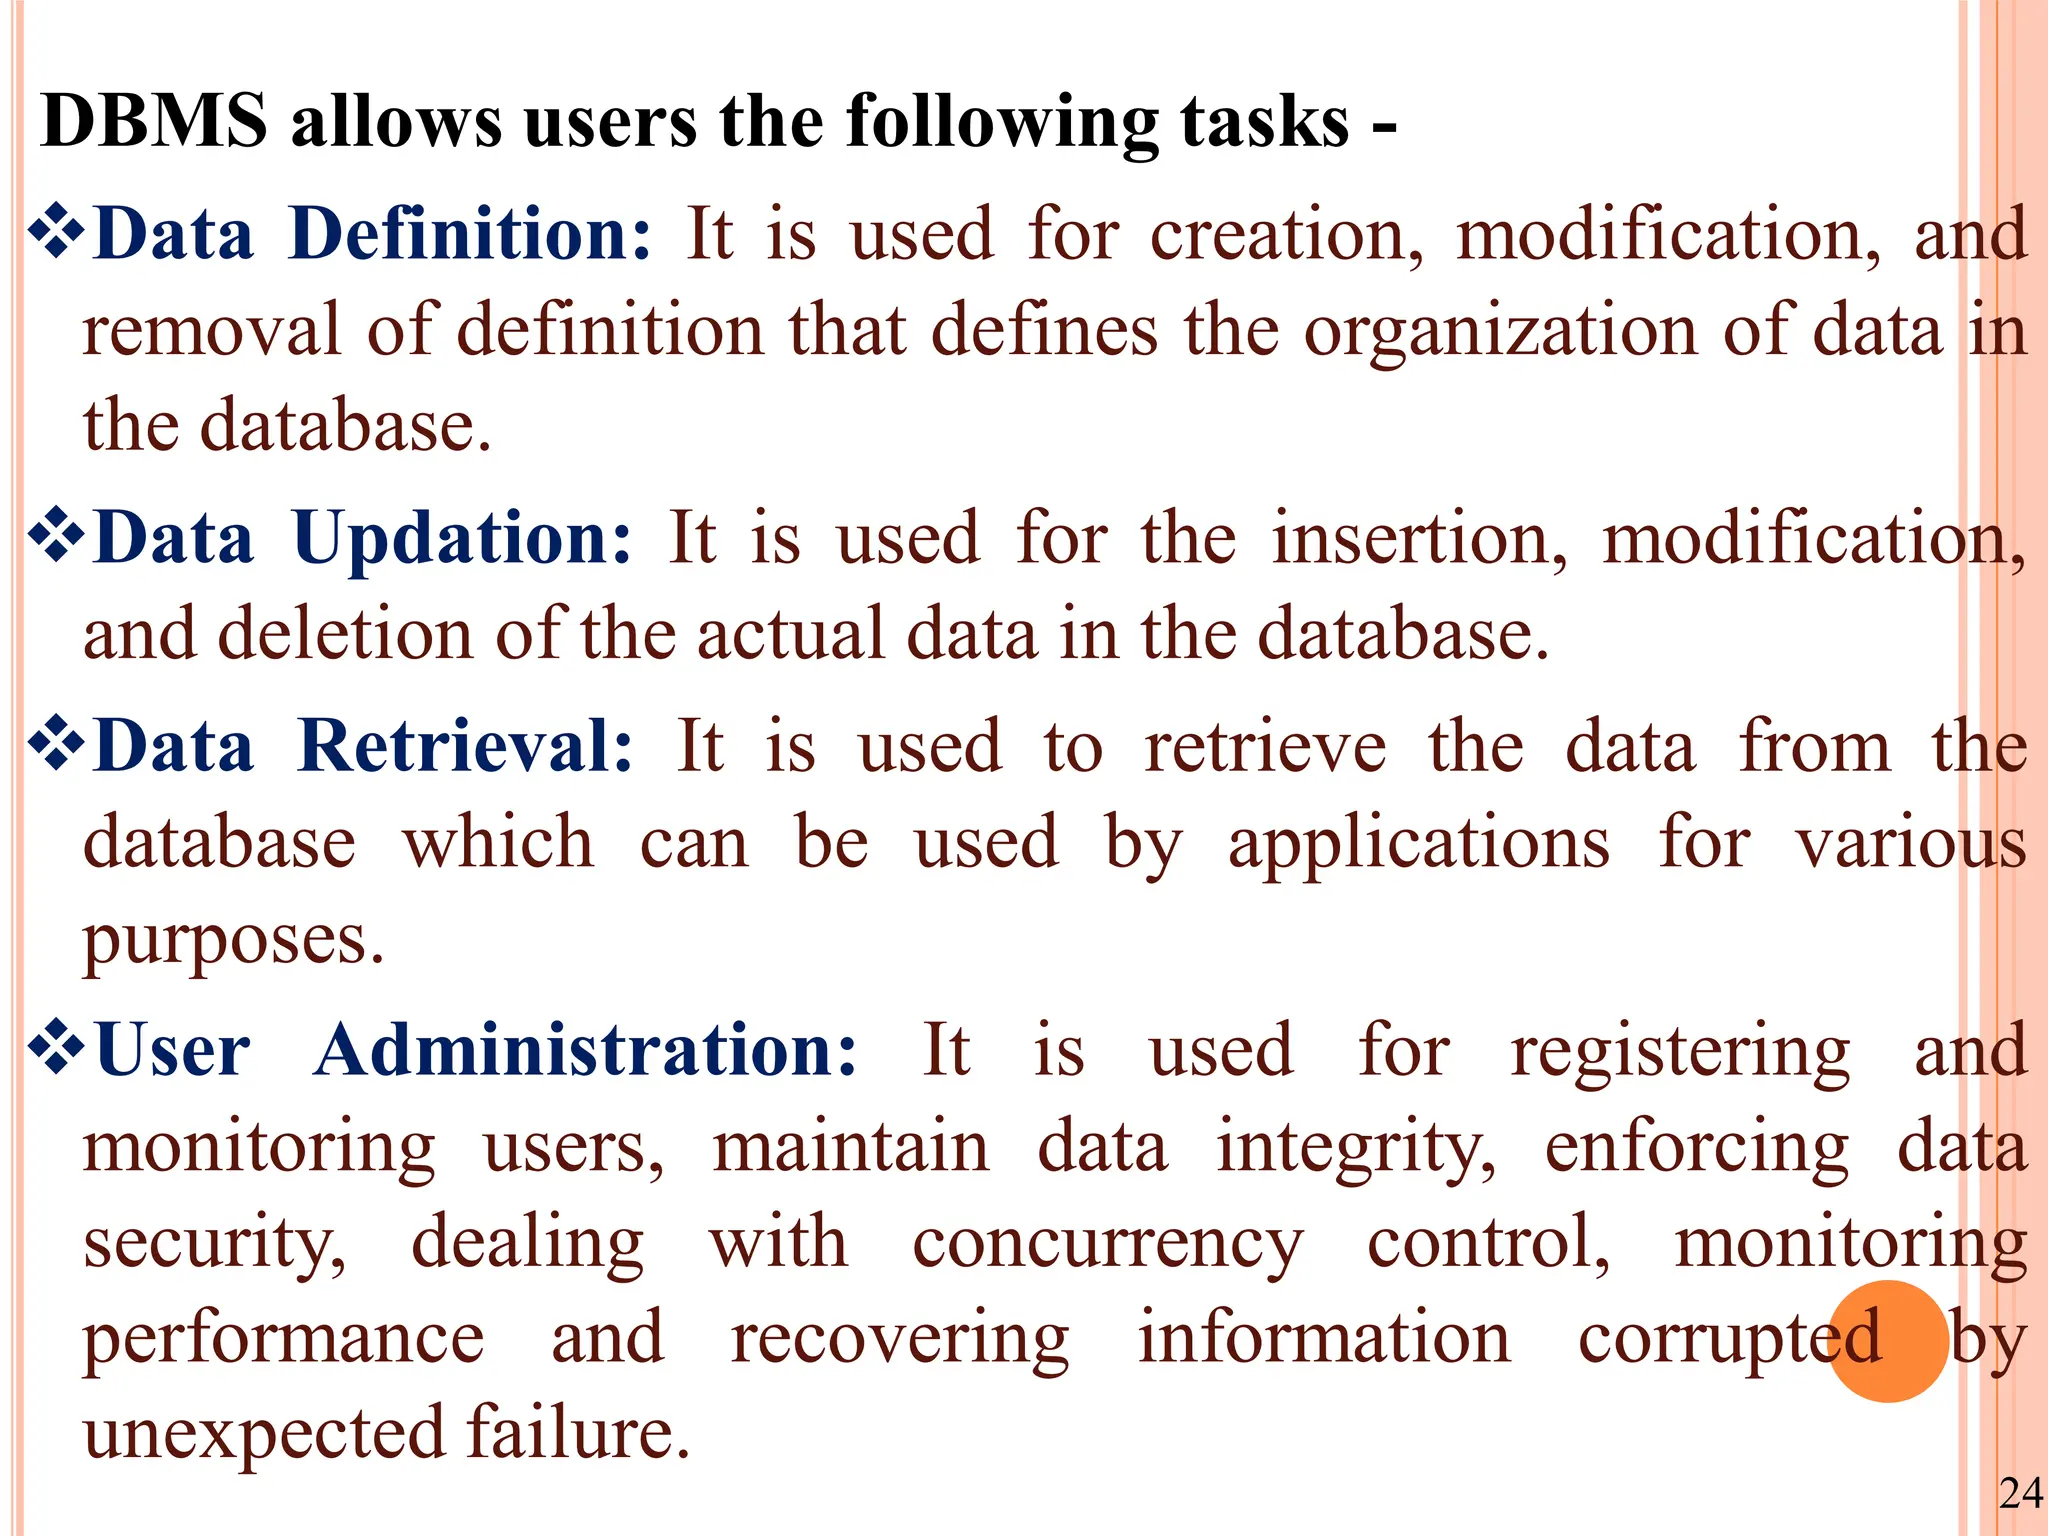
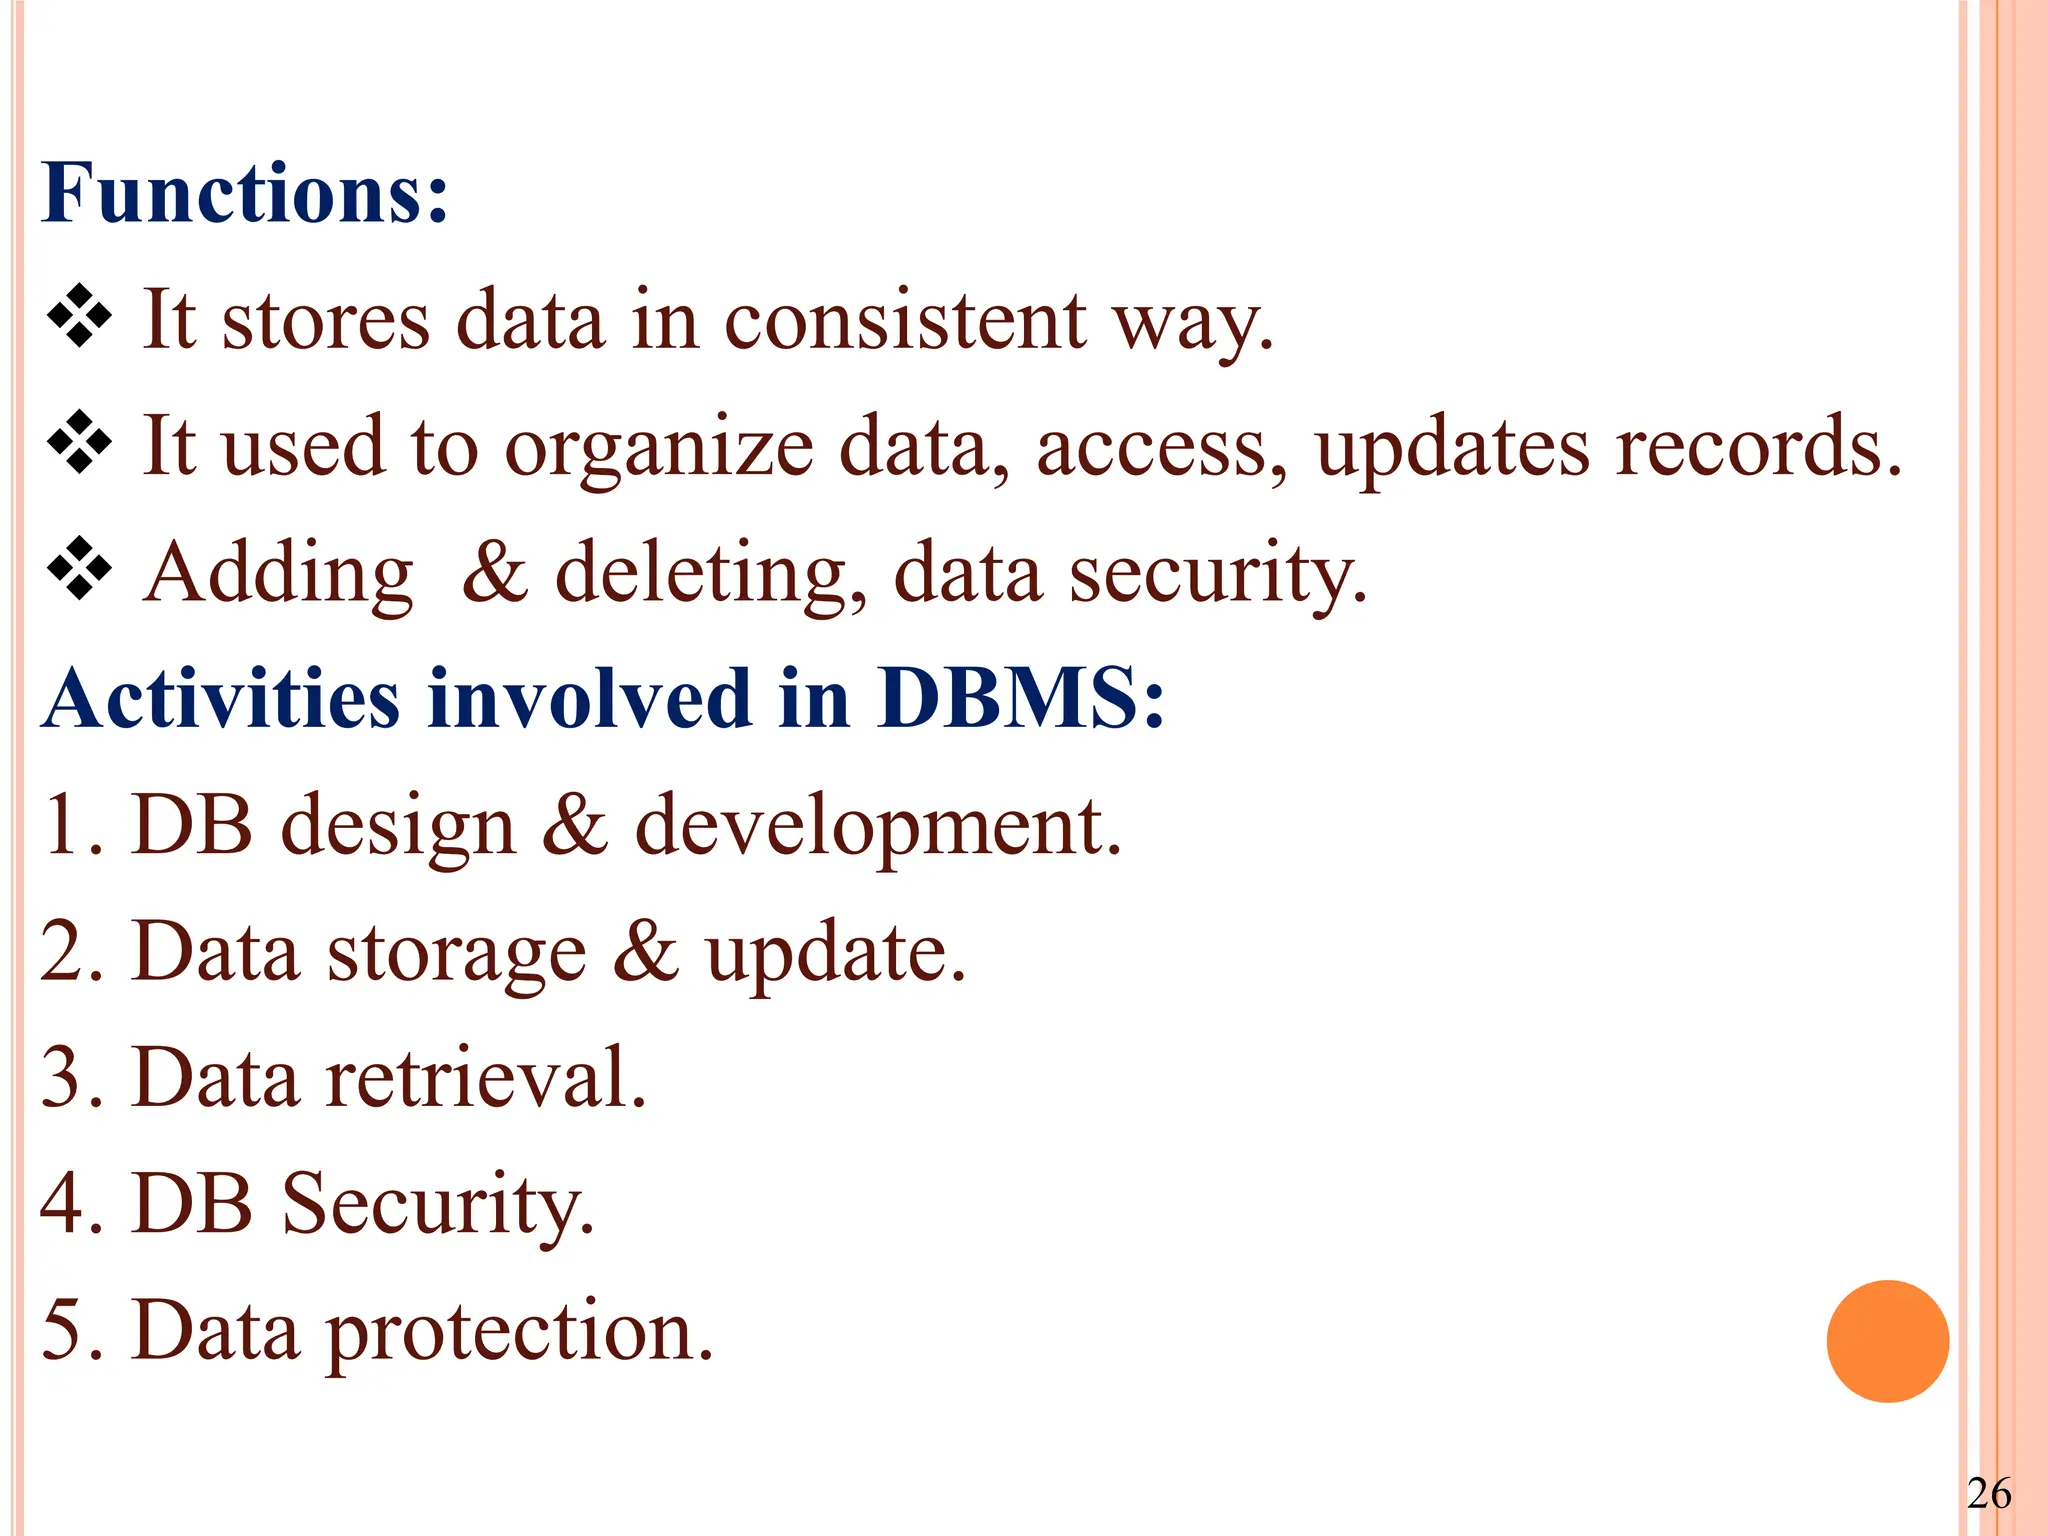
Definition and functions of DBMS including data definition, retrieval, updating, and user administration for efficient data management.
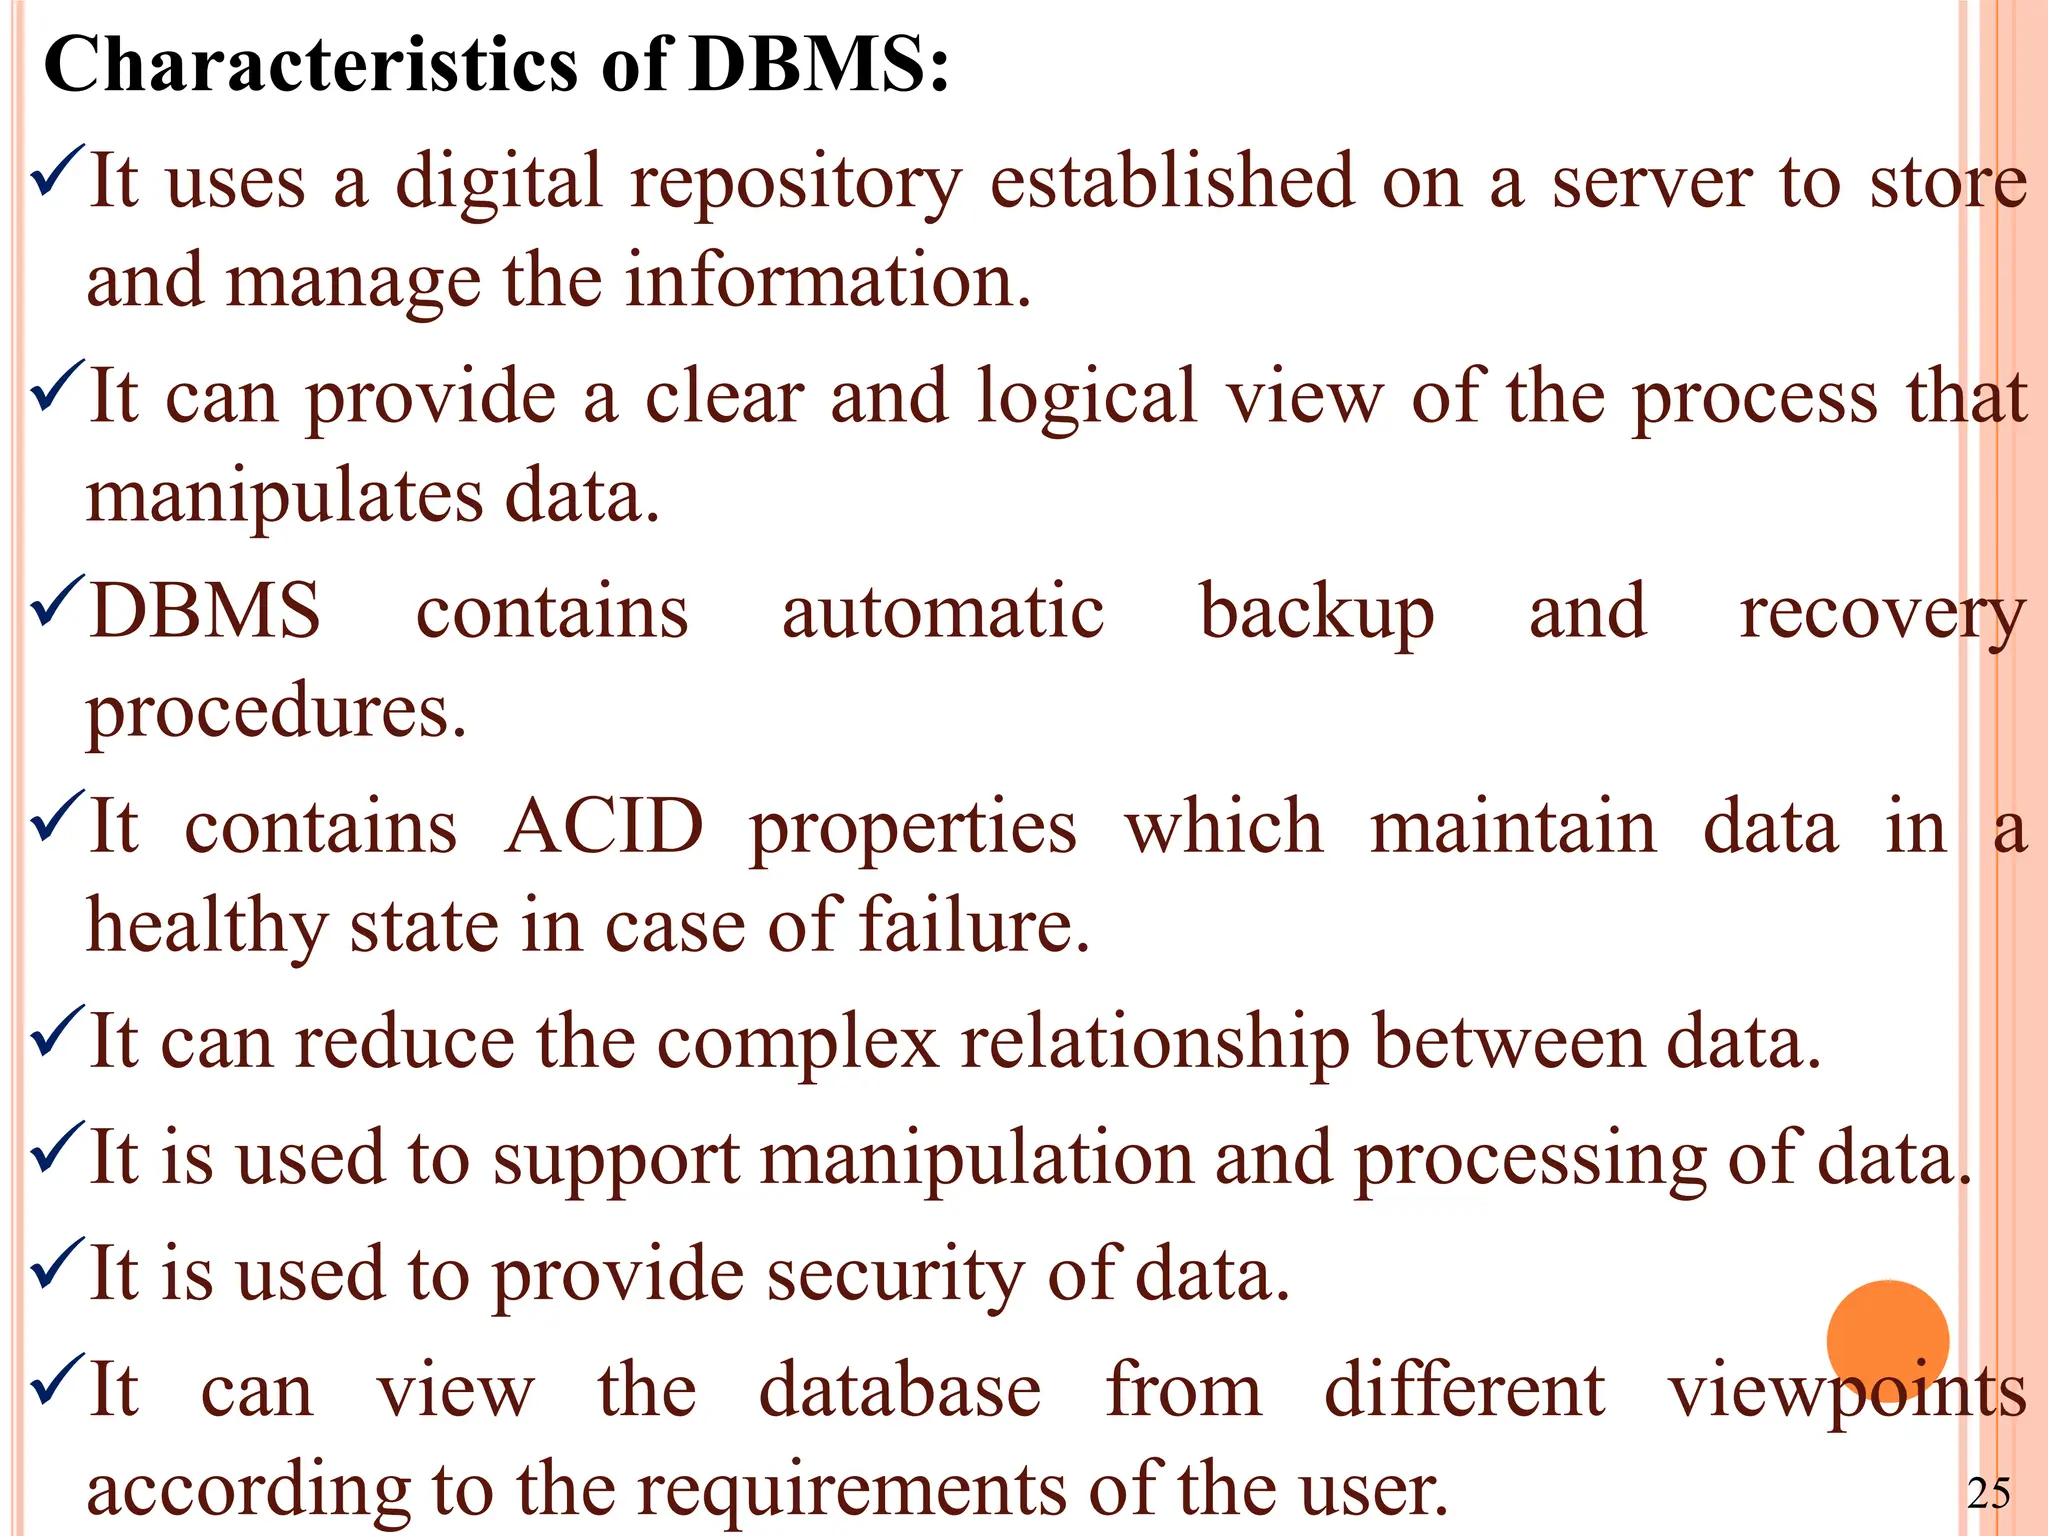
Key features of DBMS such as data organization, access, security, and backup capabilities supporting complex data relationships.
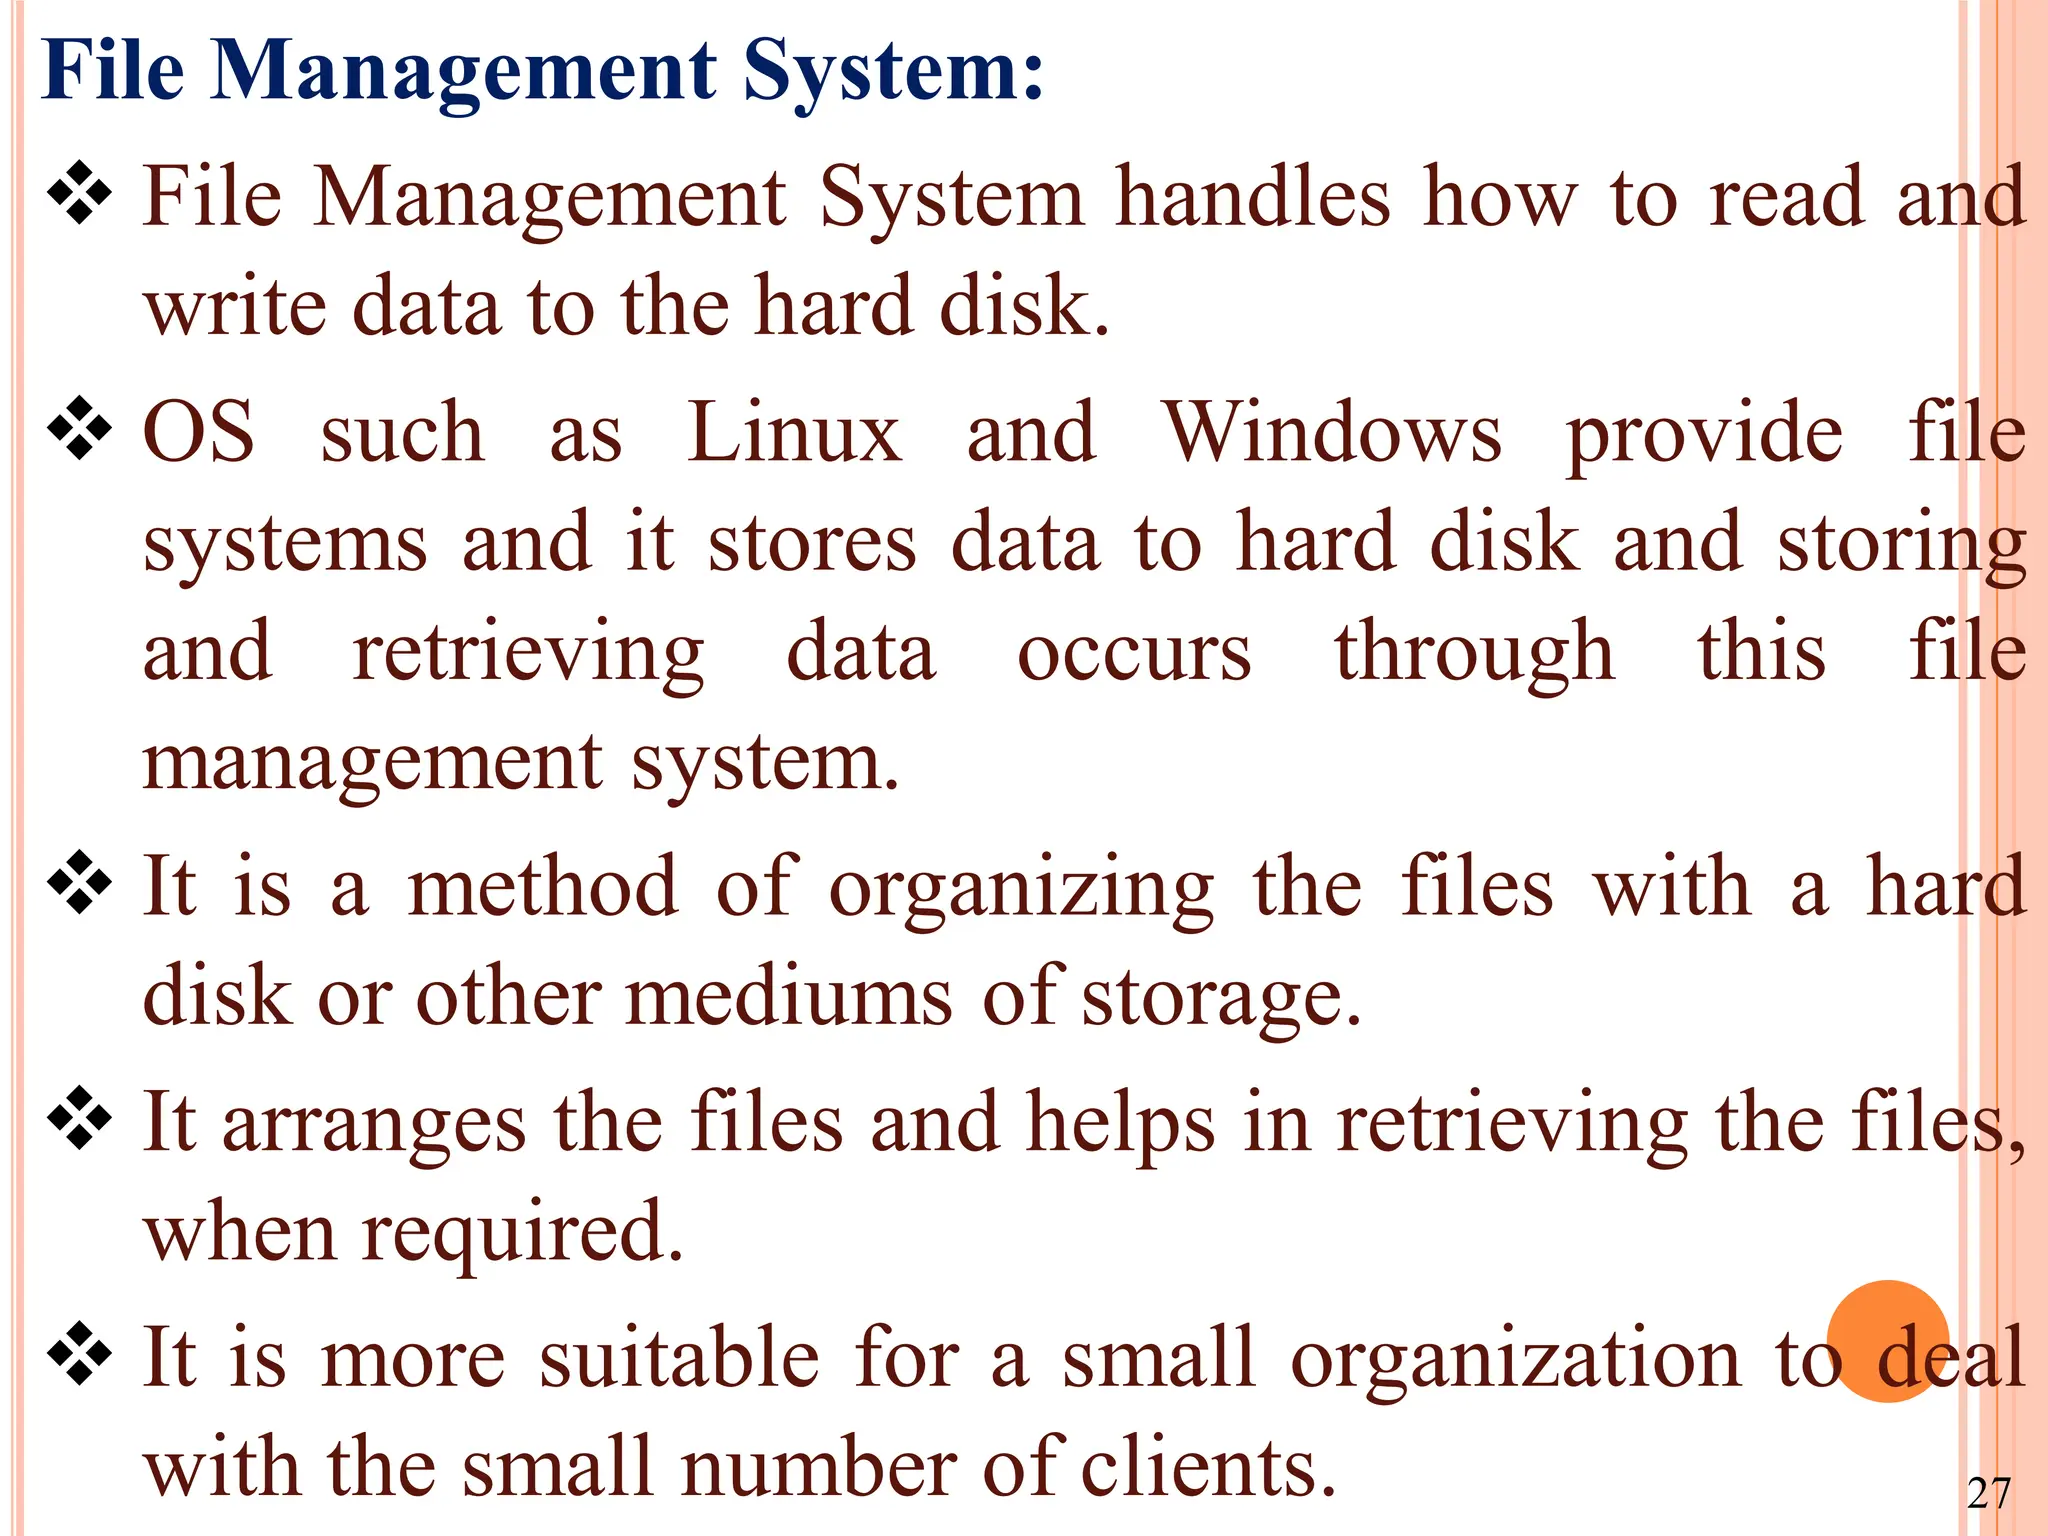
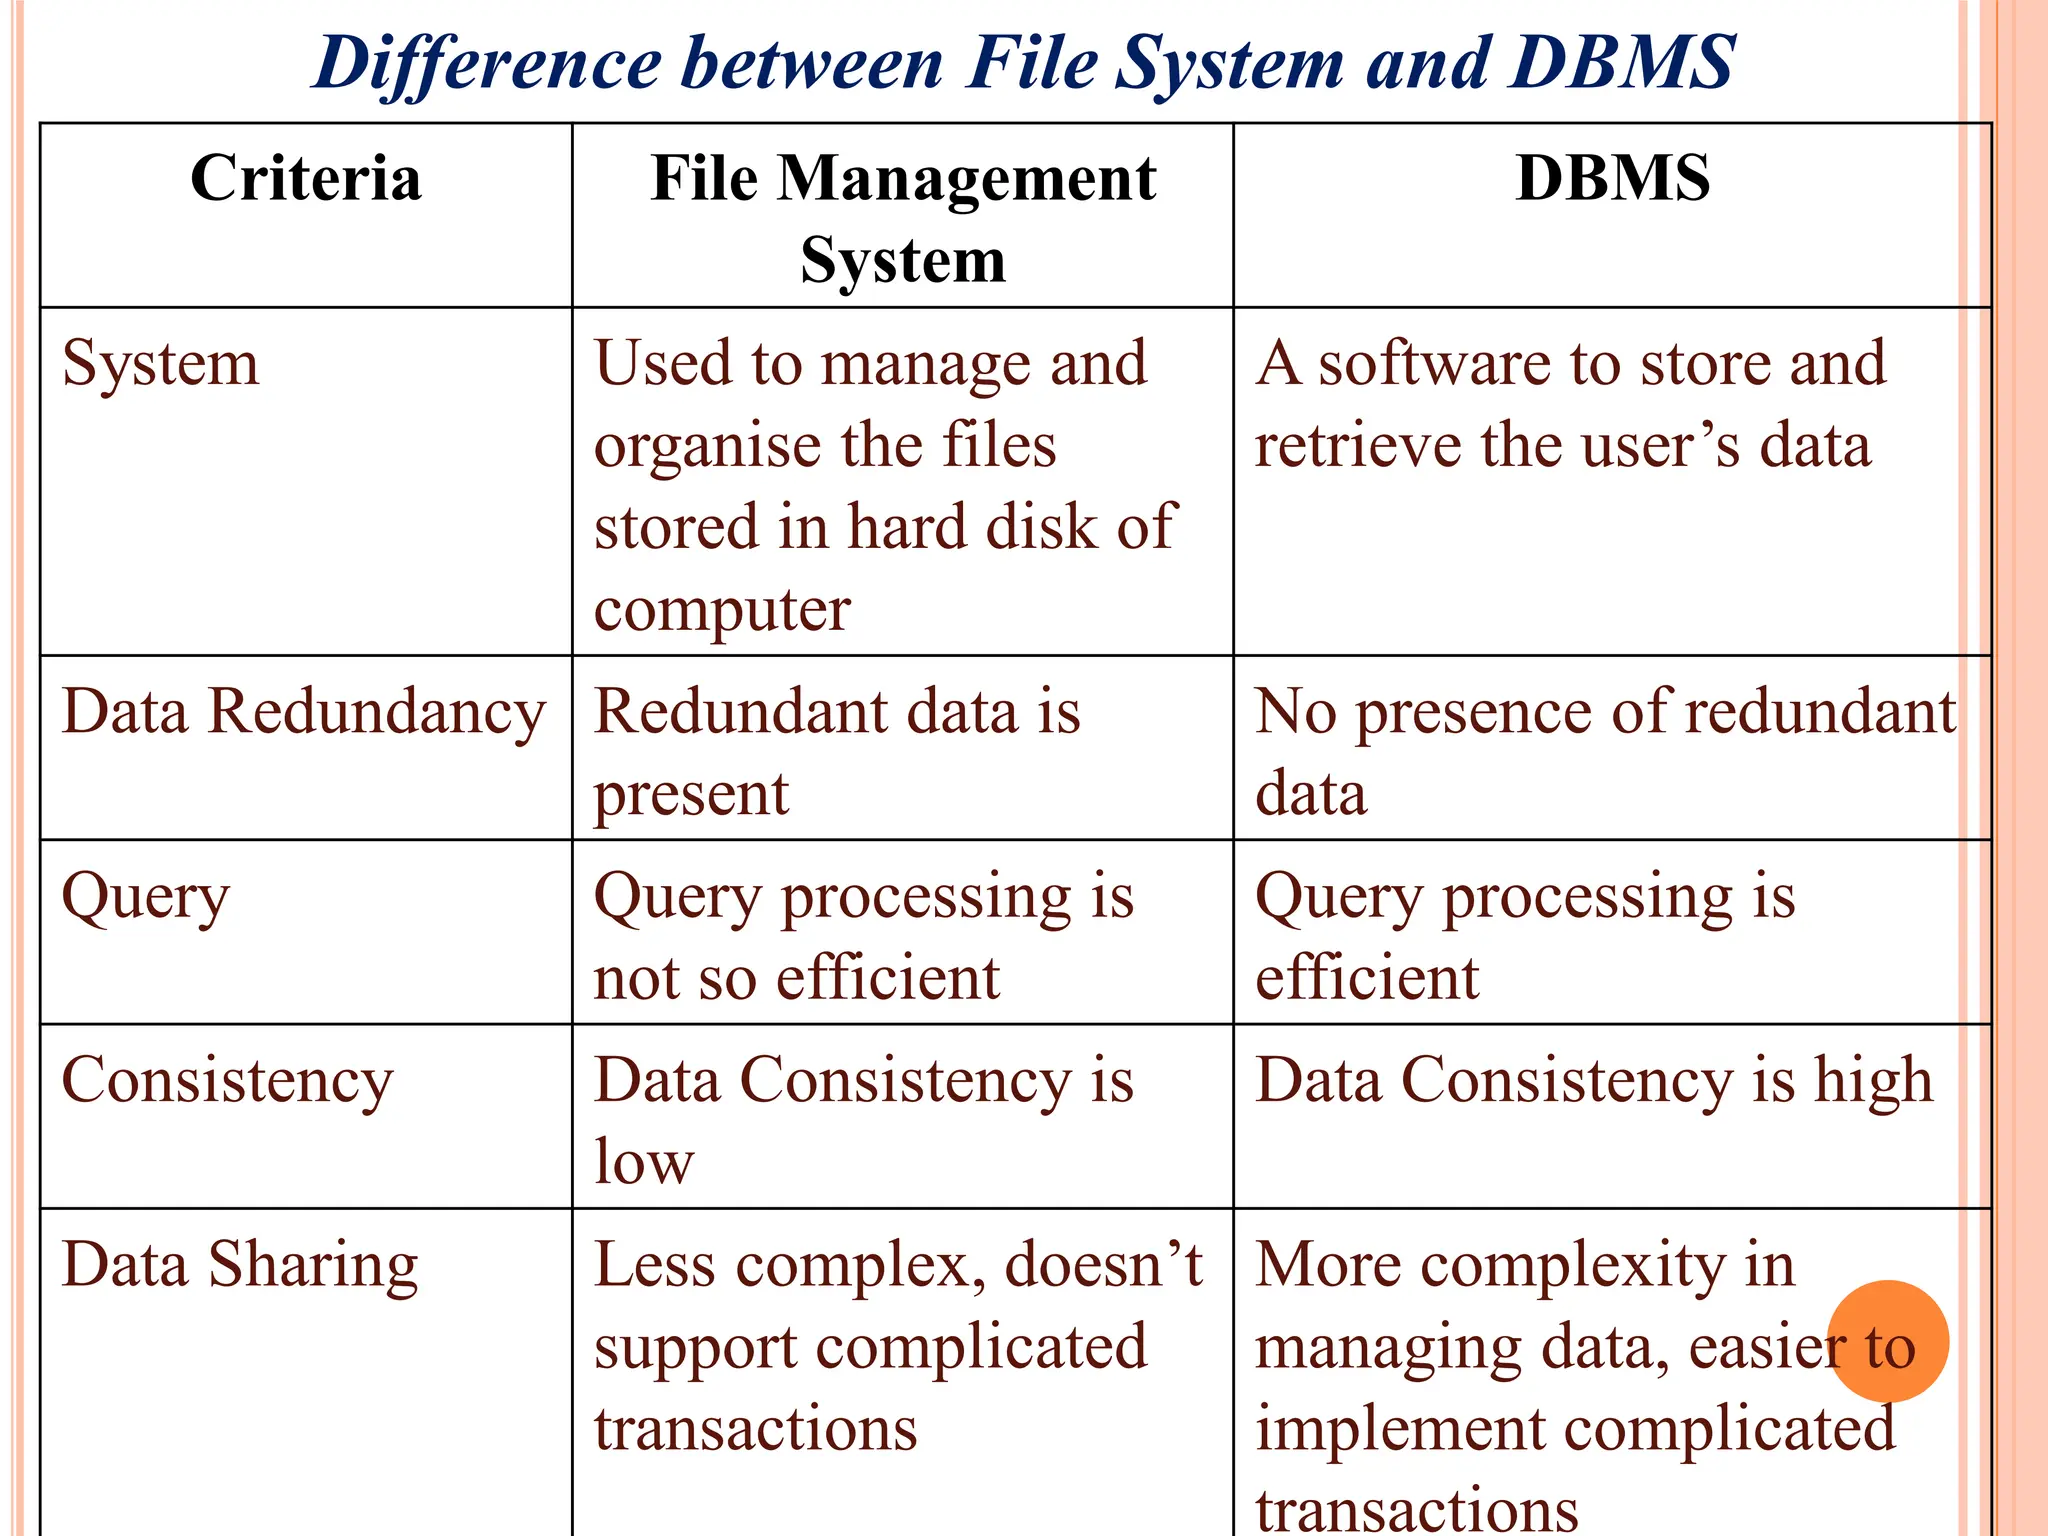
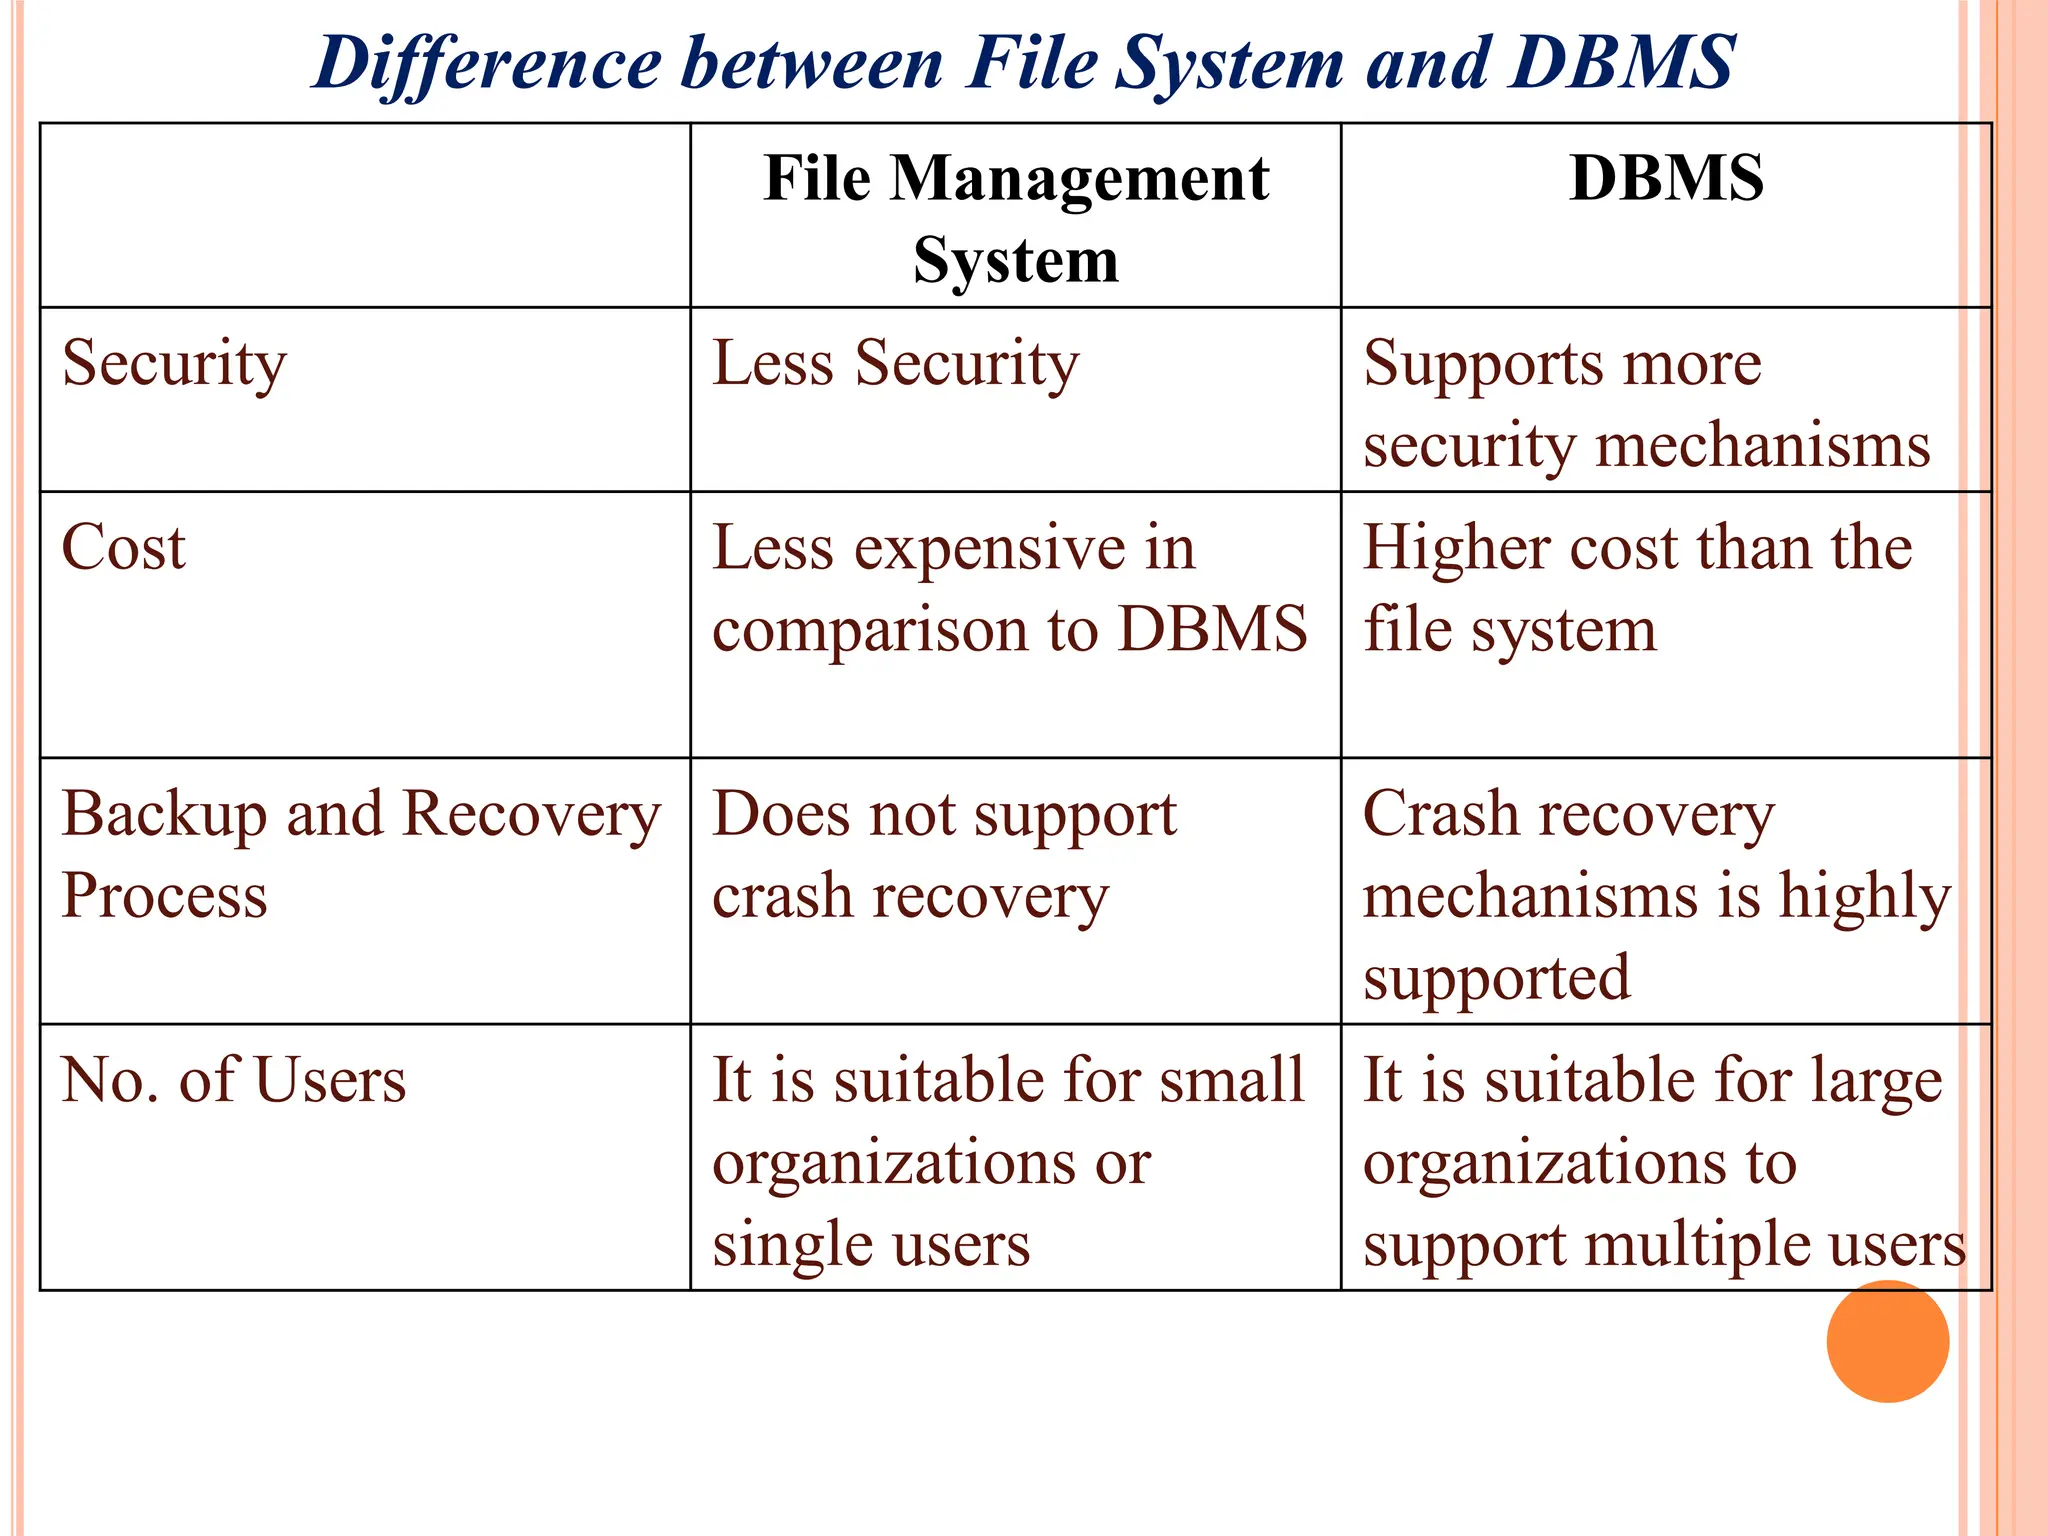
Comparison of File Management Systems with DBMS in terms of efficiency, data redundancy, cost, and security solutions.
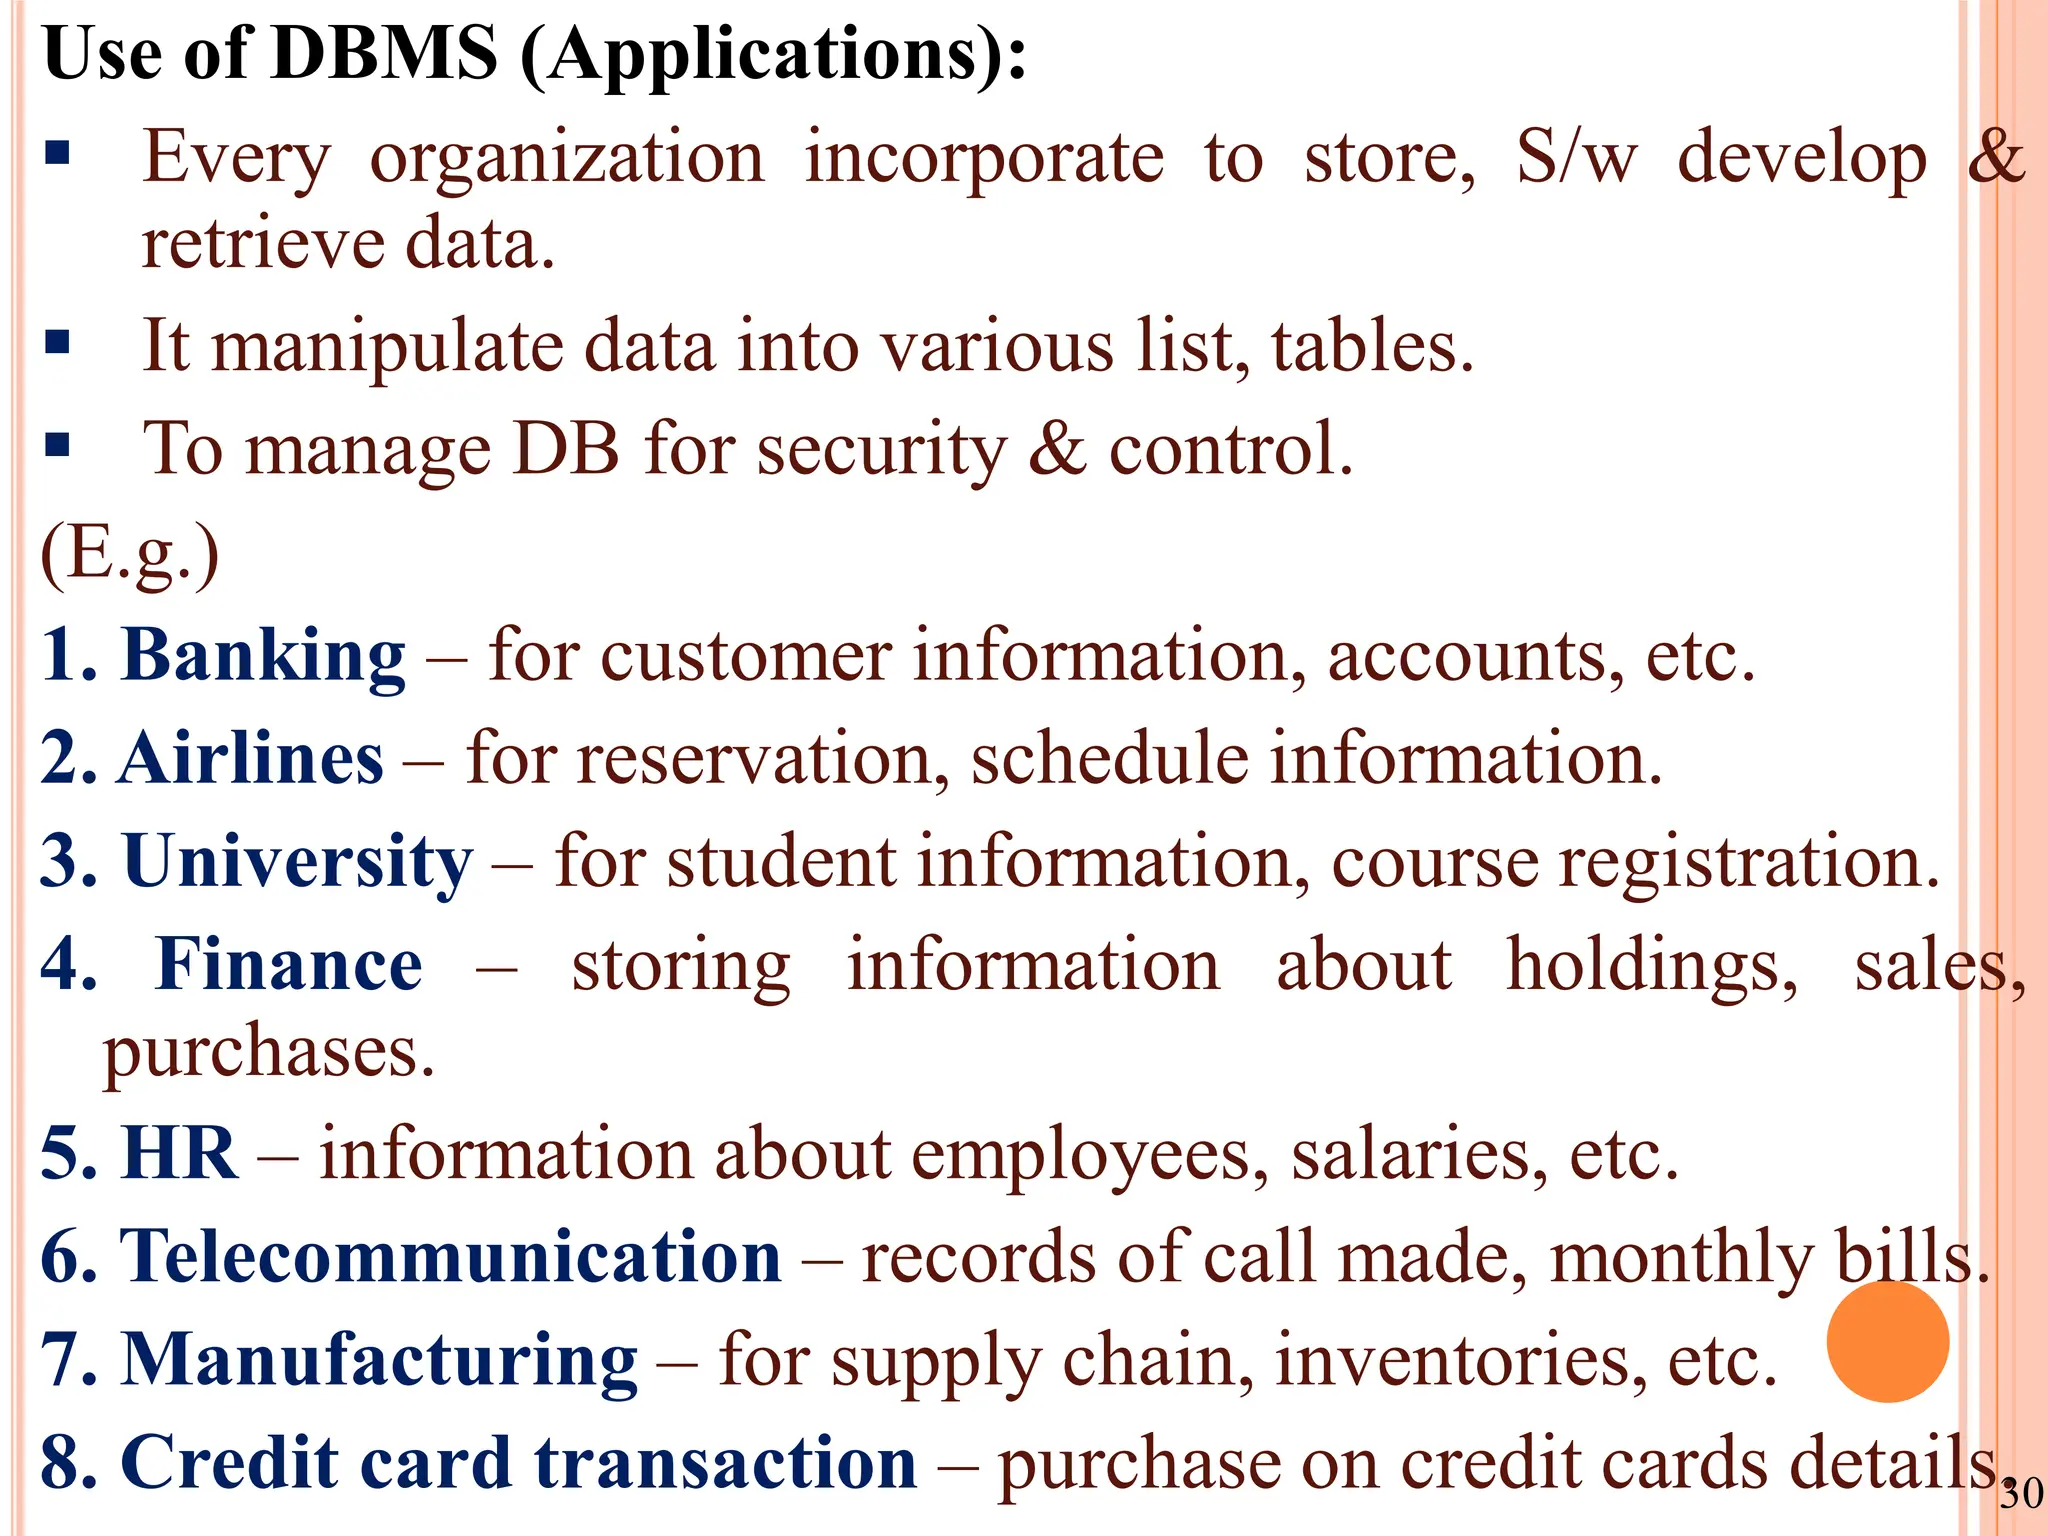
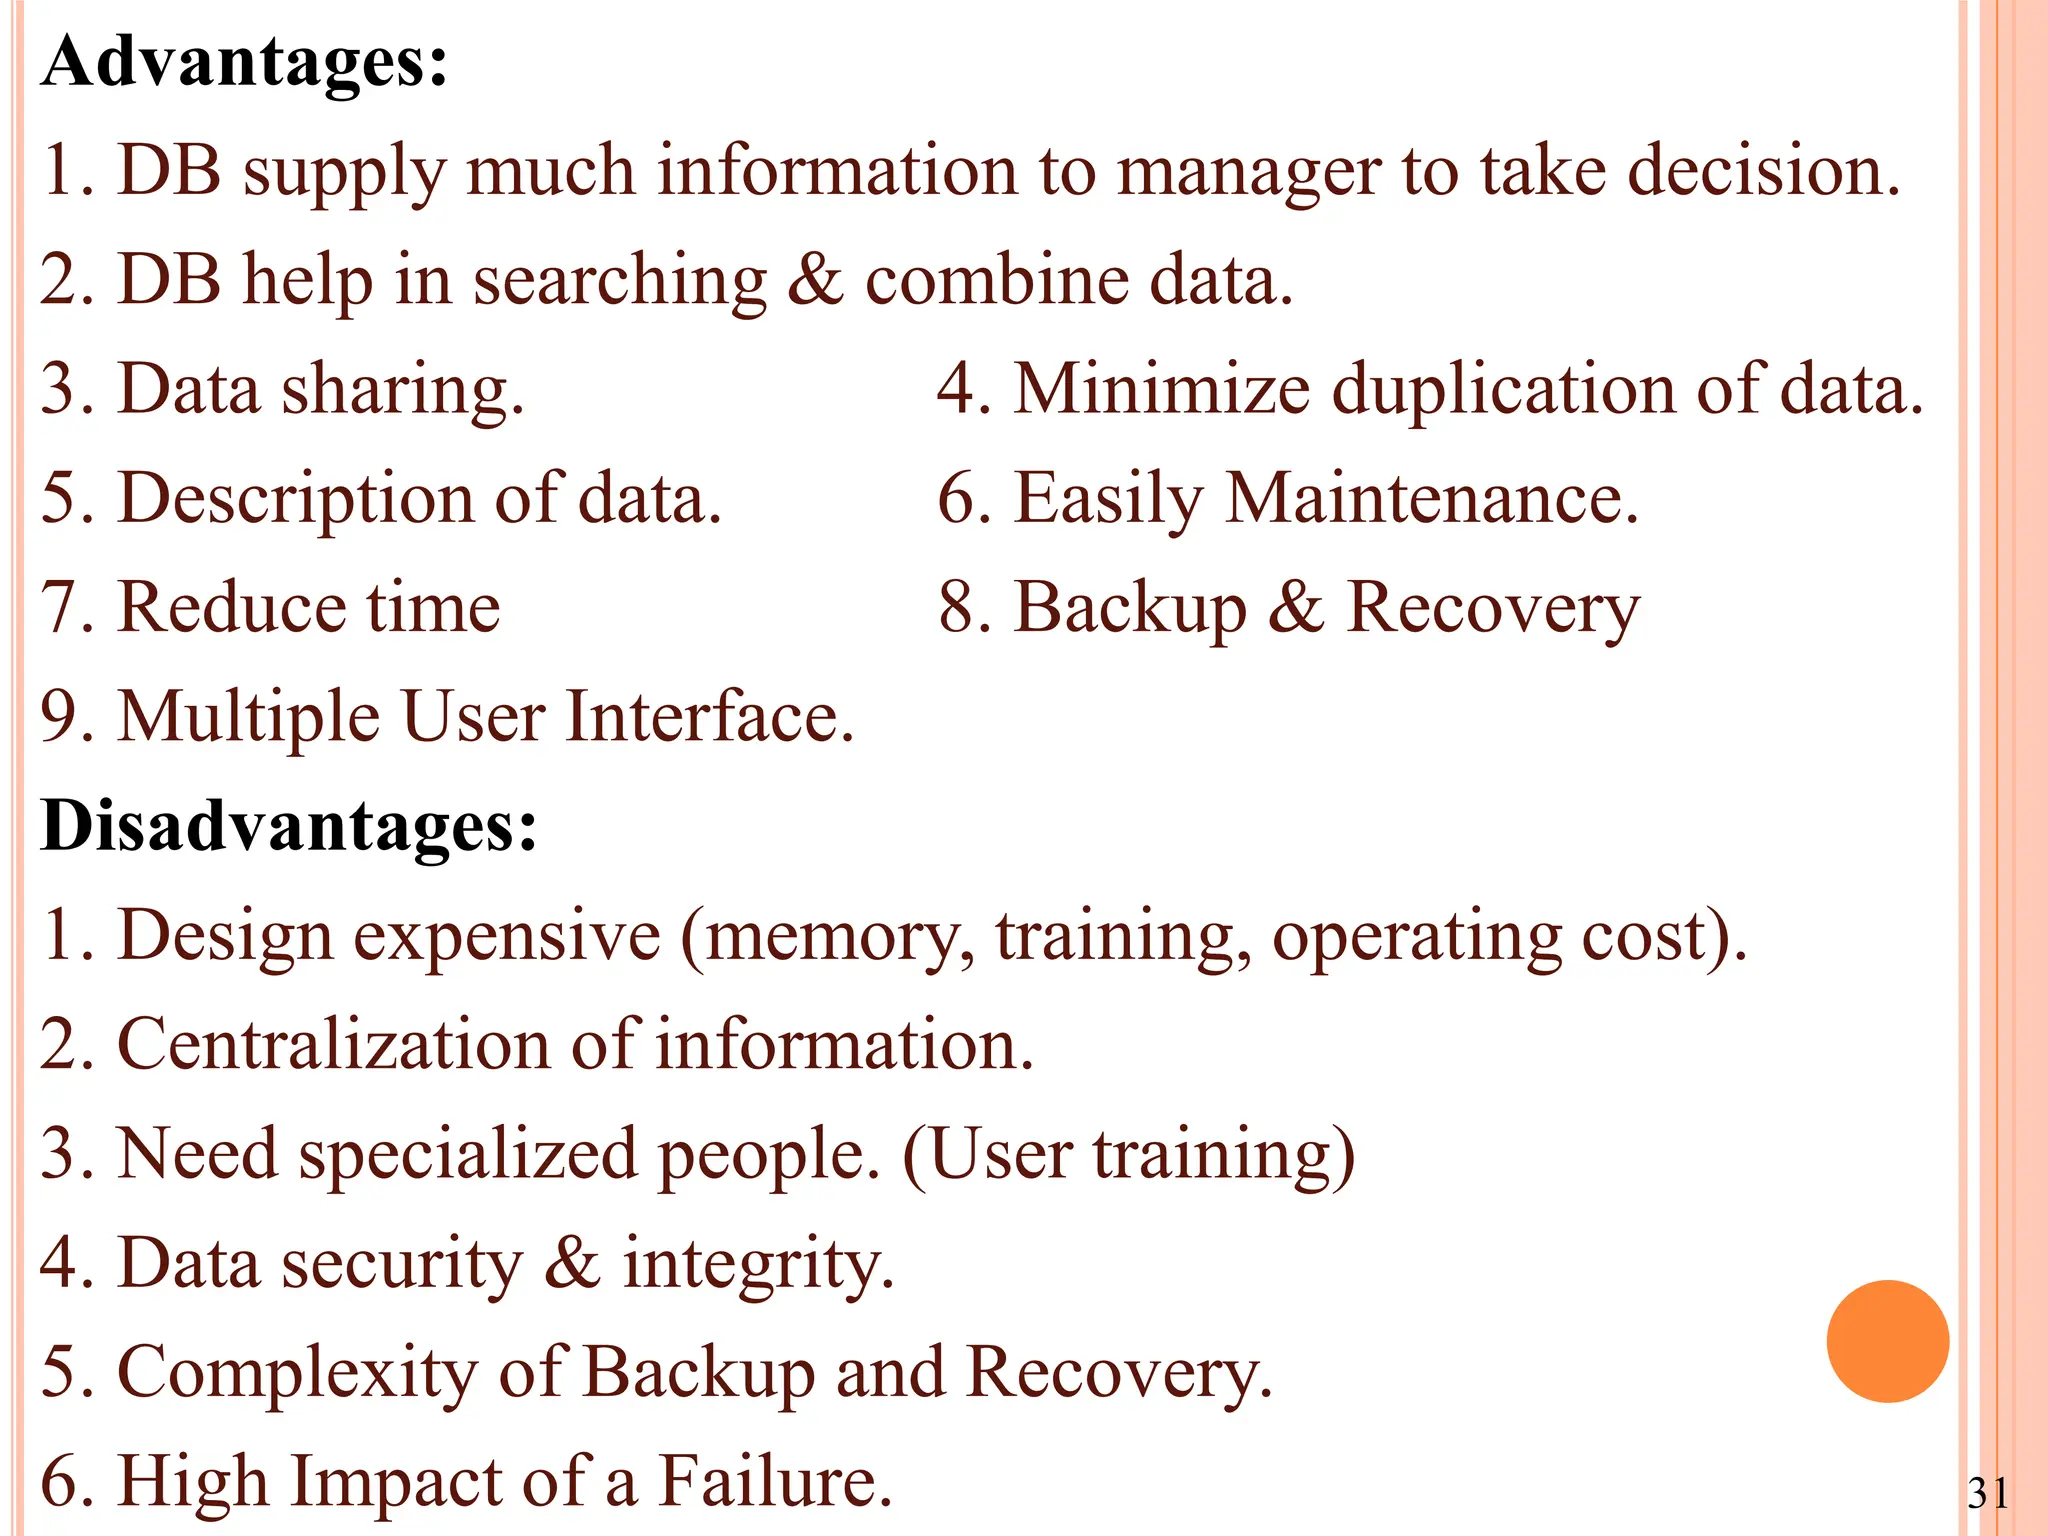
Diverse applications of DBMS in sectors like banking, finance, airlines, and its advantages like decision support and data consistency.
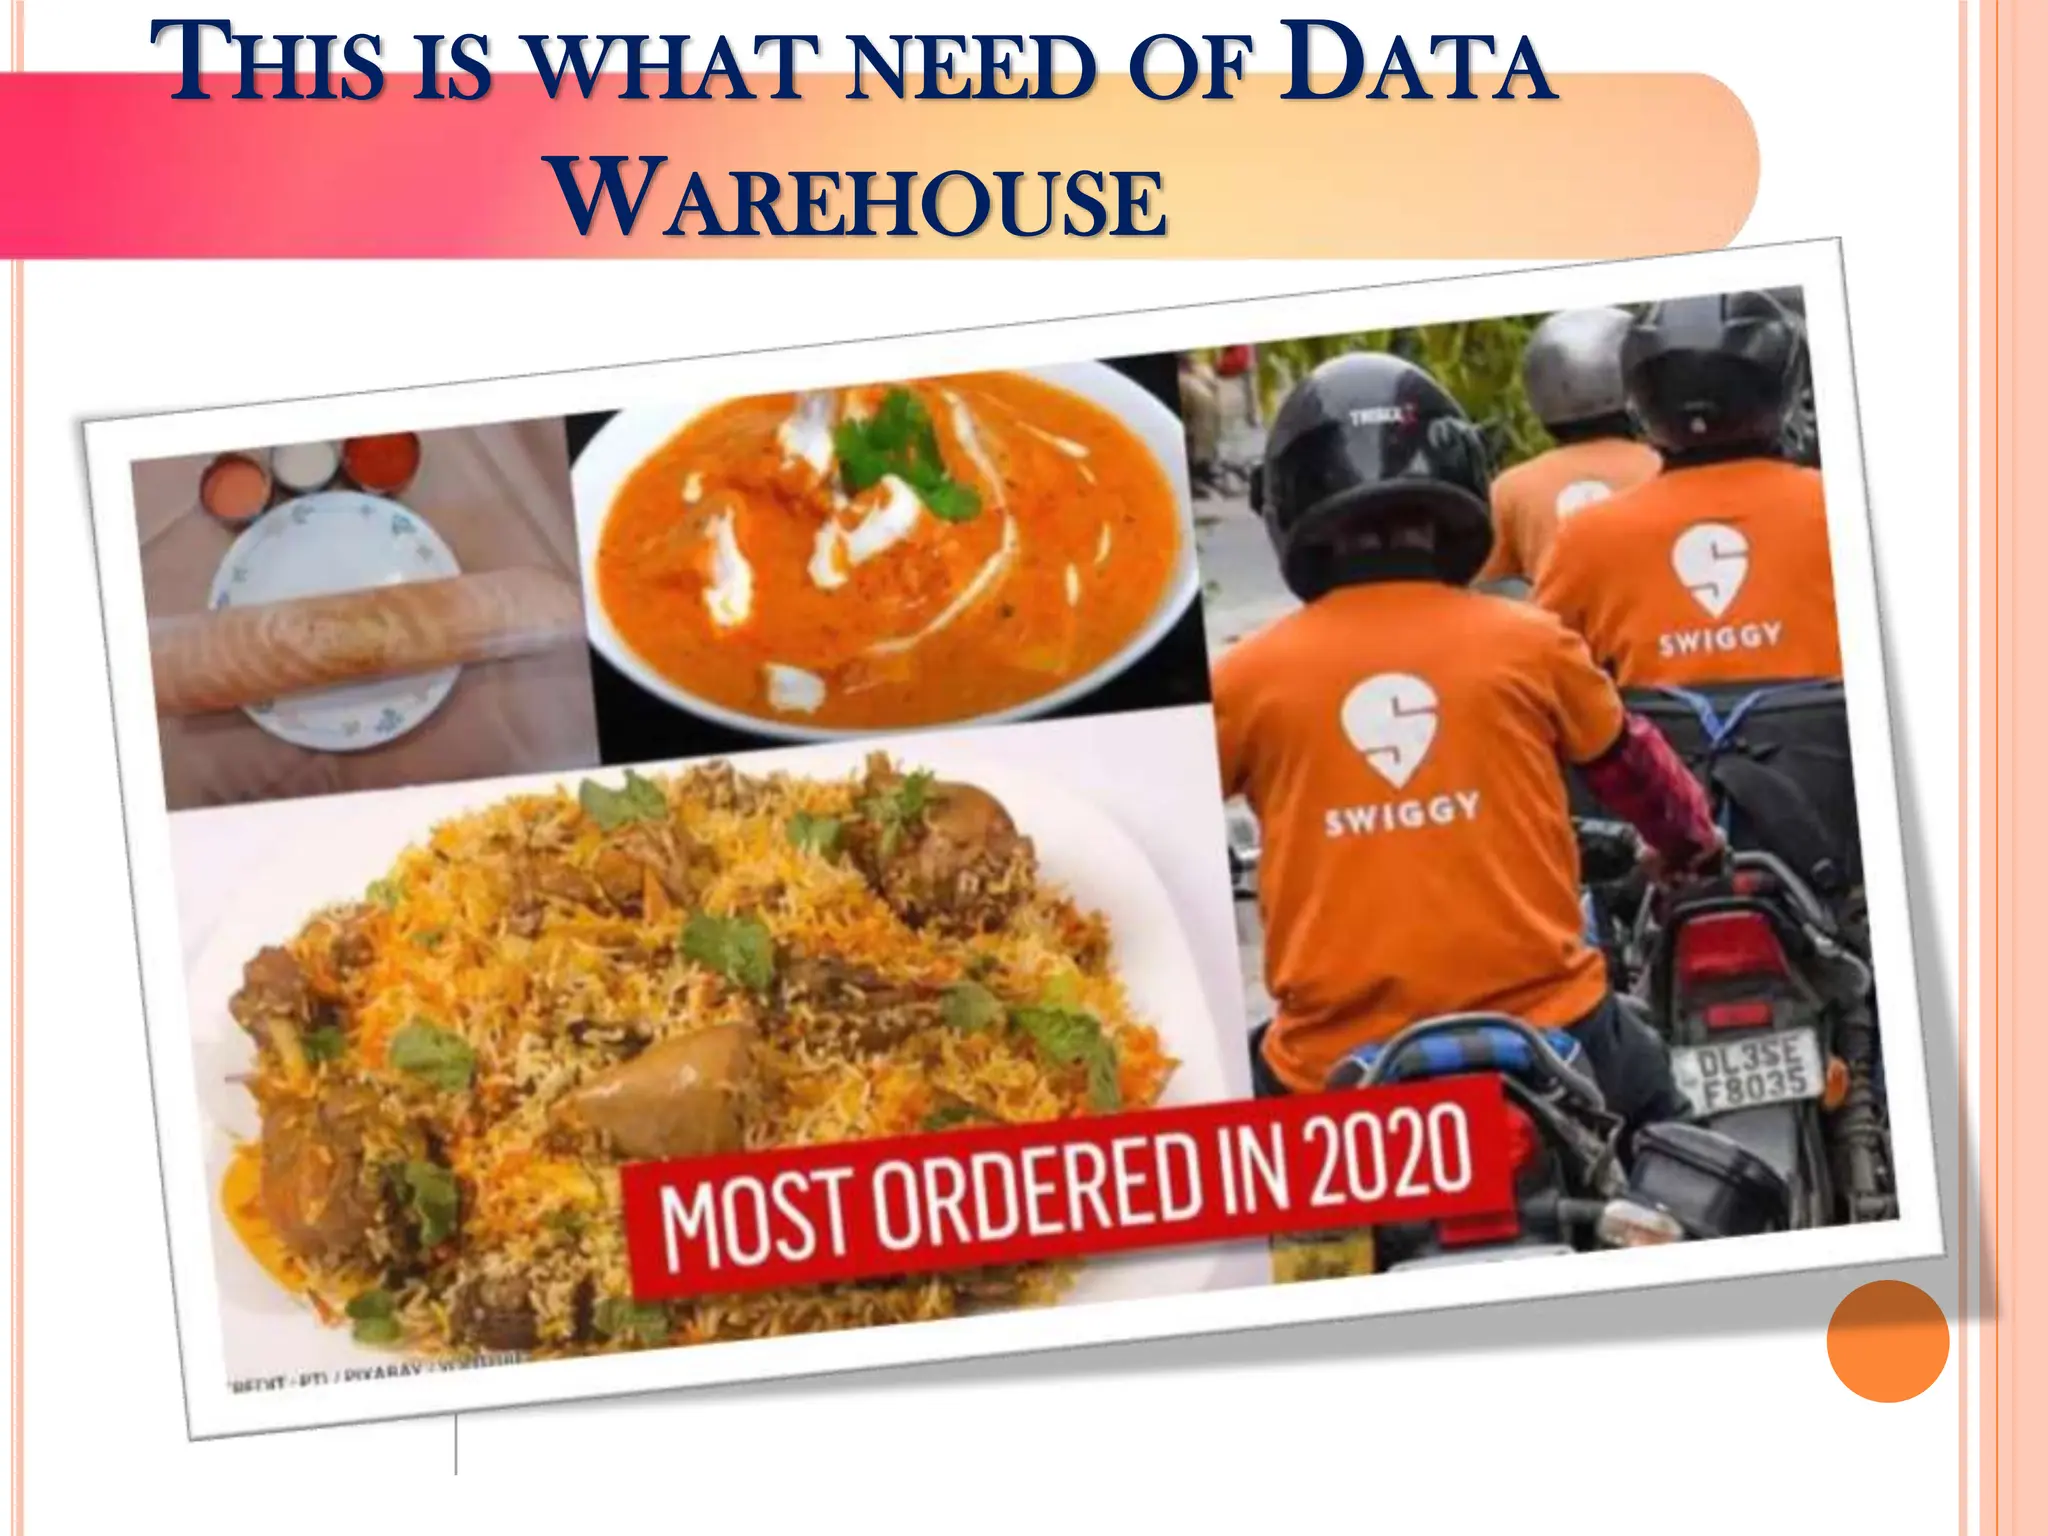
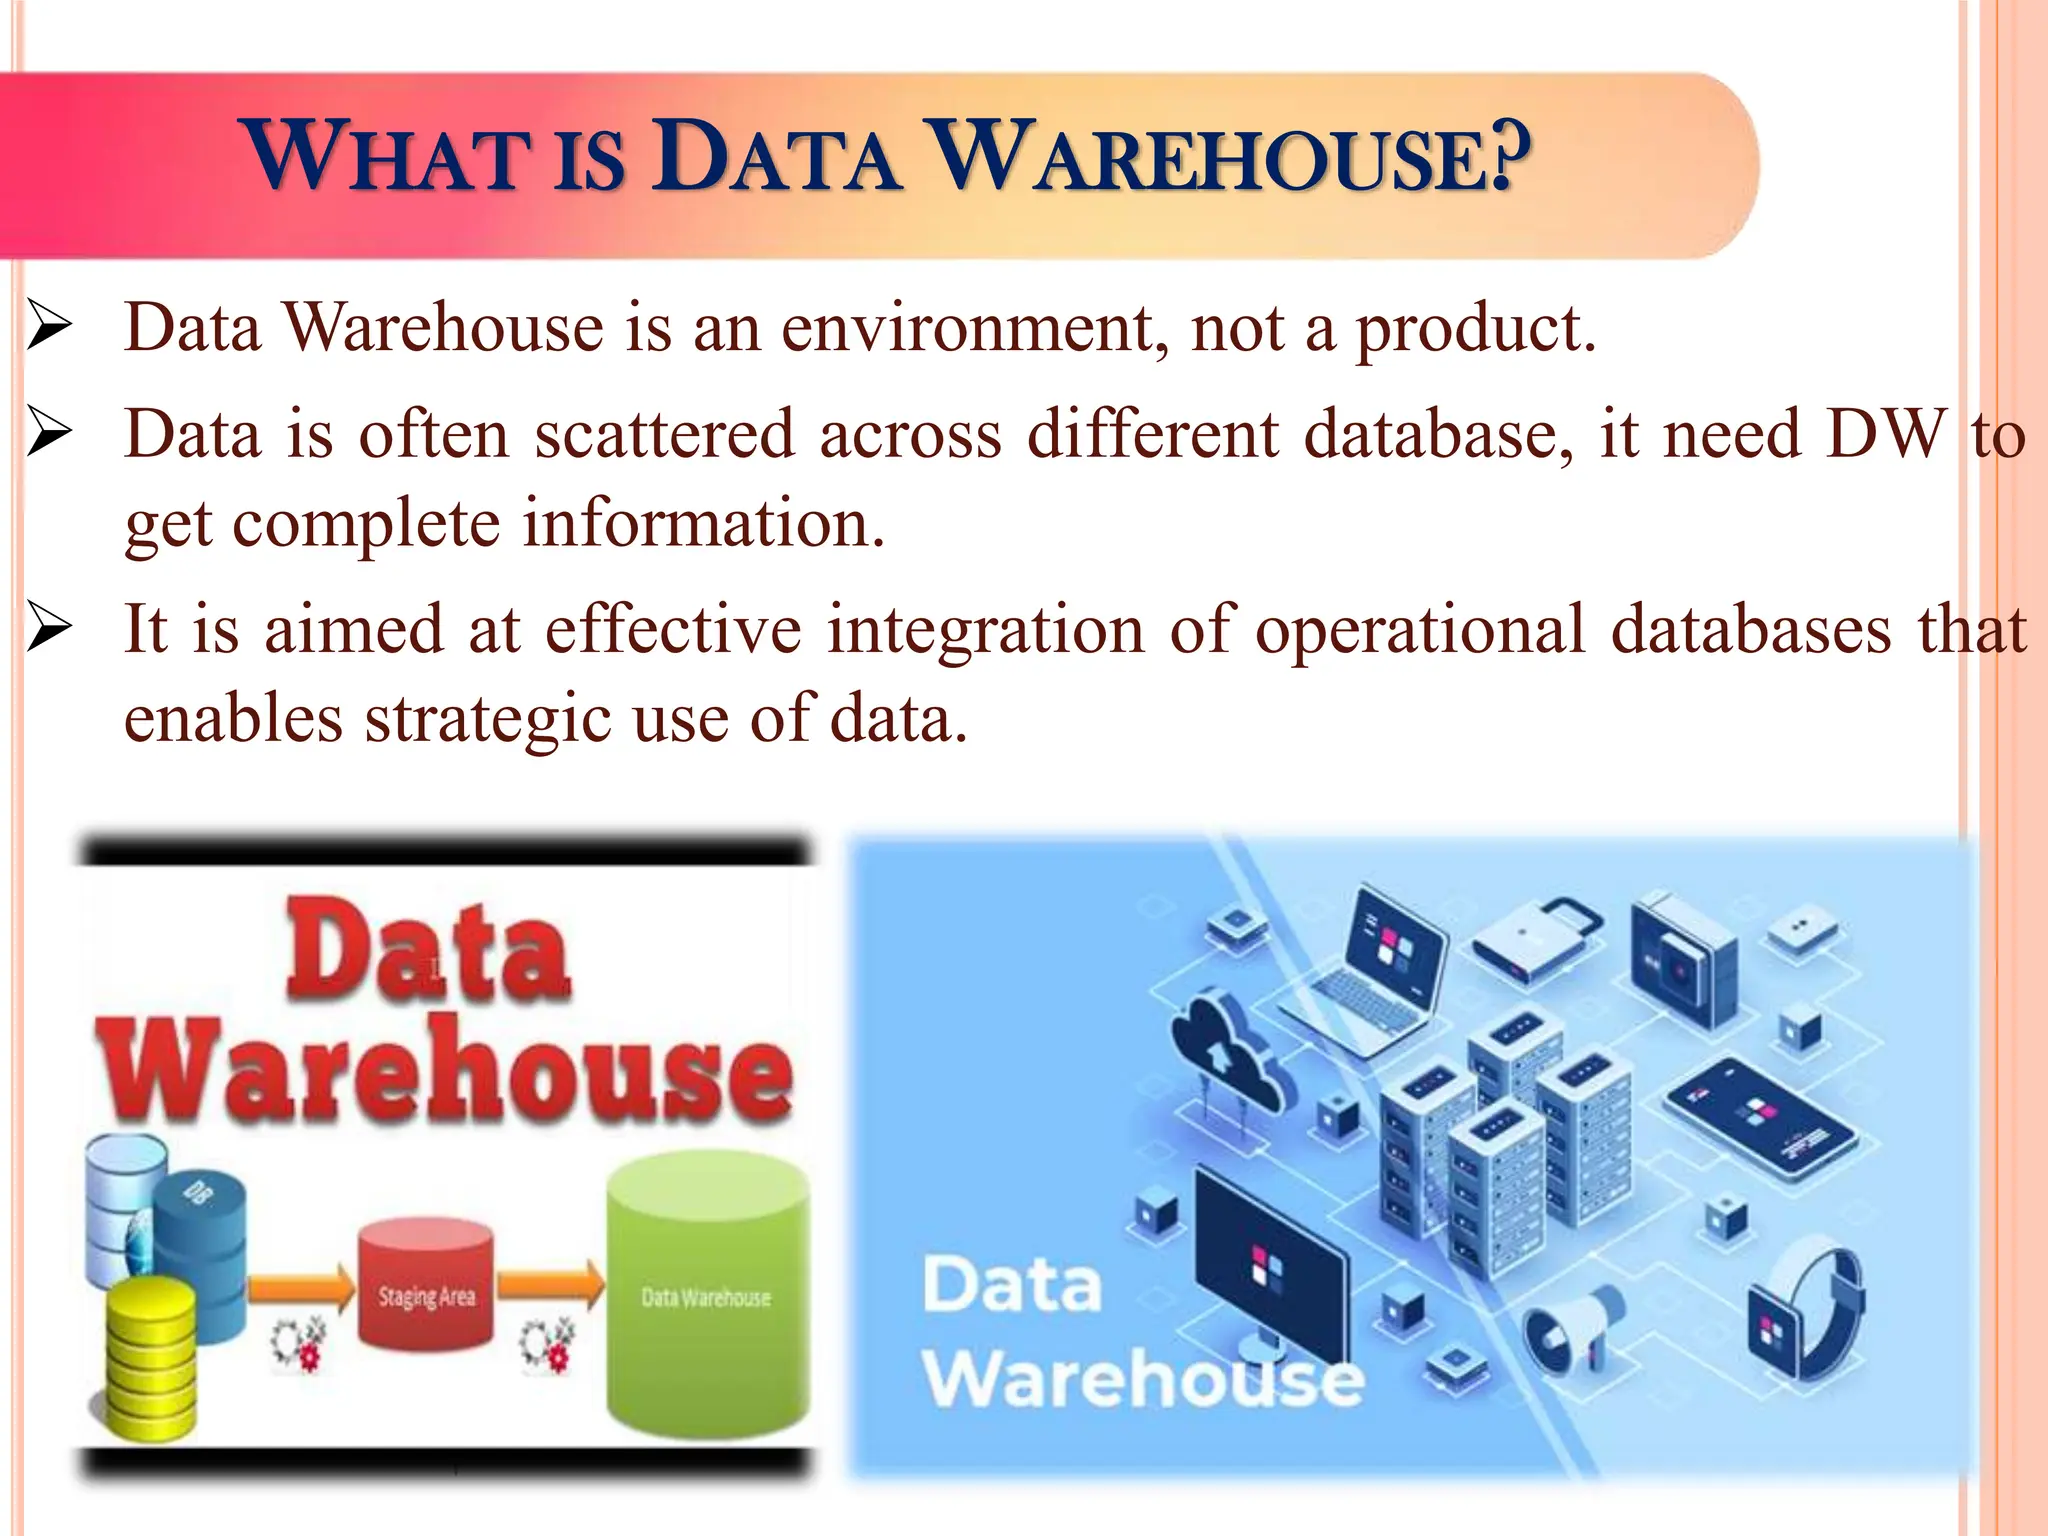
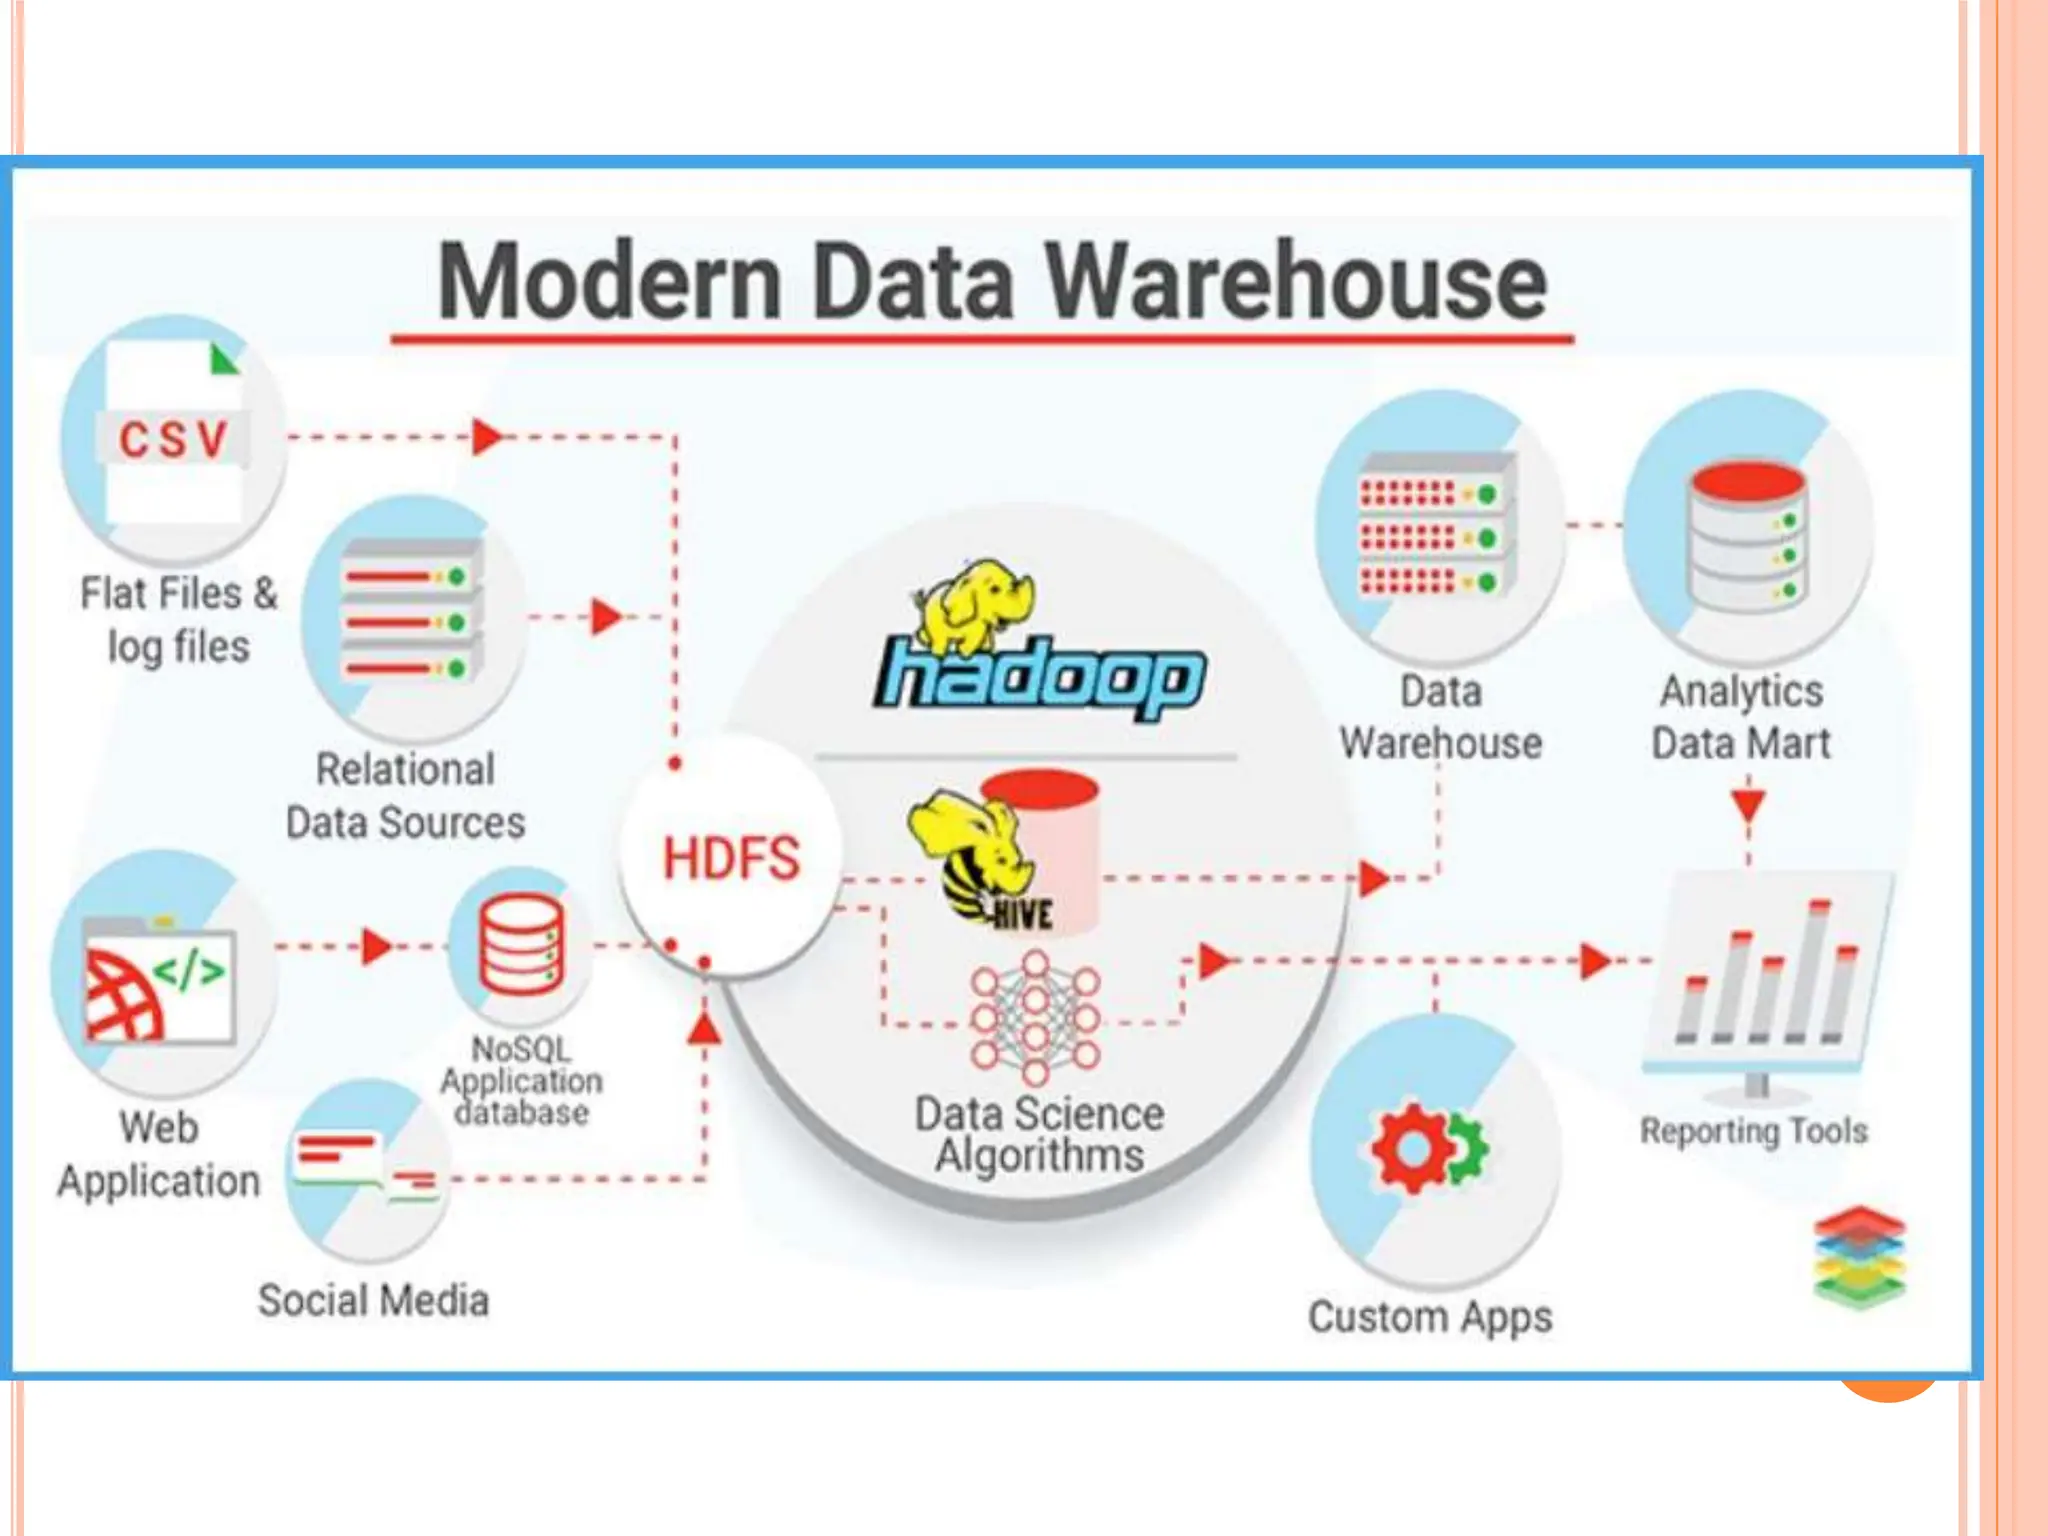
Introduction to data warehousing concepts and purpose, focusing on integration of scattered data for effective business strategies.
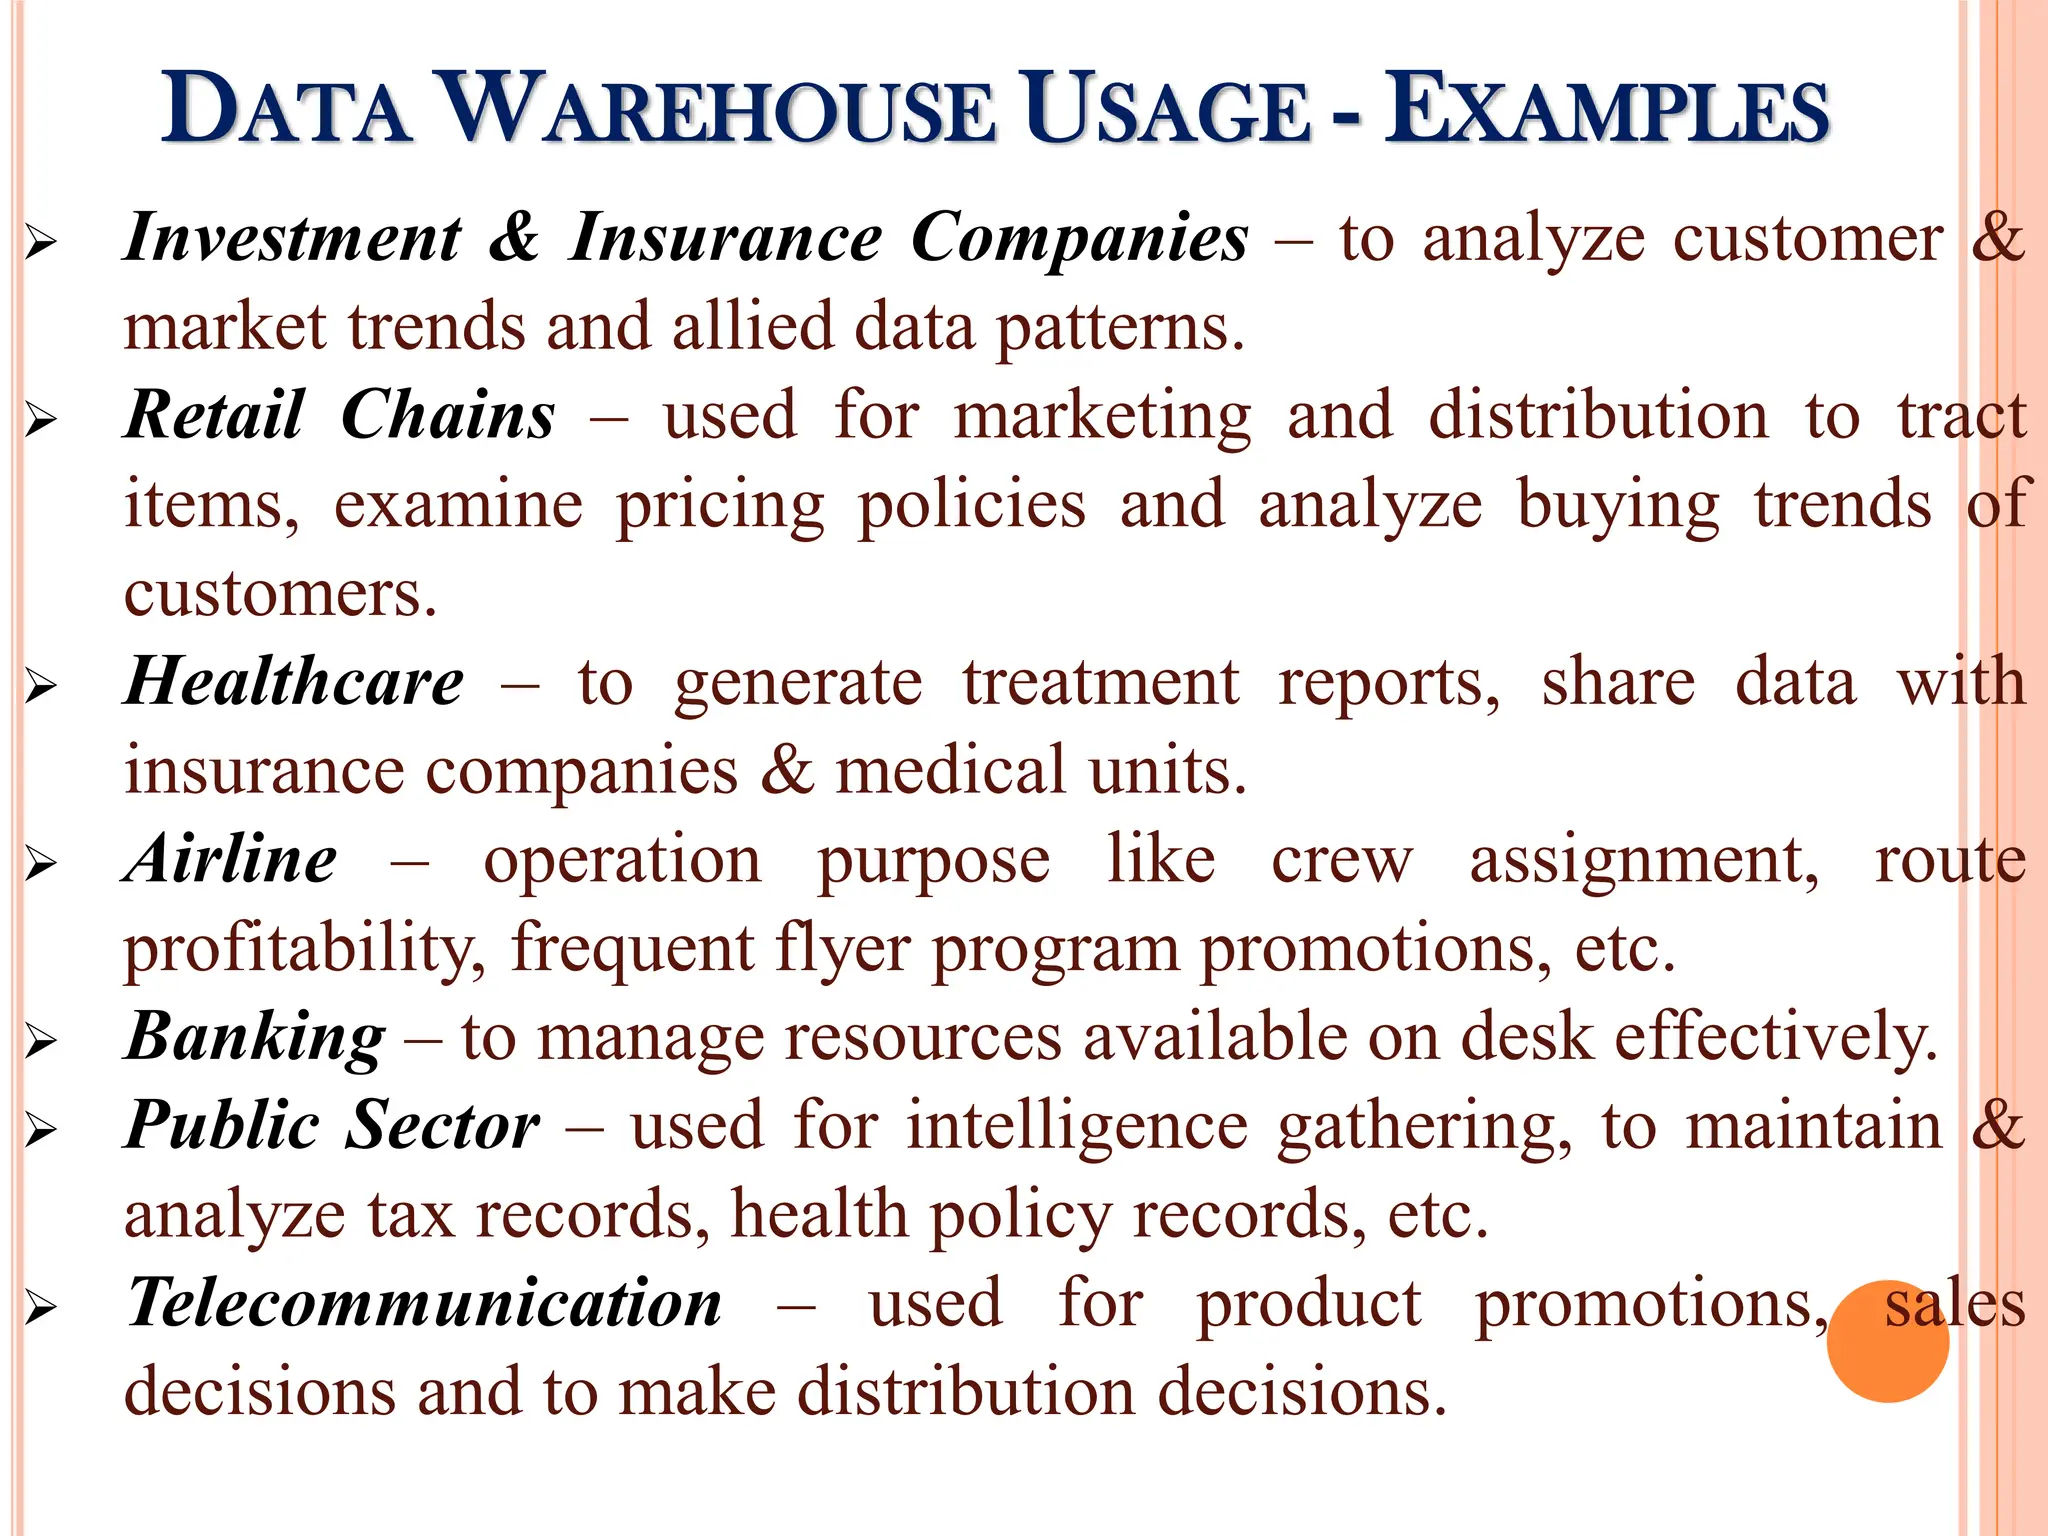
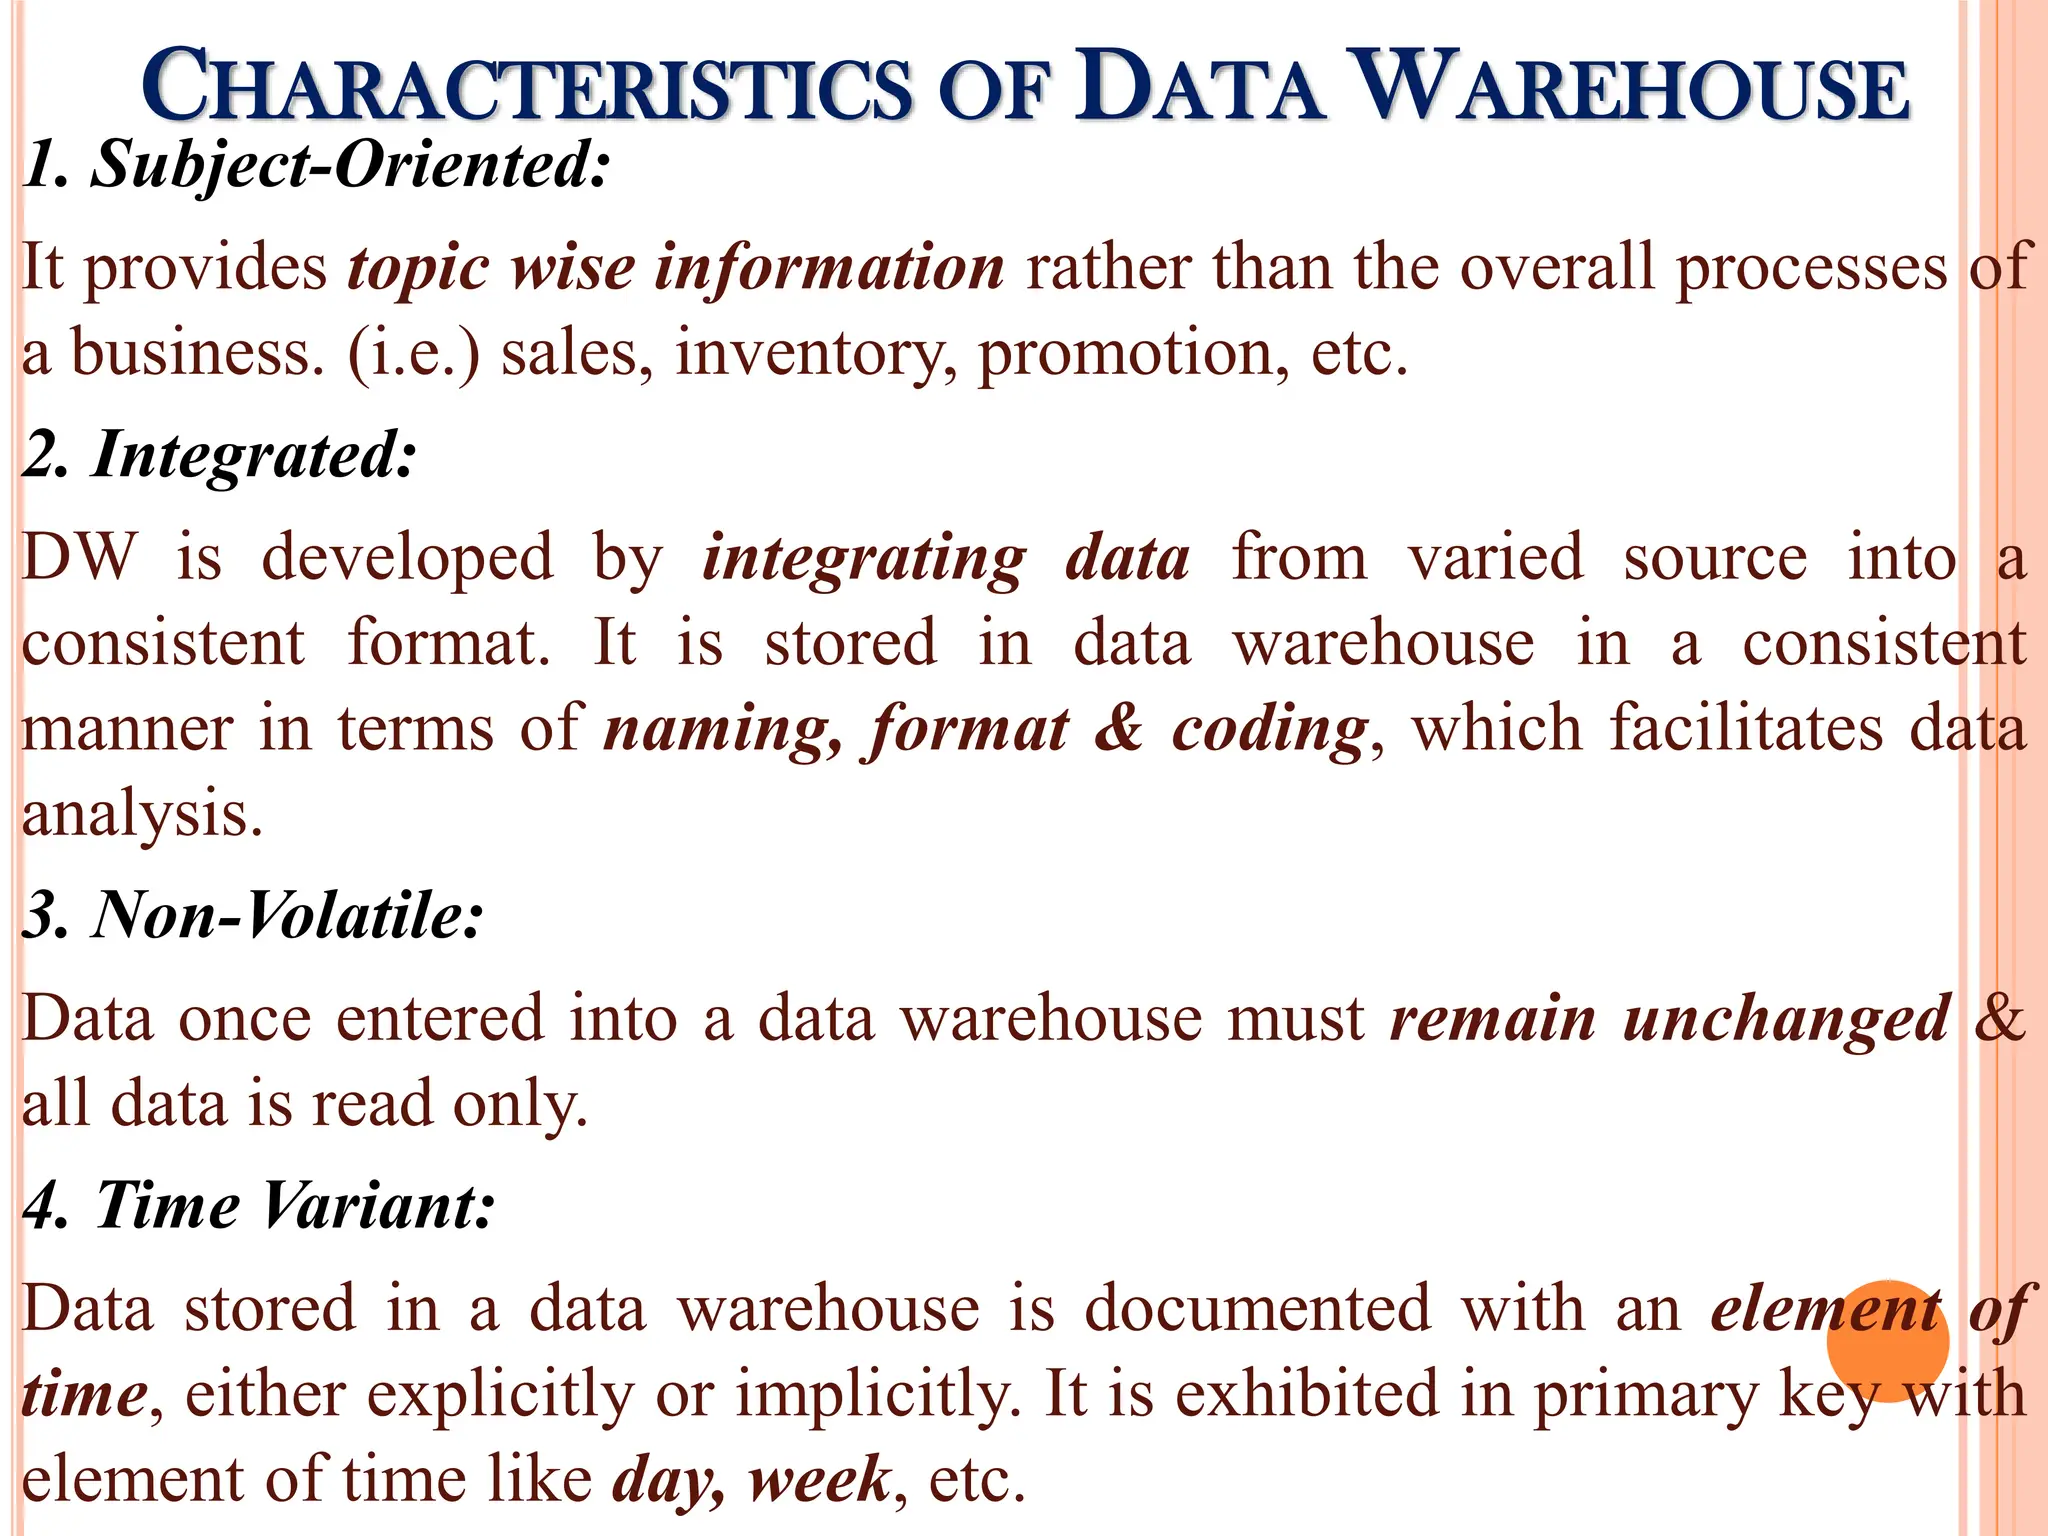
Key characteristics of data warehouses like subject-oriented and integrated data storage, along with examples from various industries.
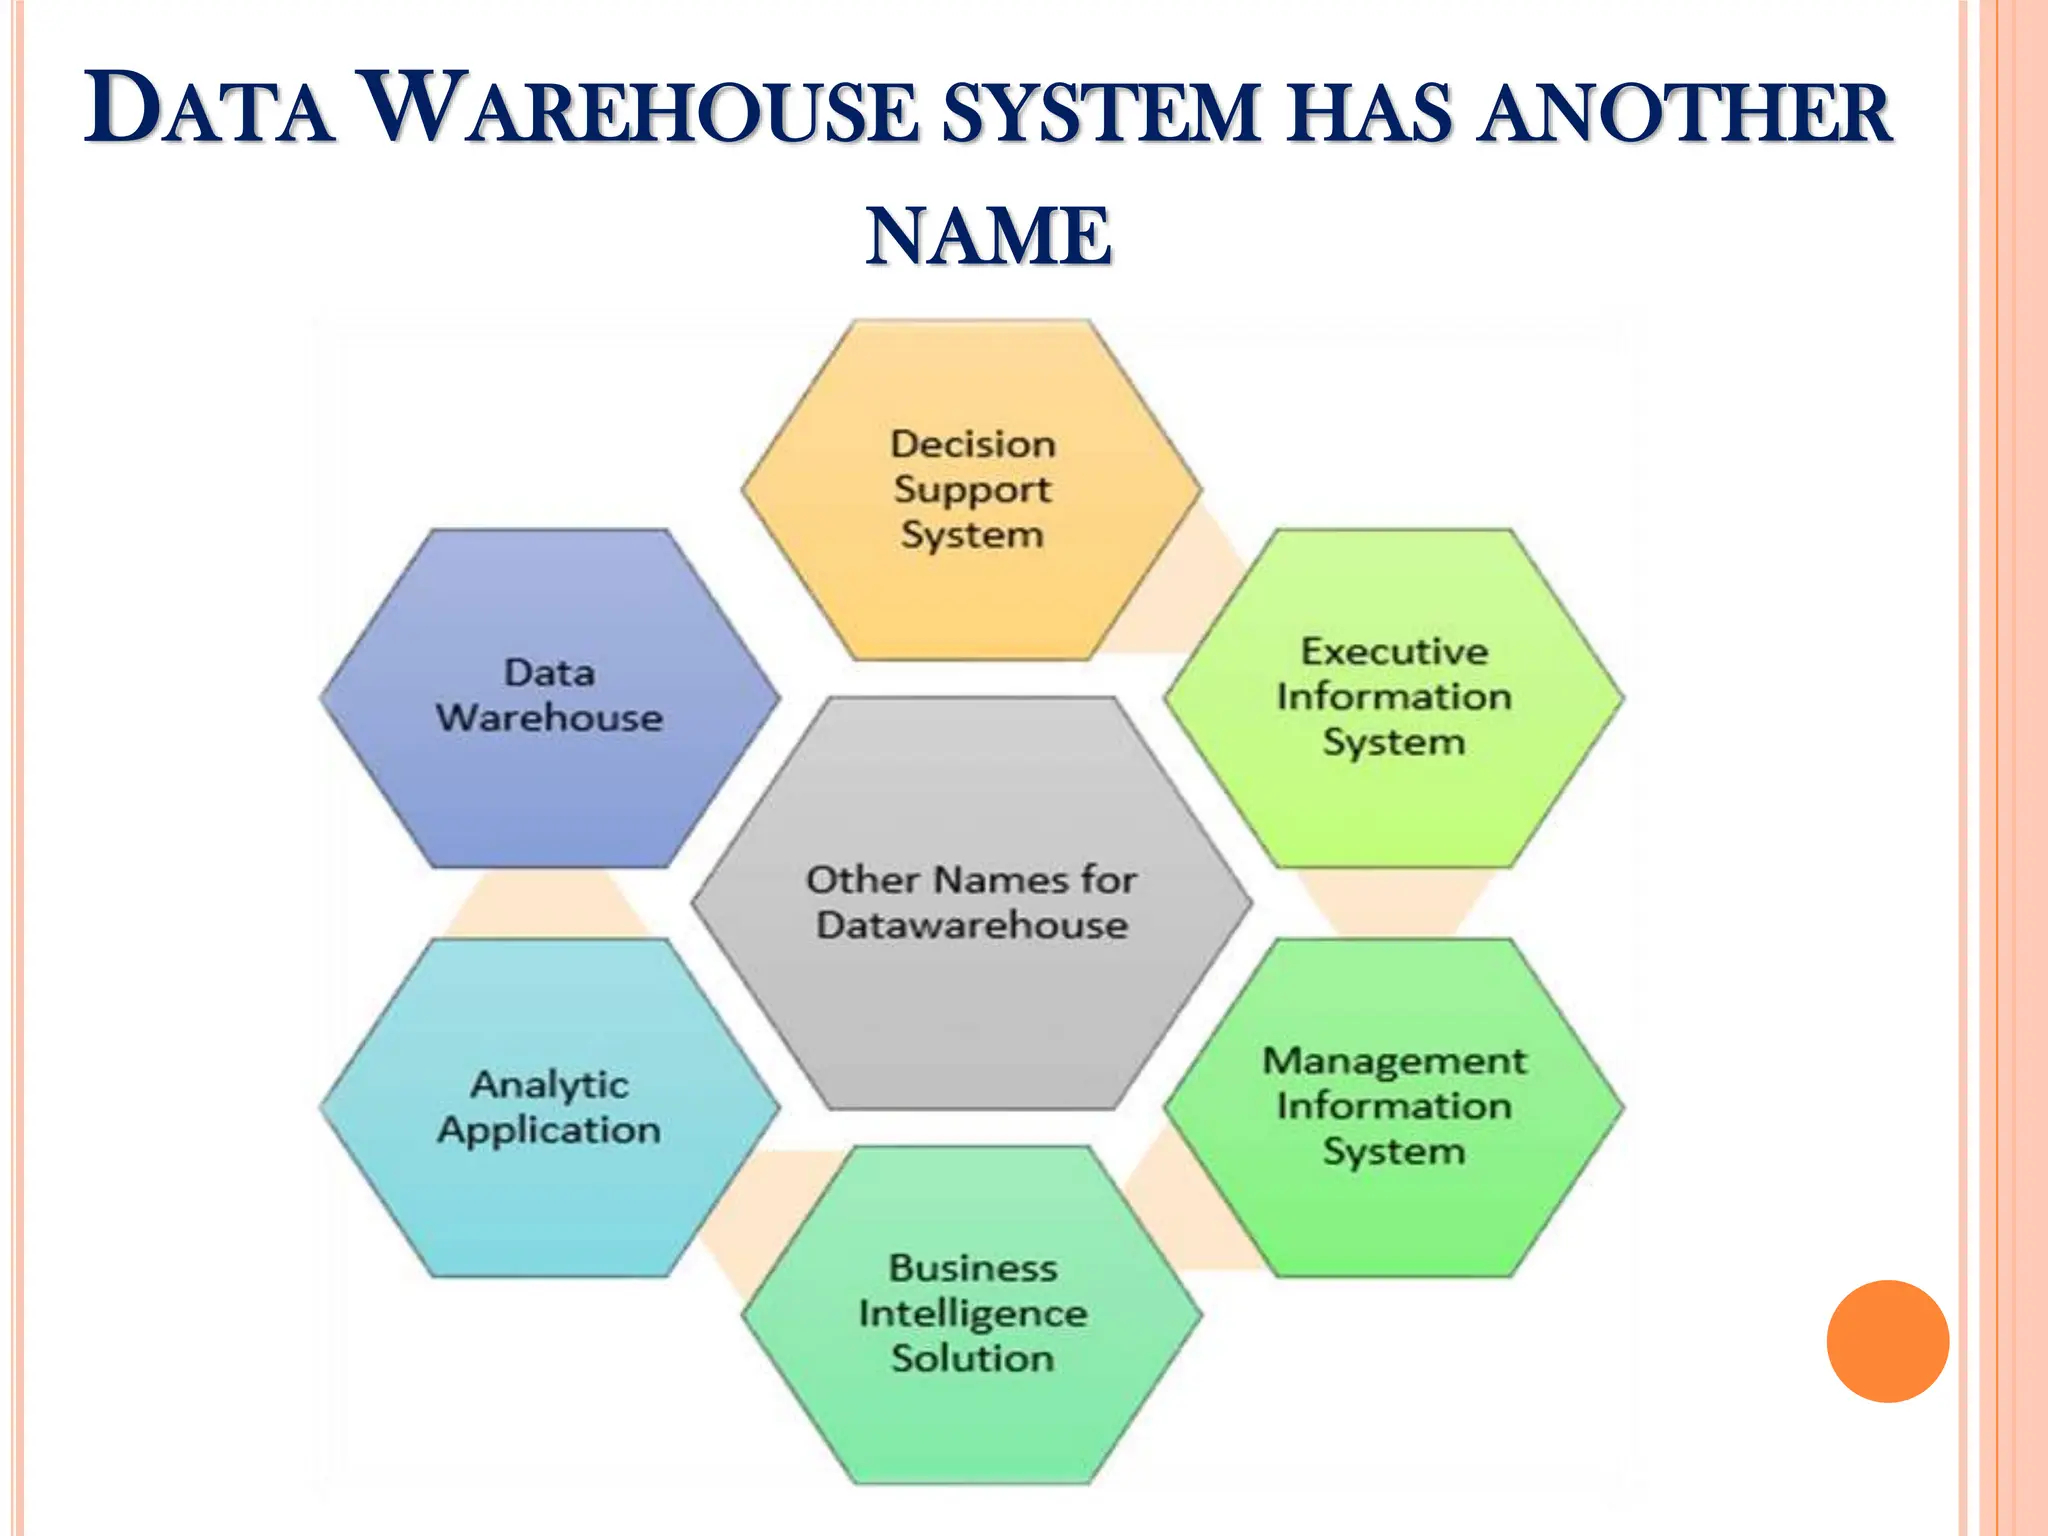
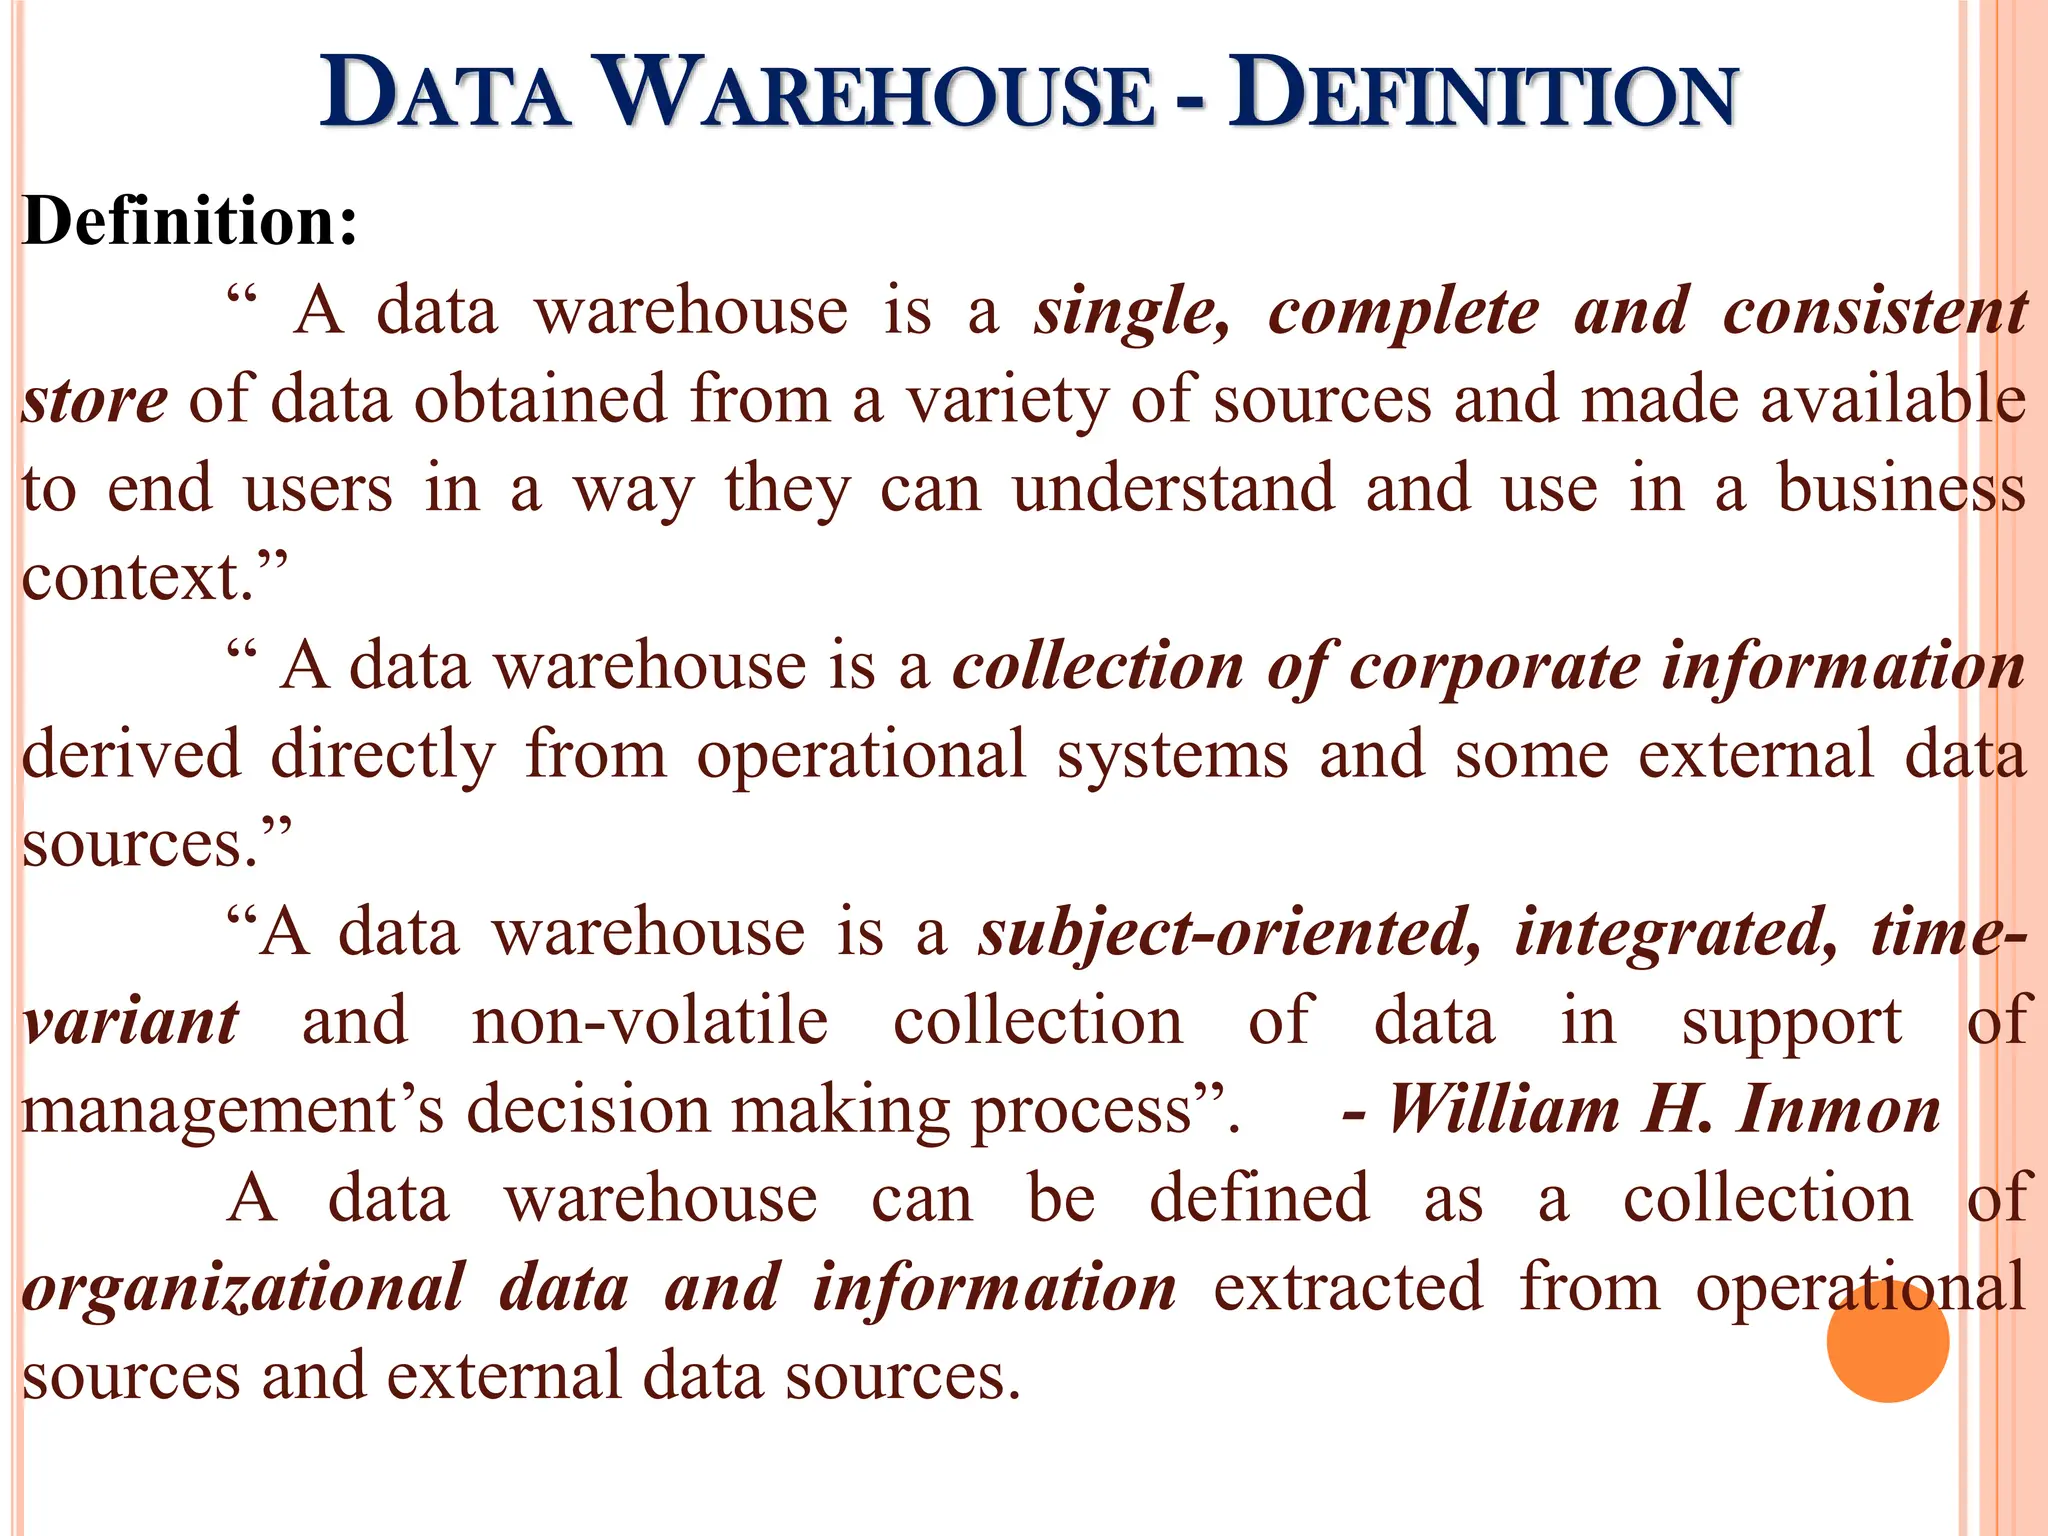
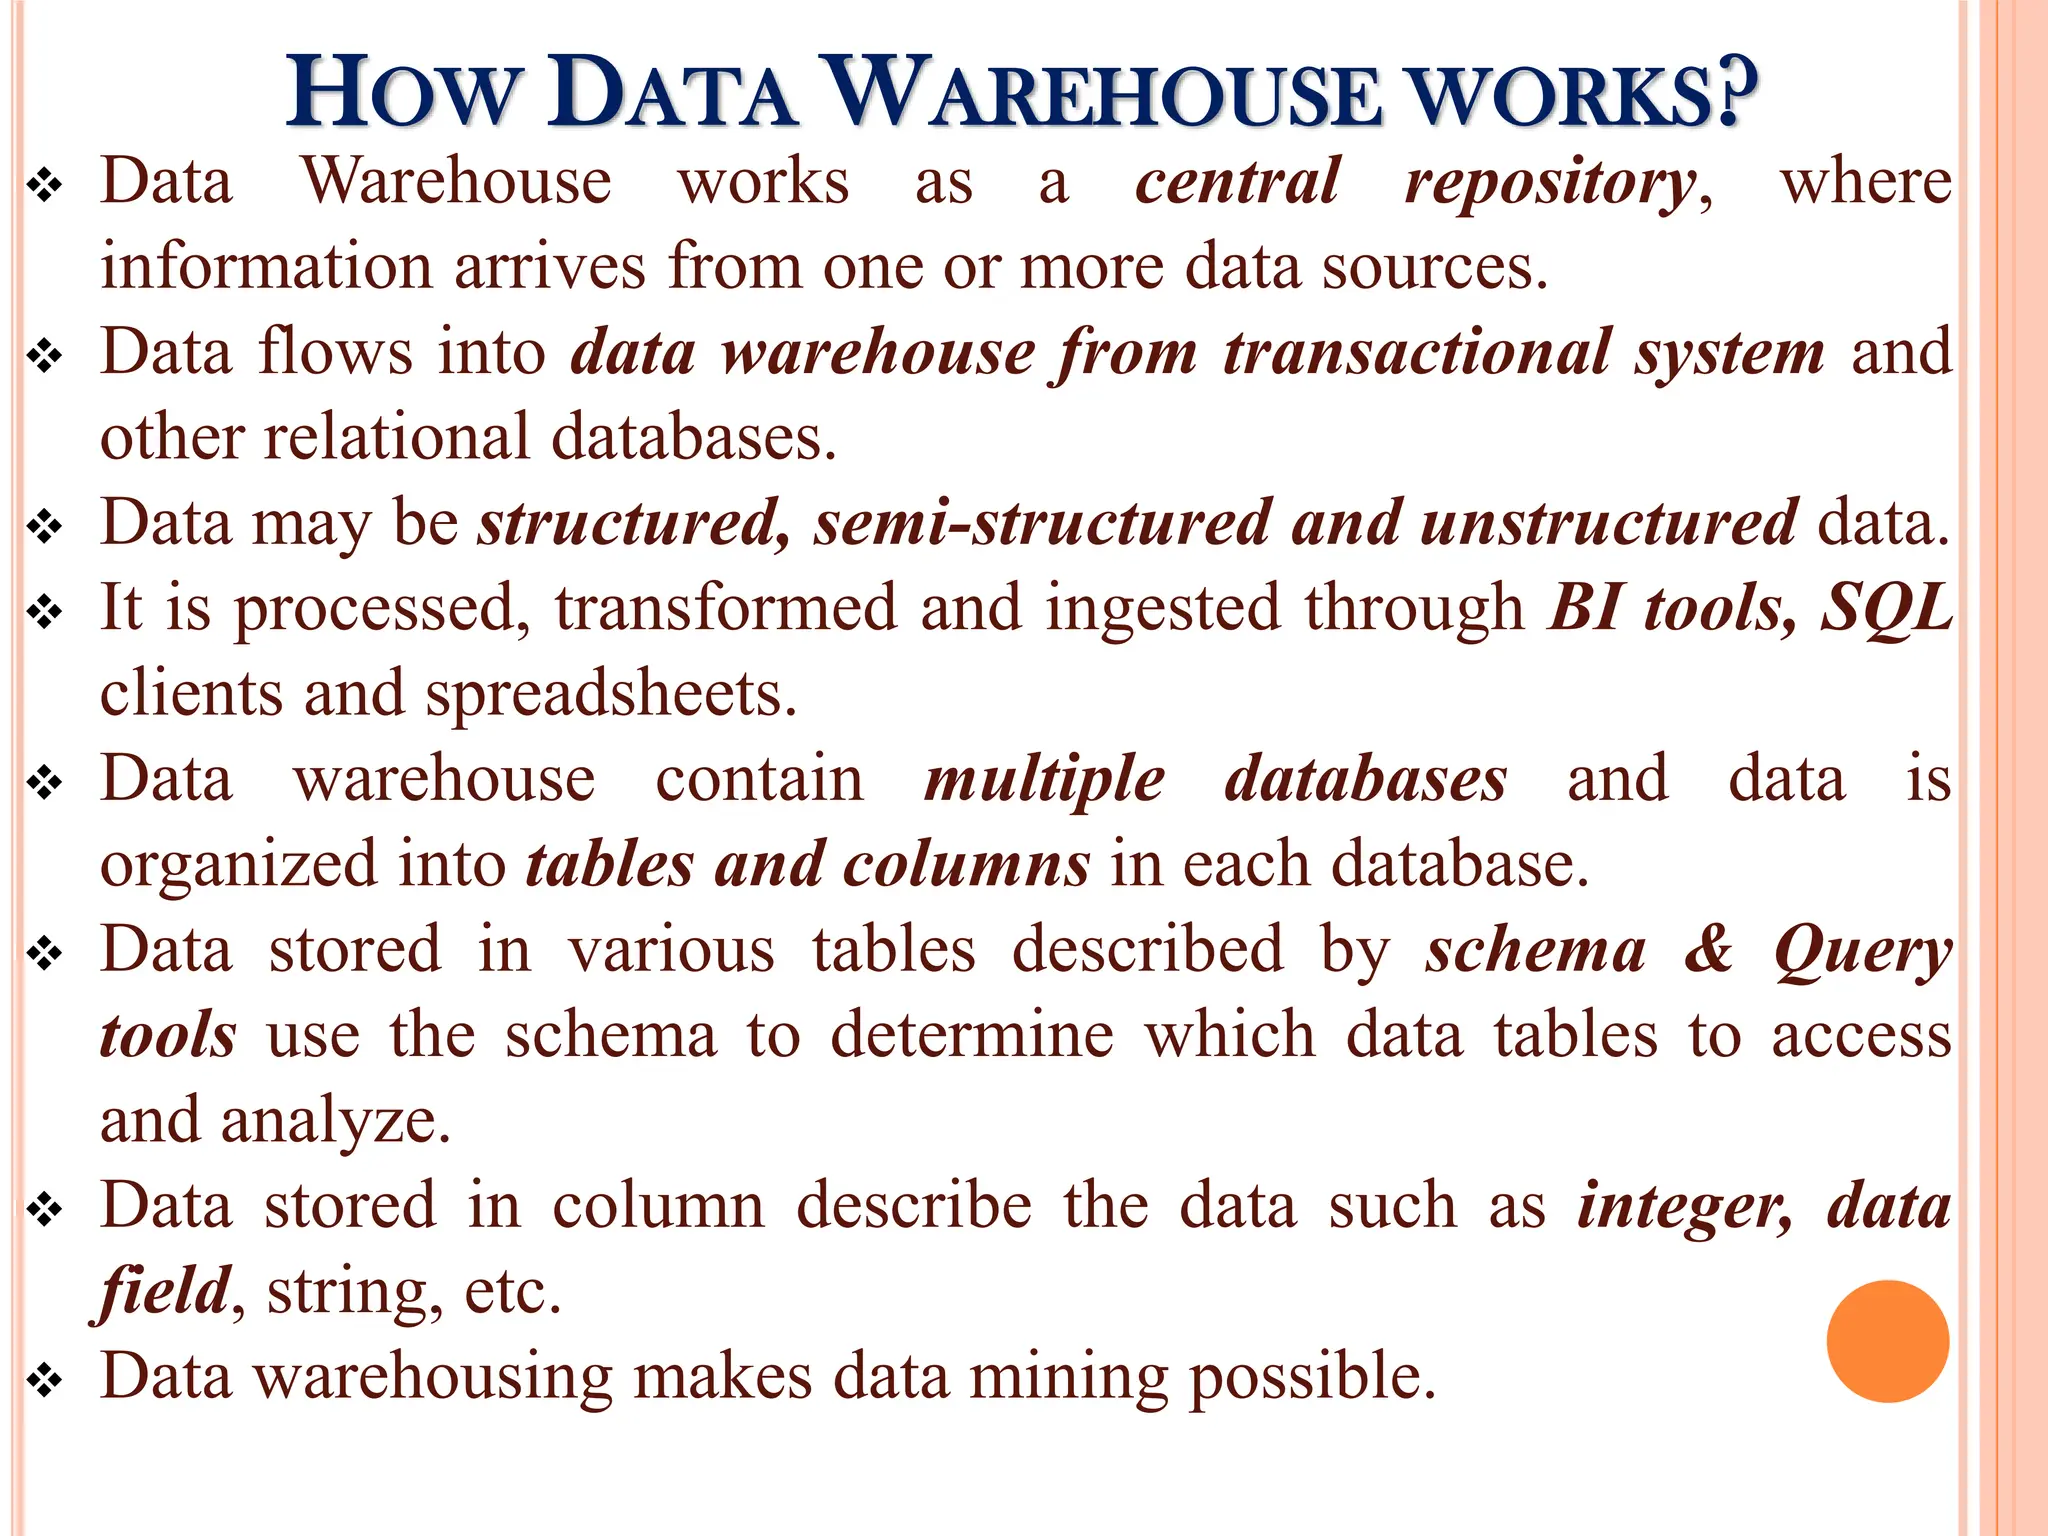
Definitions and working principles of data warehouses as comprehensive data stores and their impact on decision making processes.
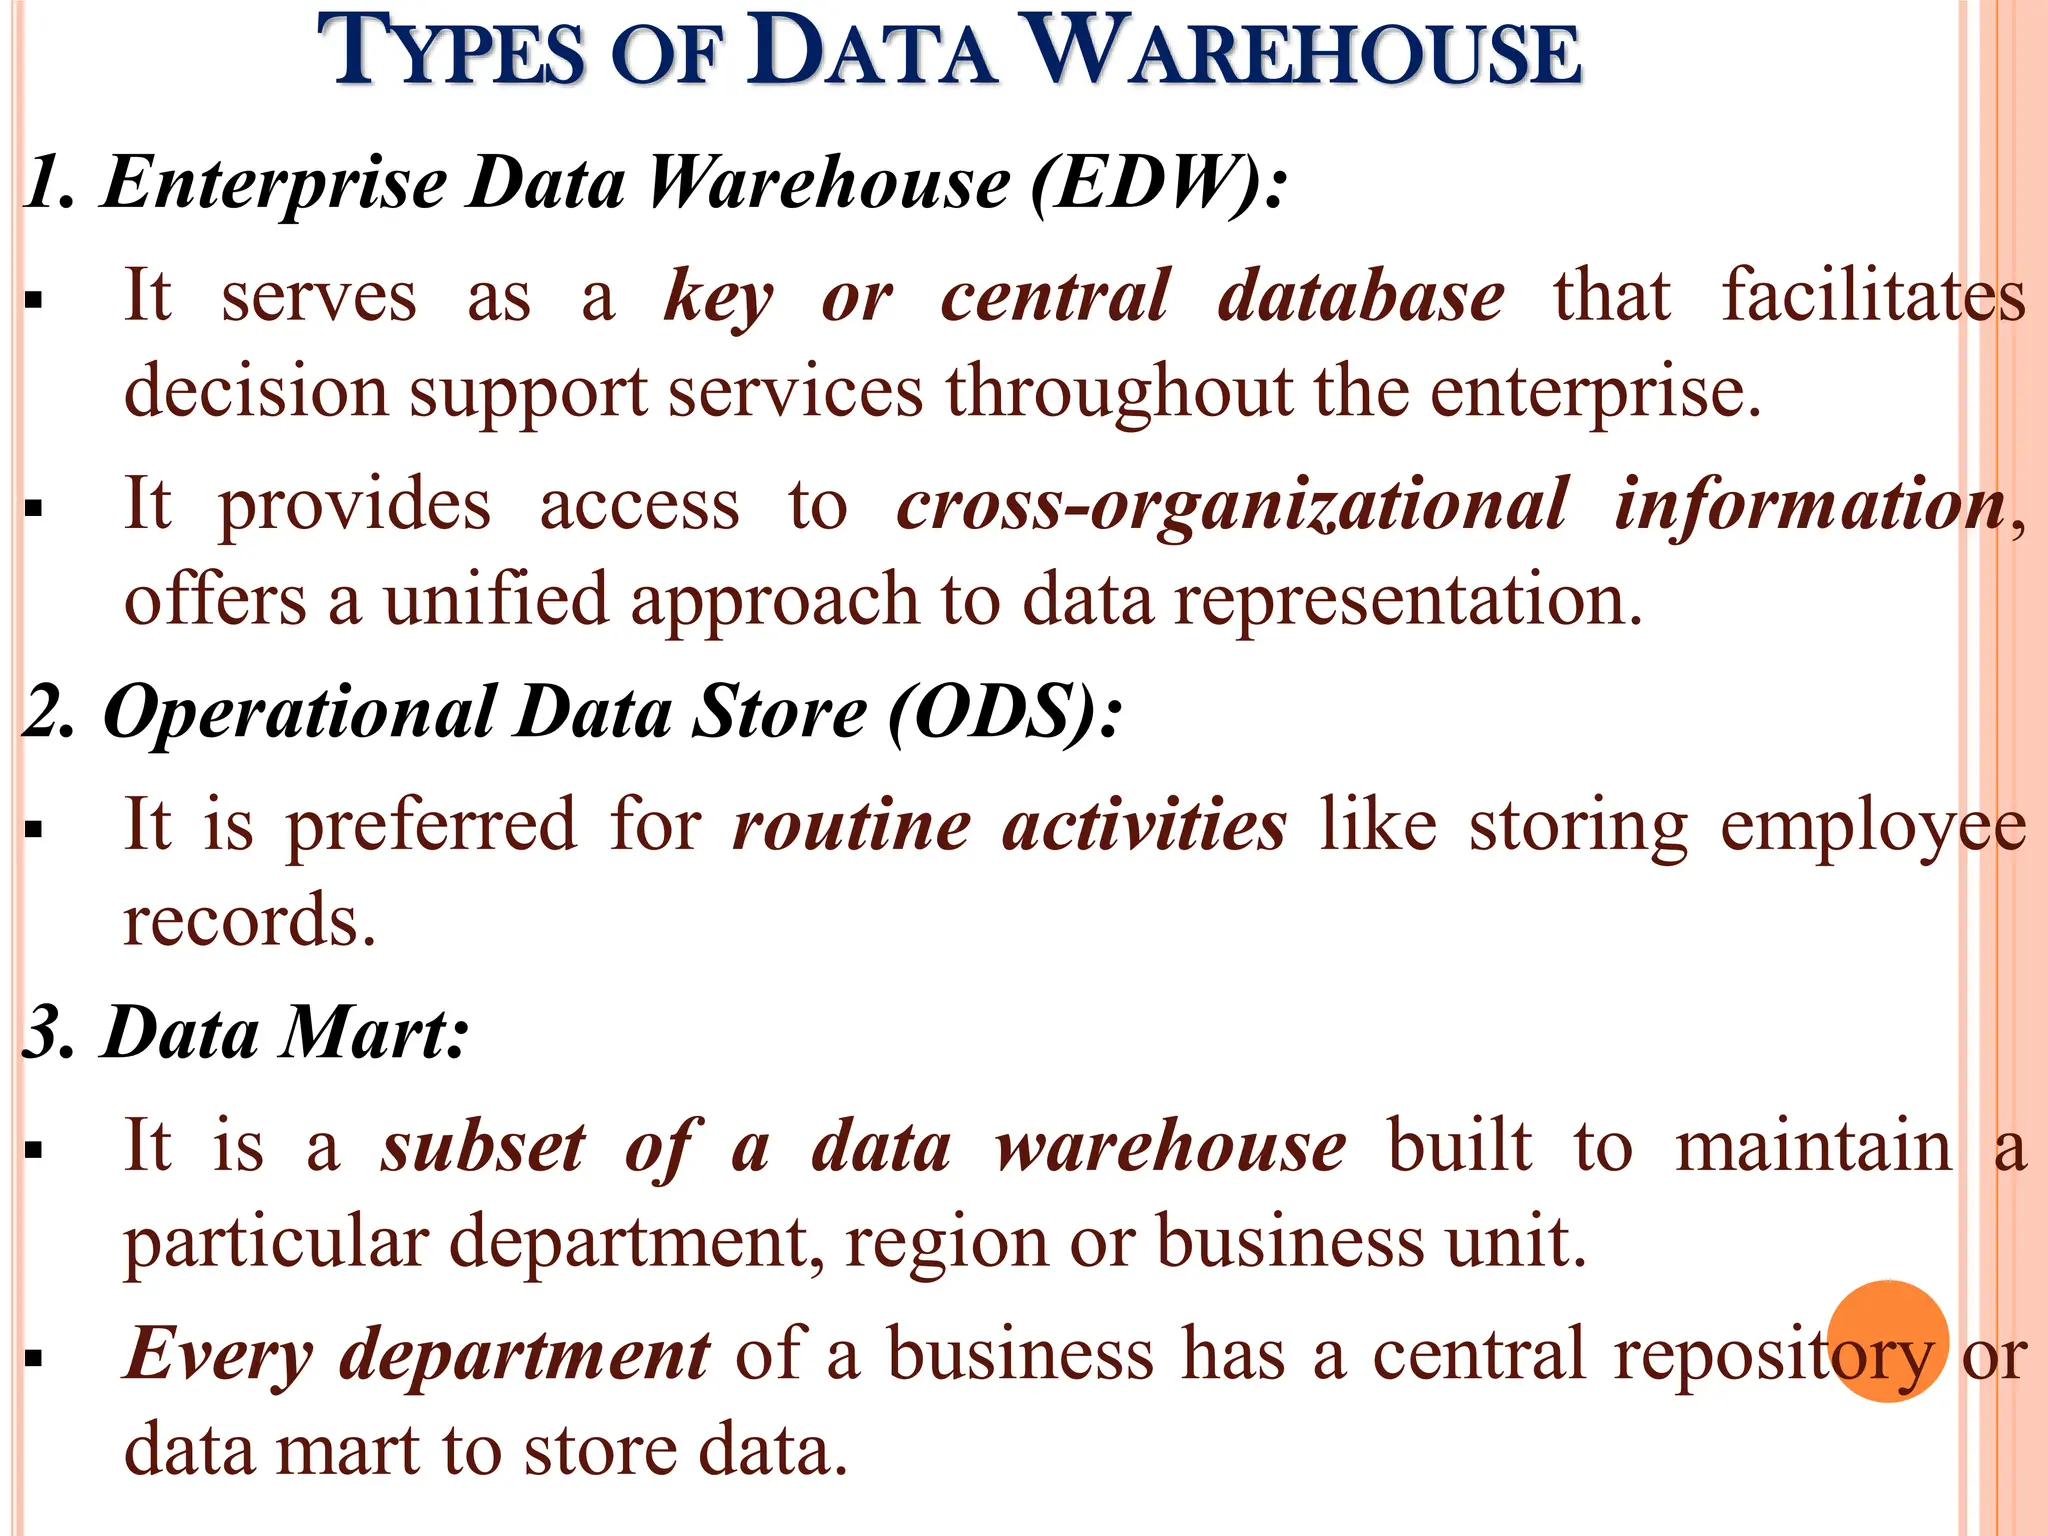
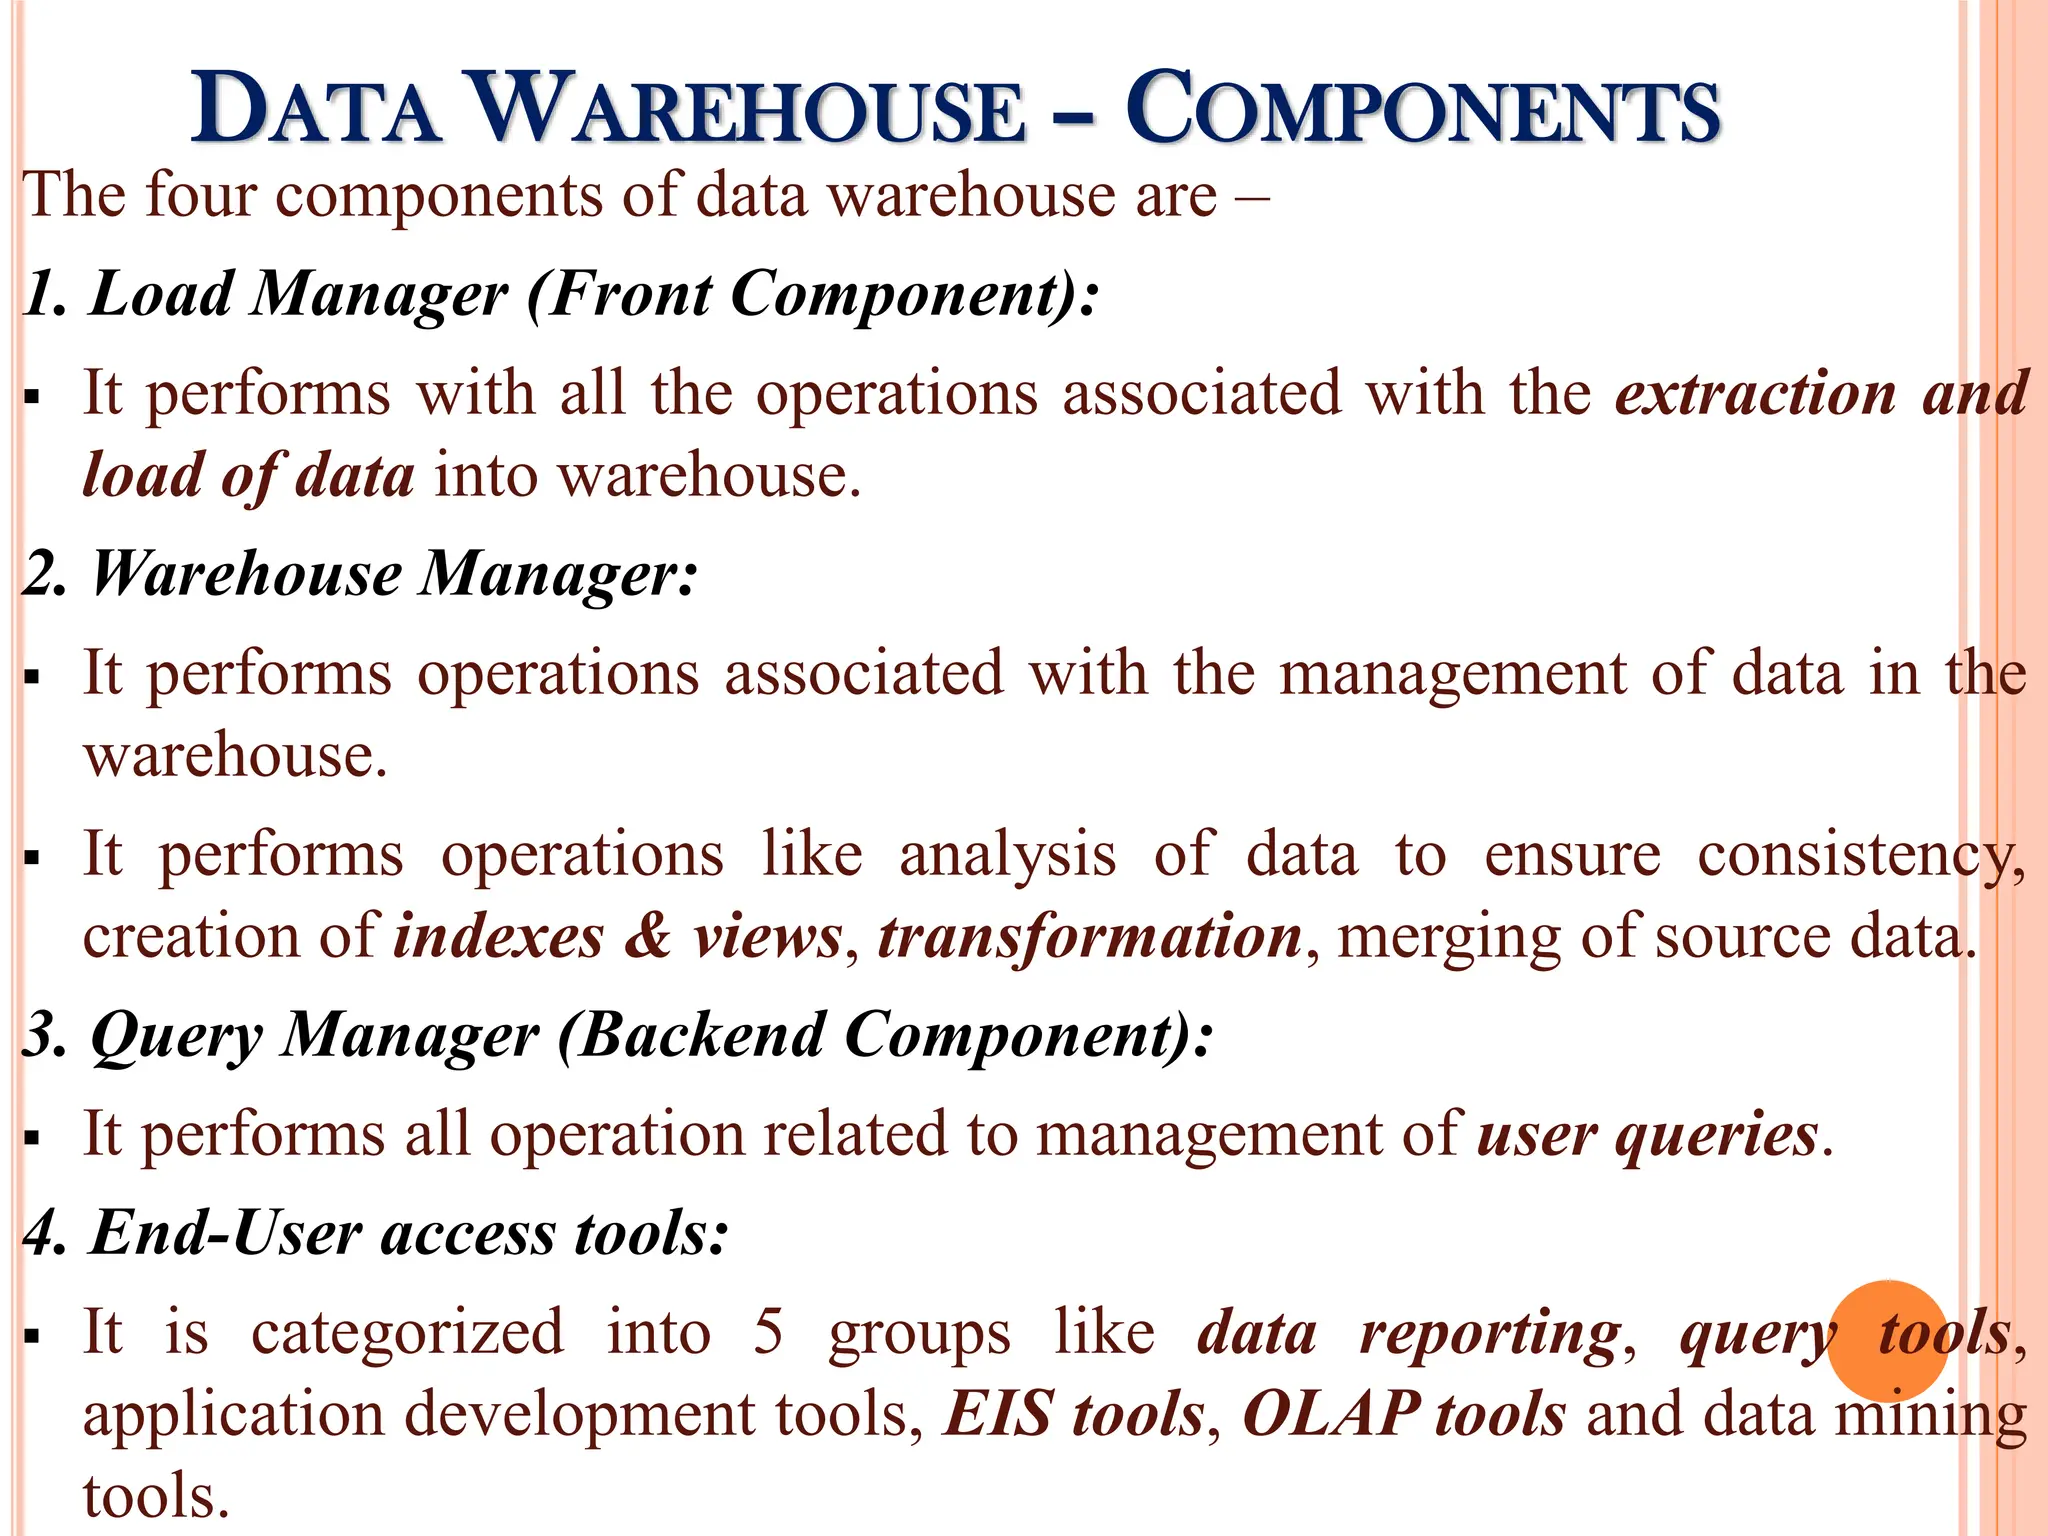
Different types of data warehouses (EDW, ODS, Data Mart) and core components, including ETL processes for data management.
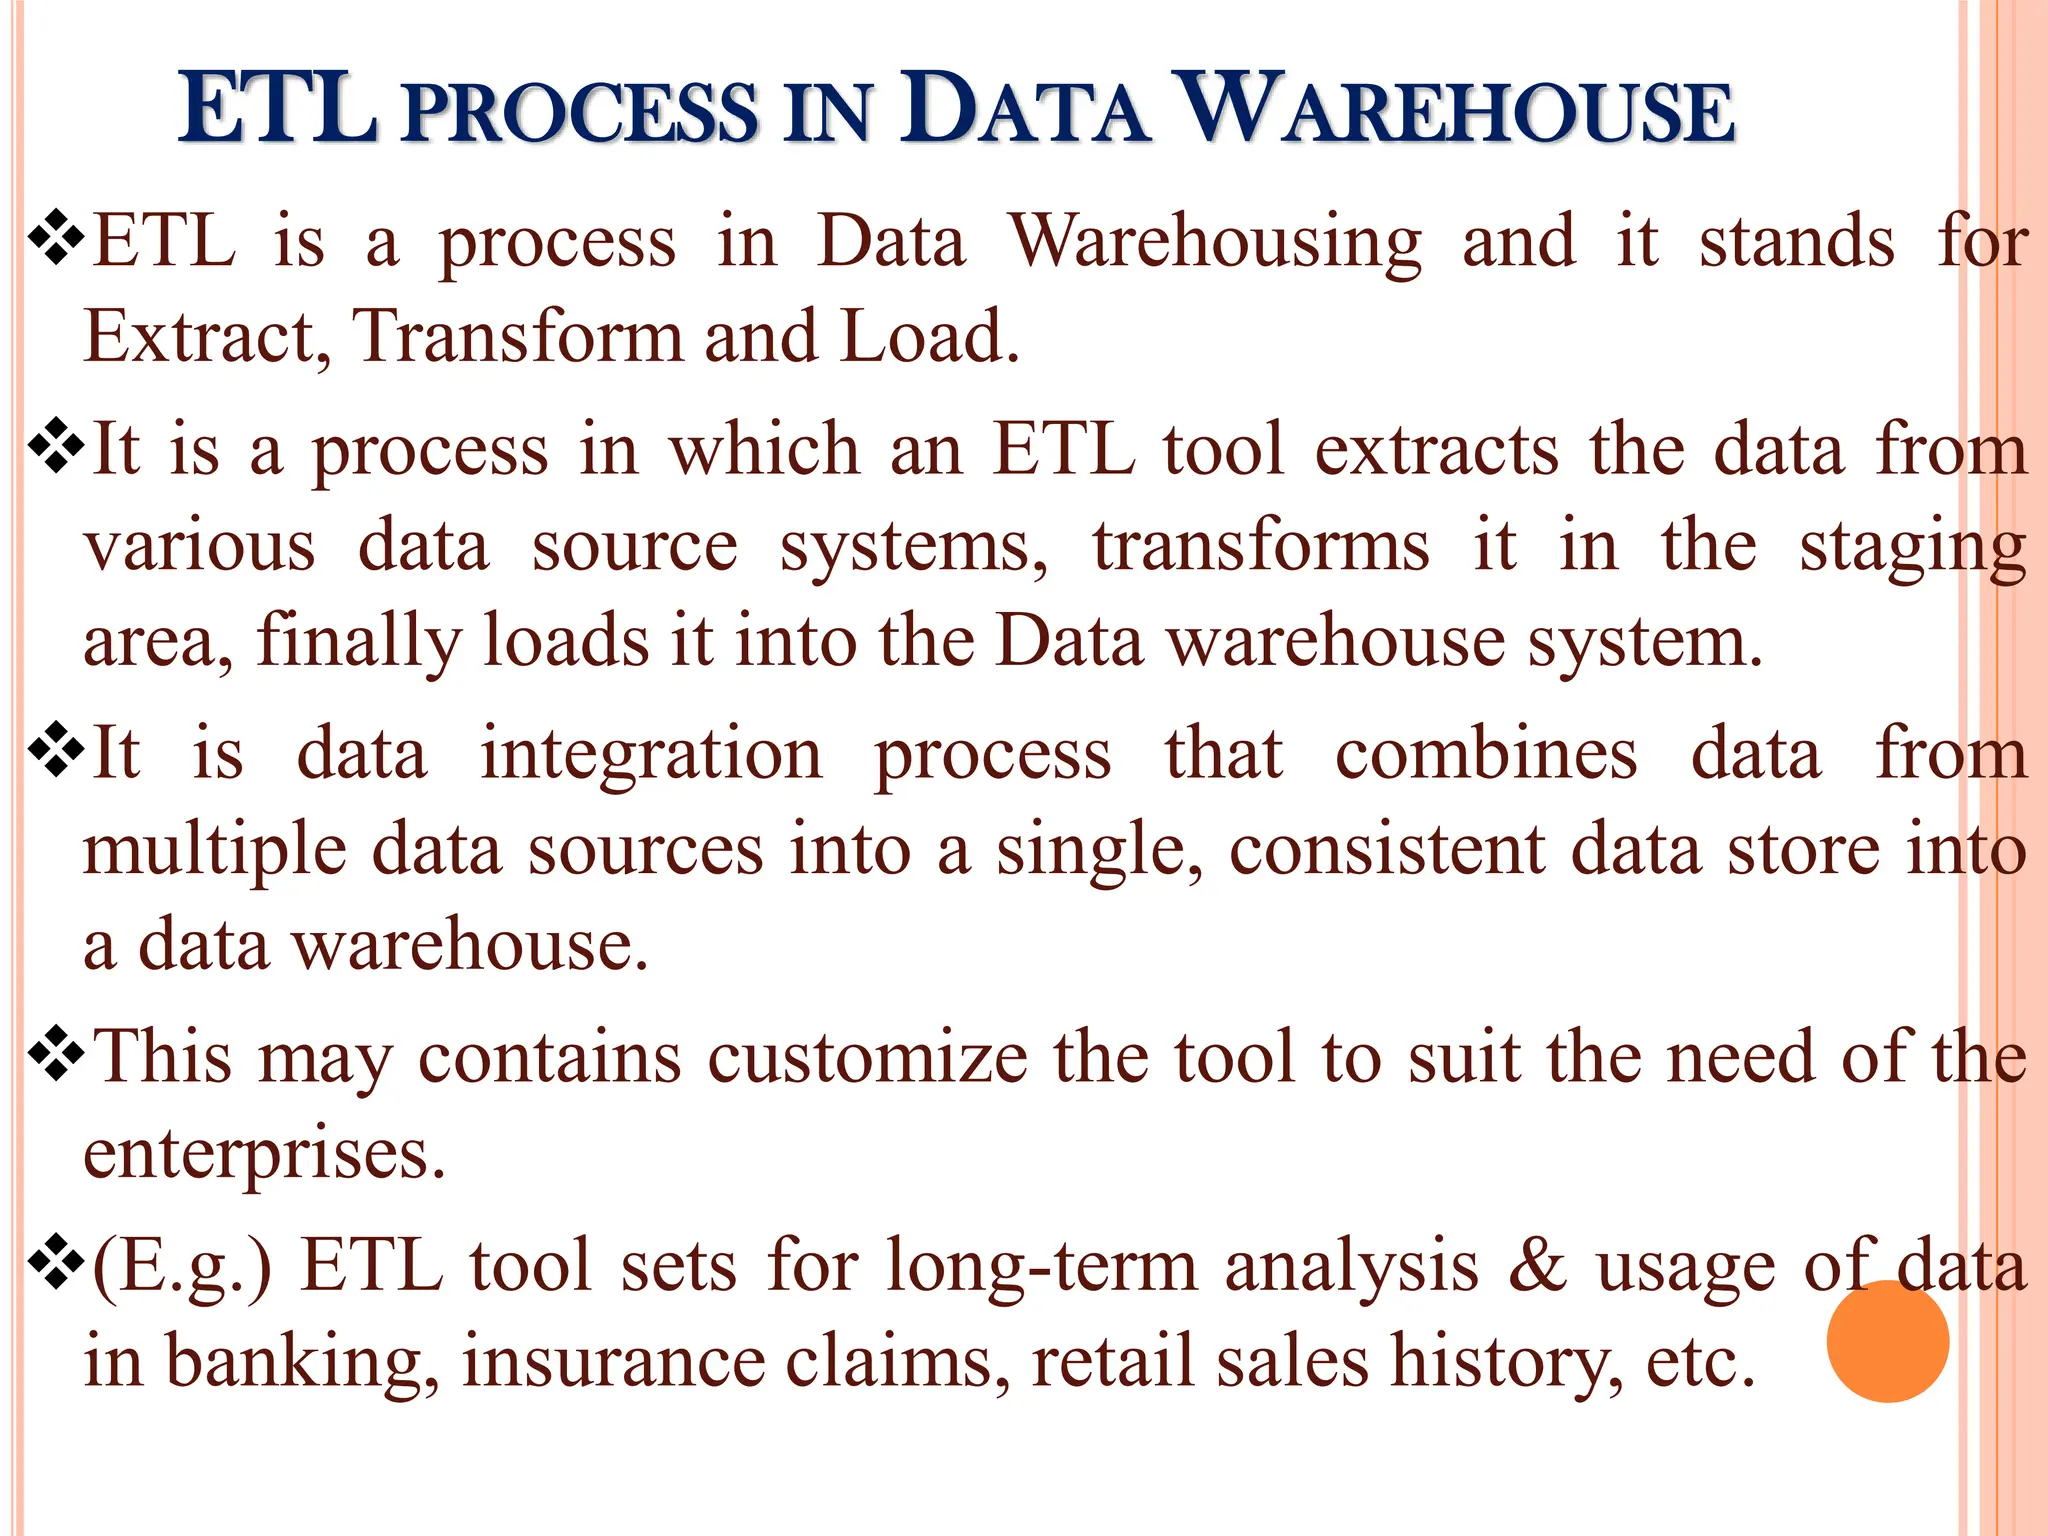
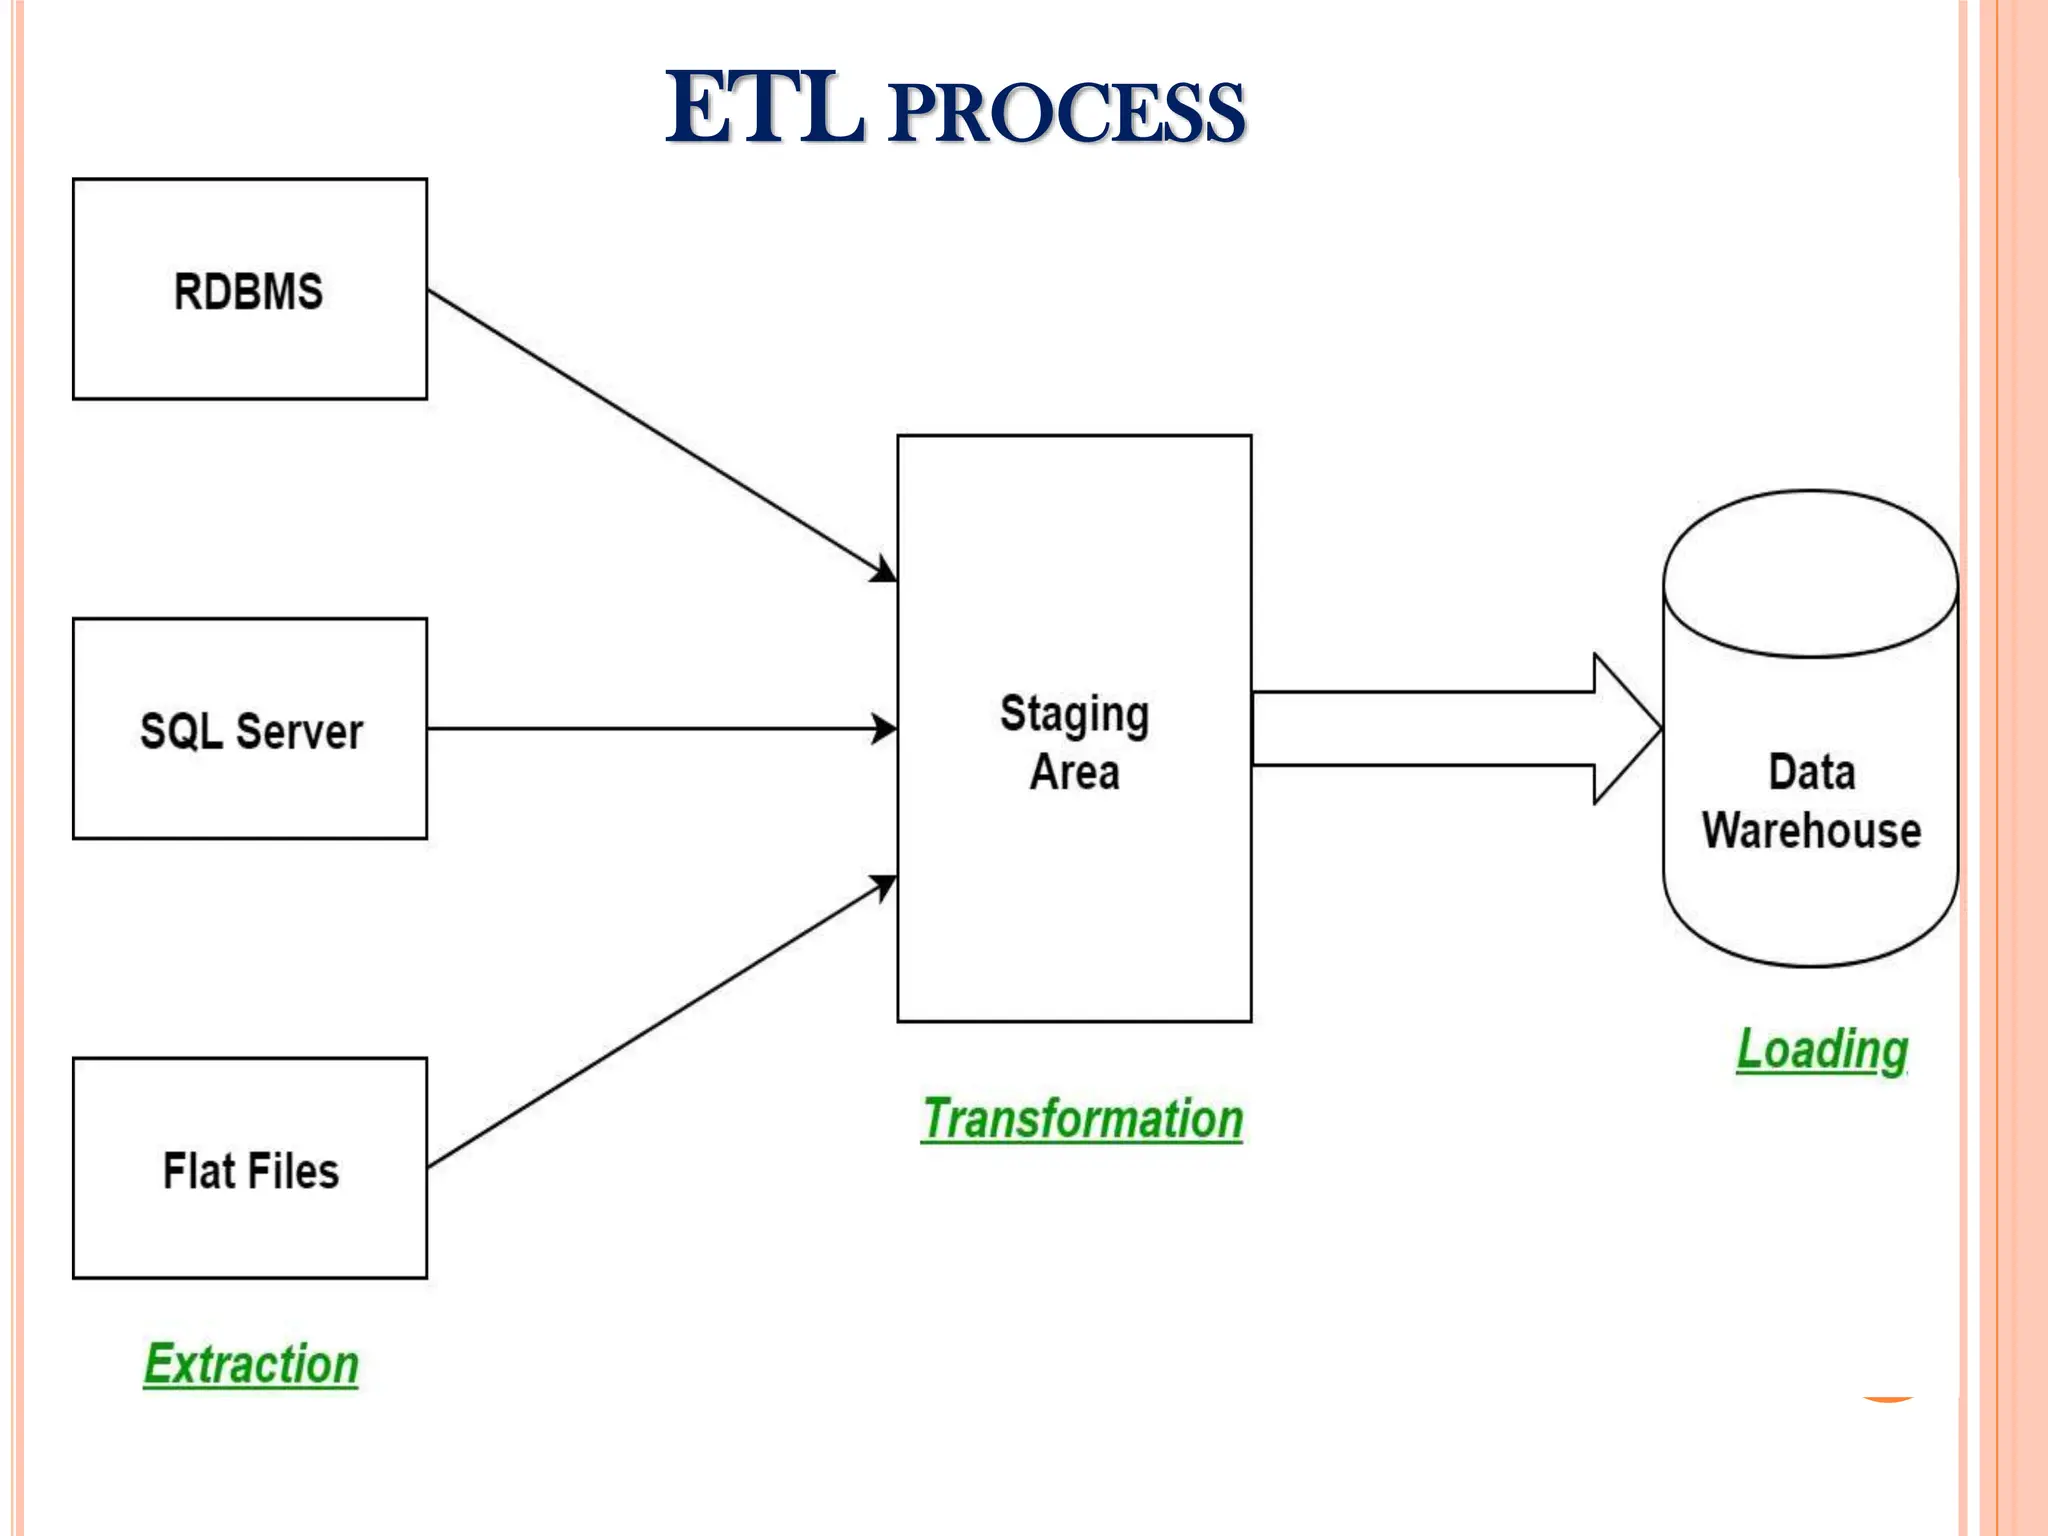
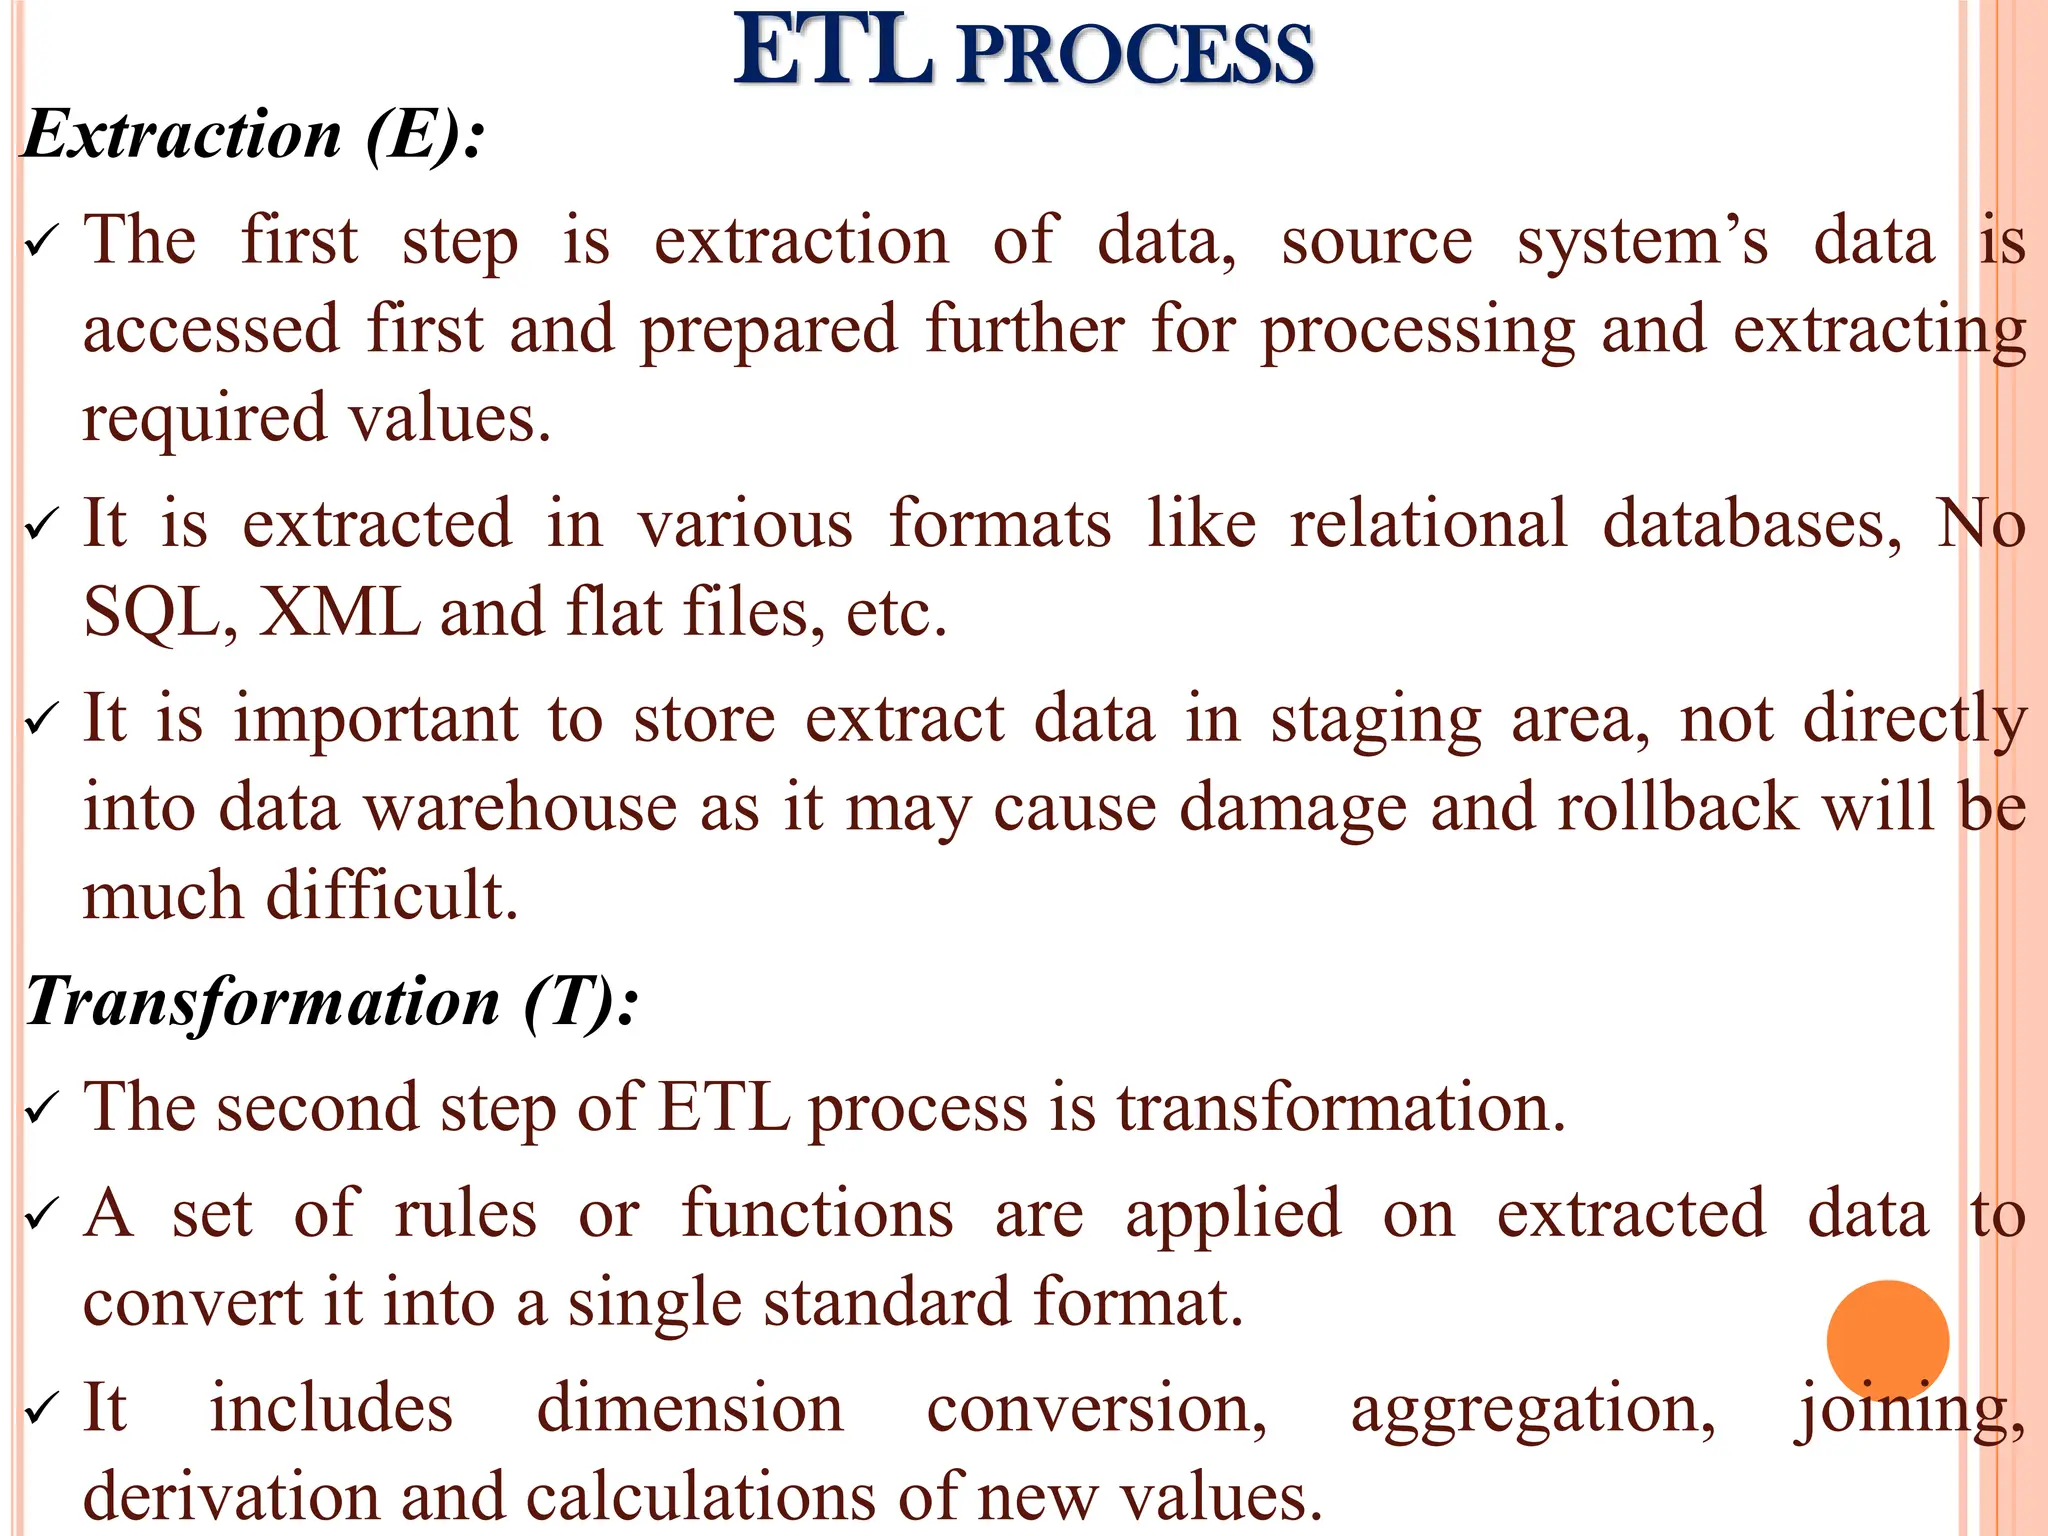
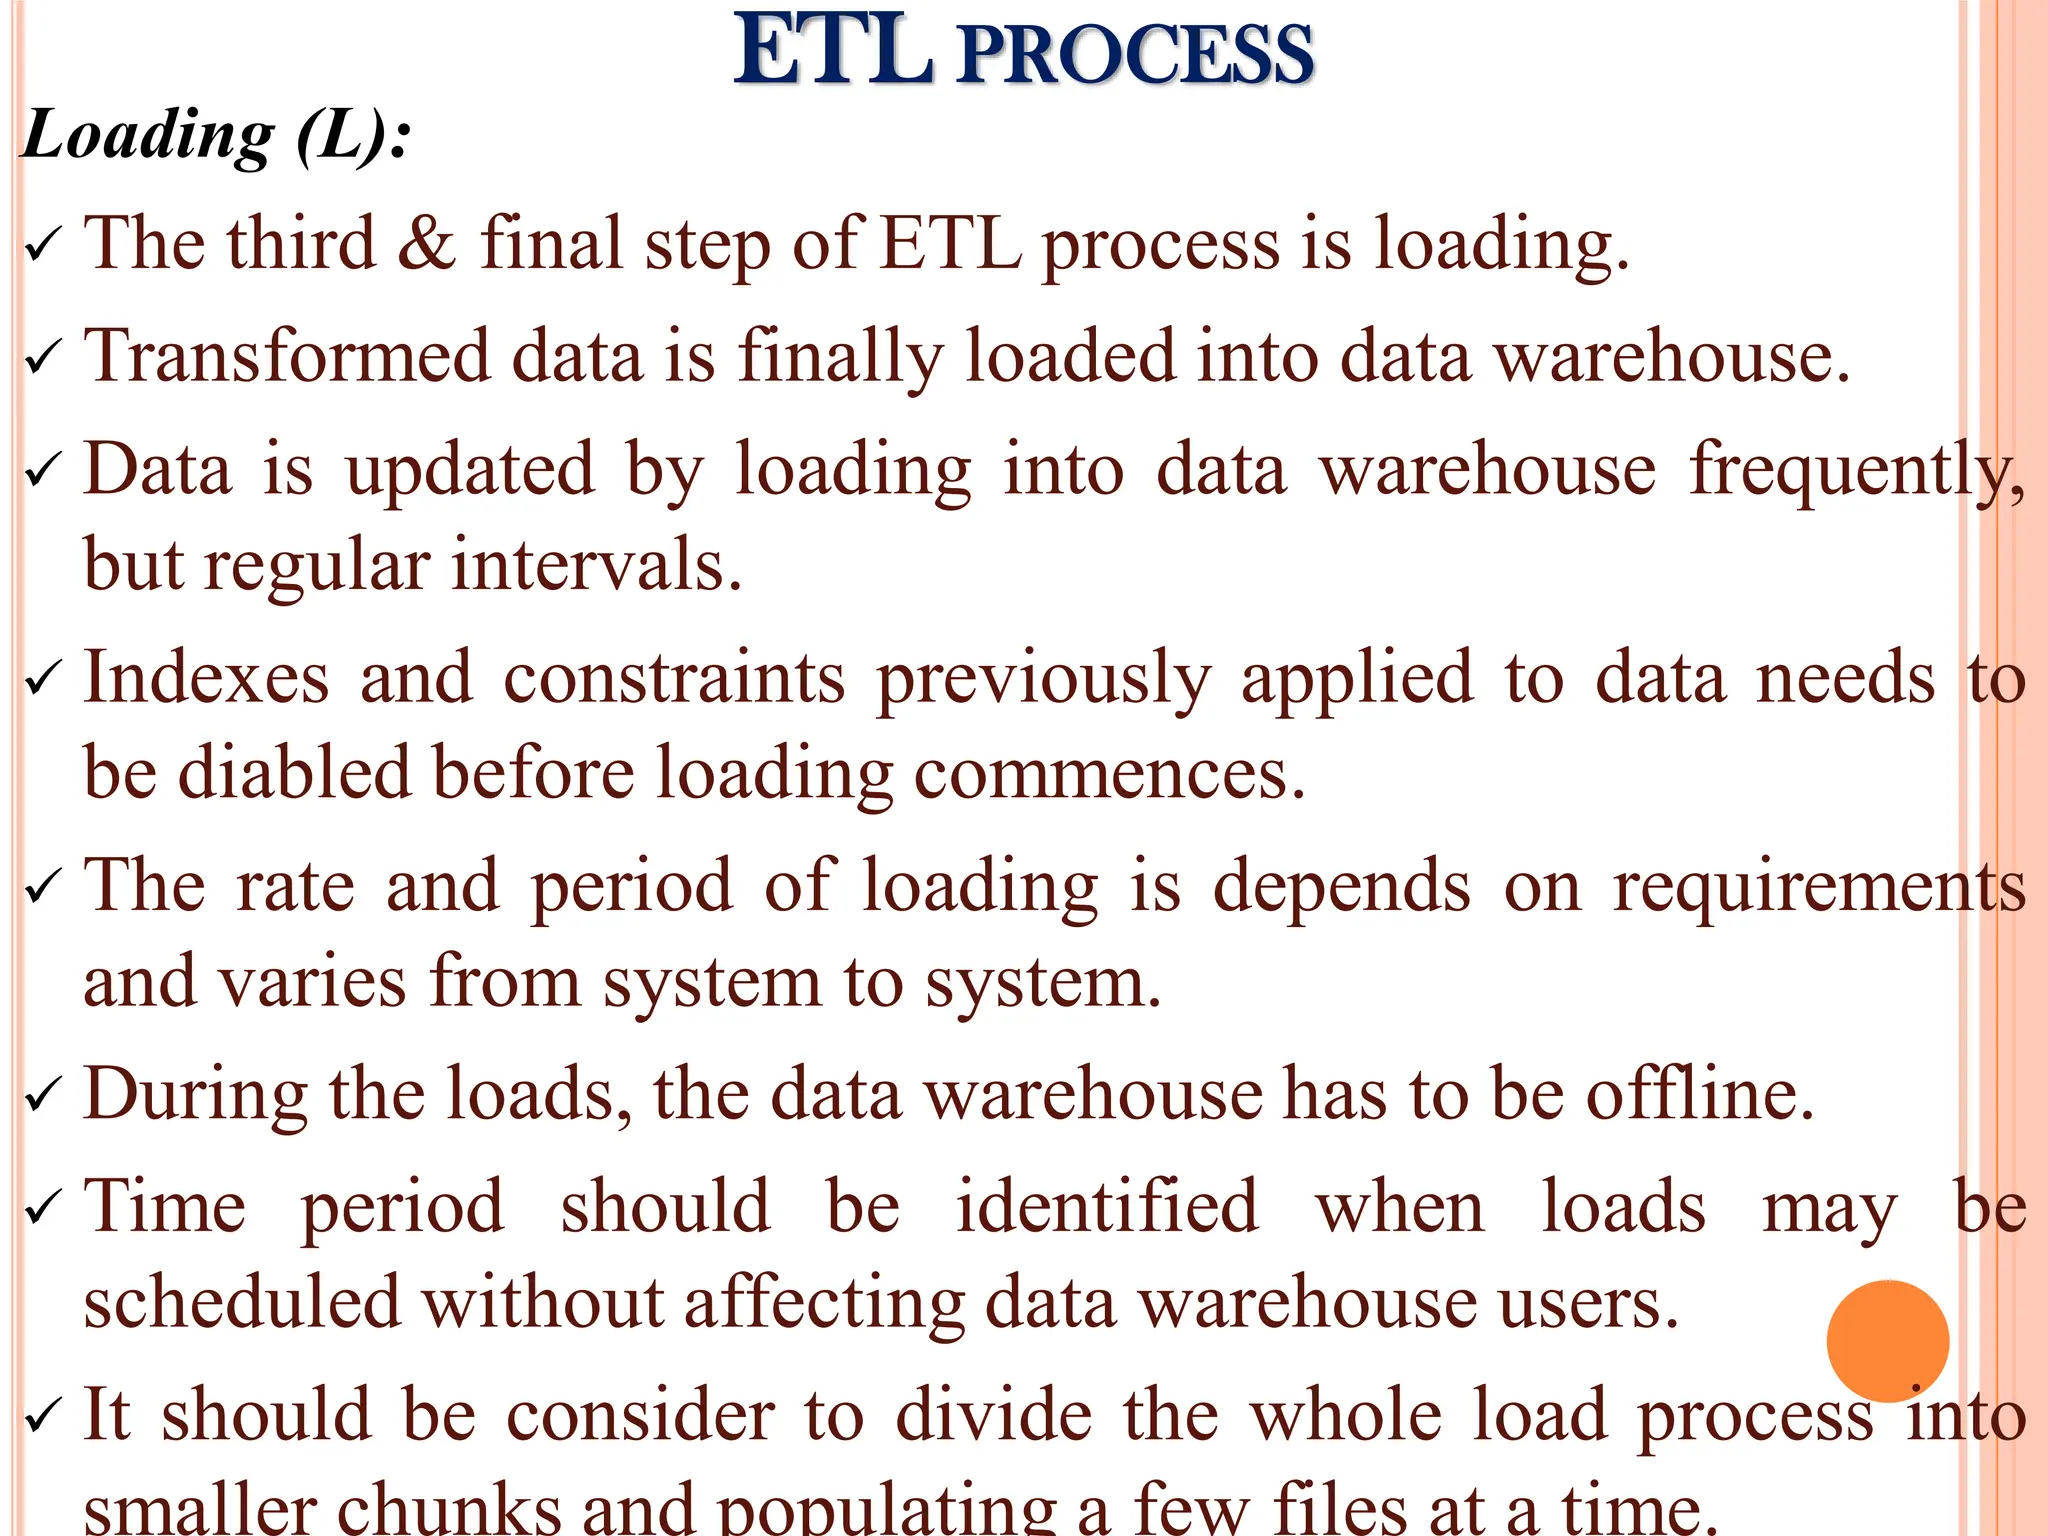
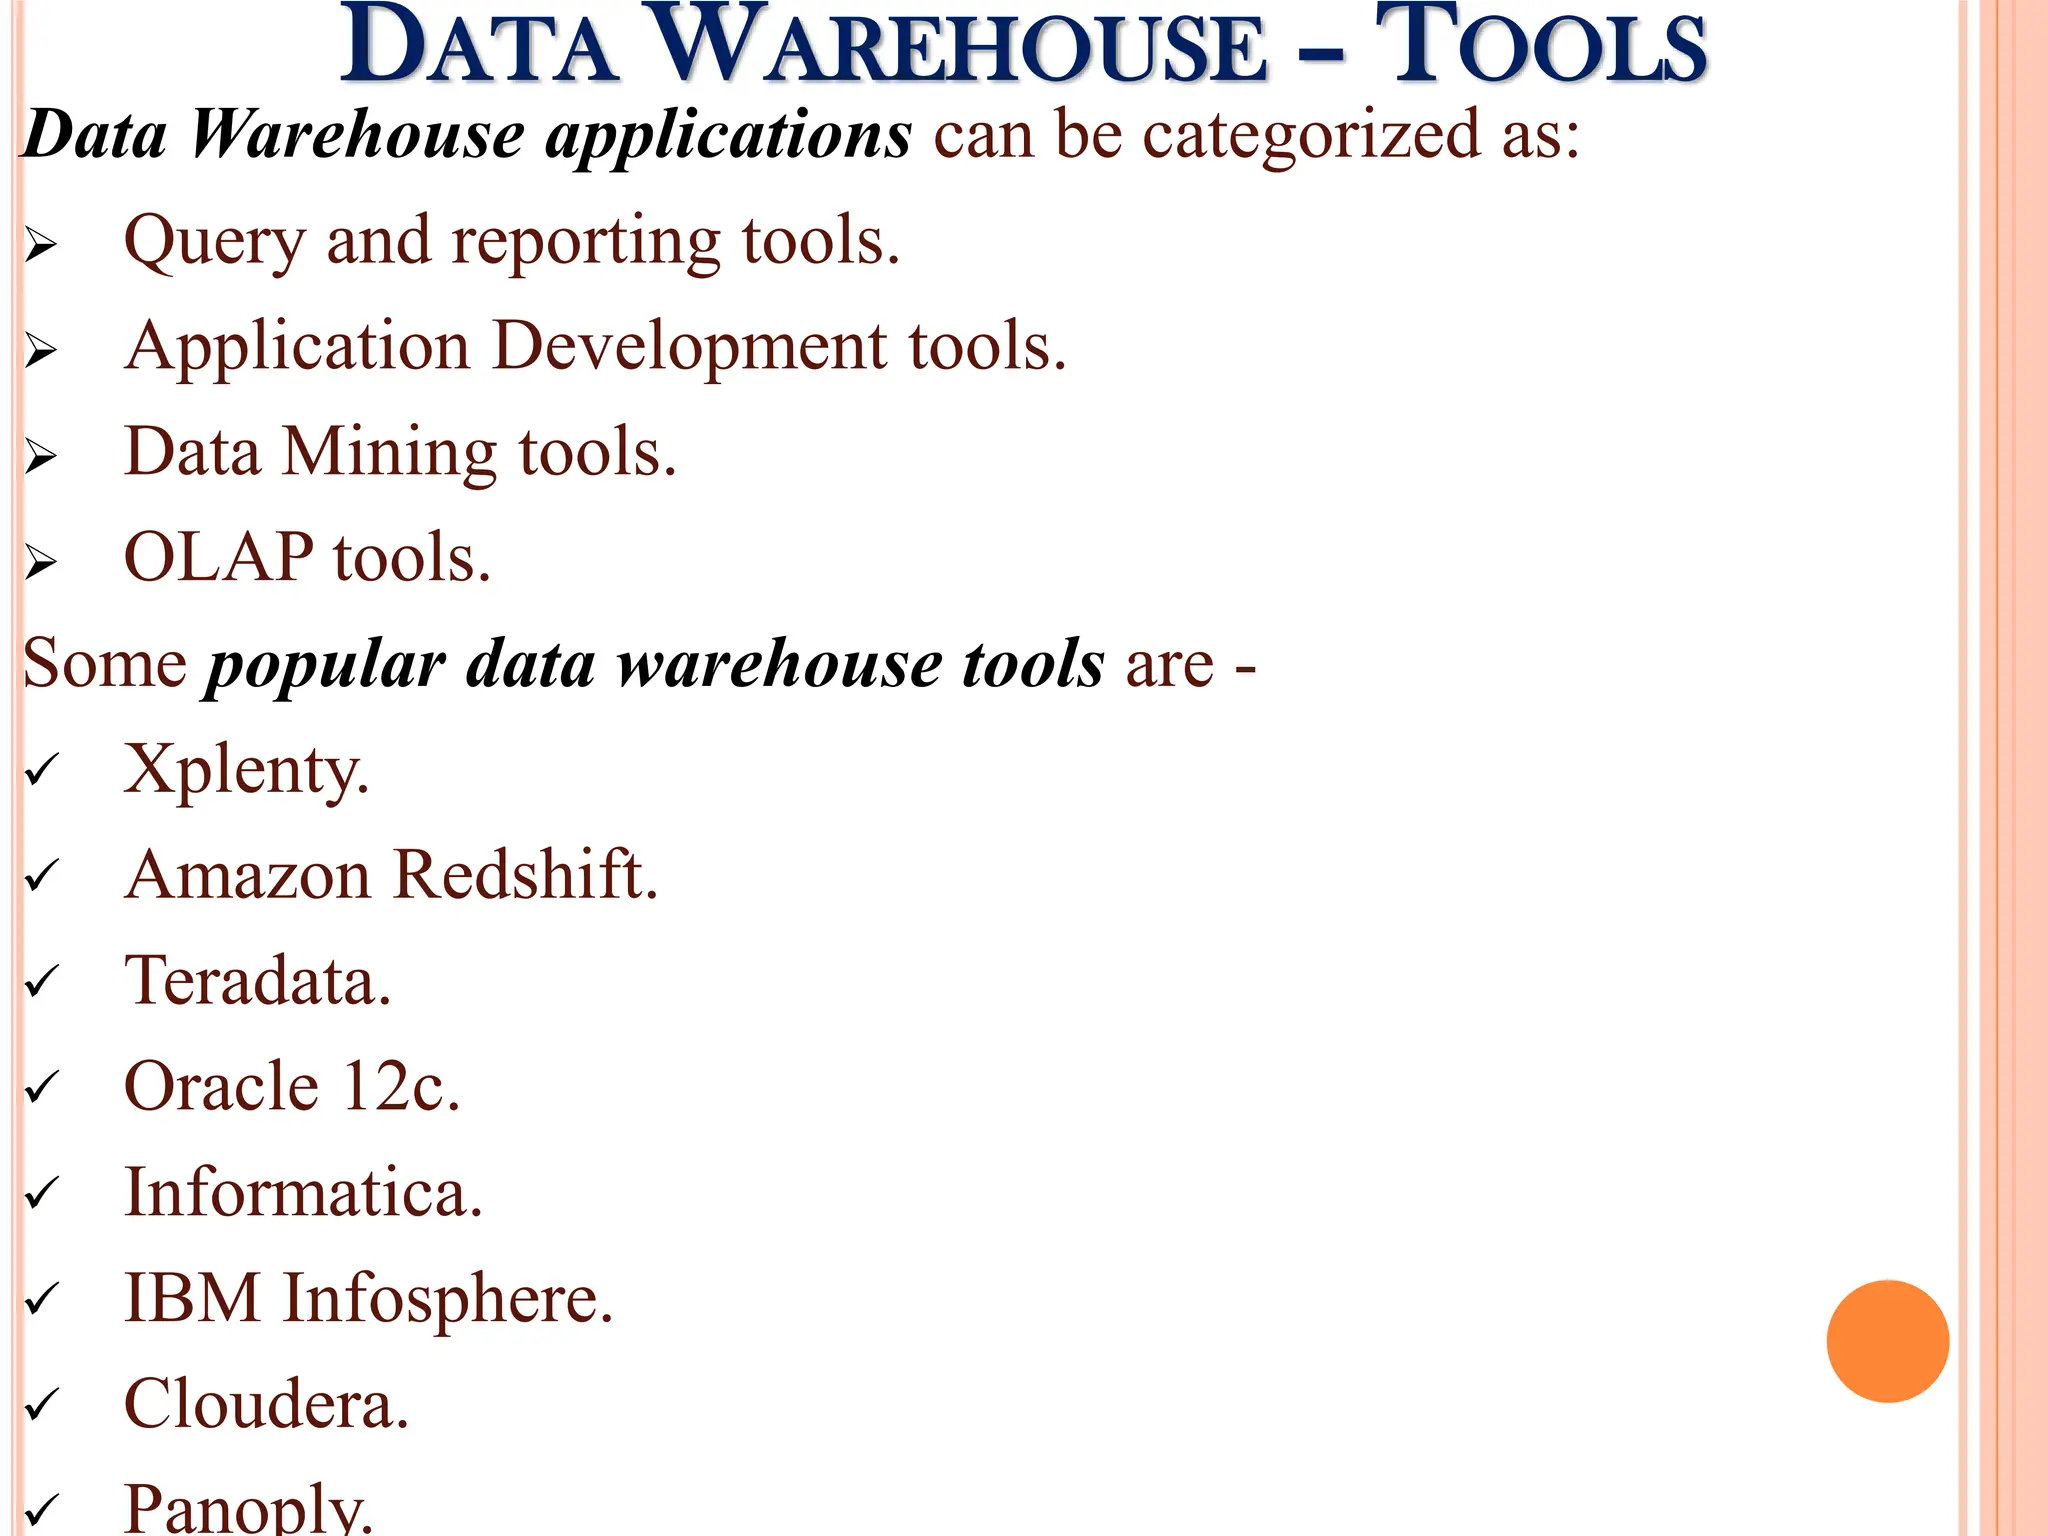
Detailed steps of the ETL process: extraction, transformation, and loading data into warehouses, alongside popular tools.
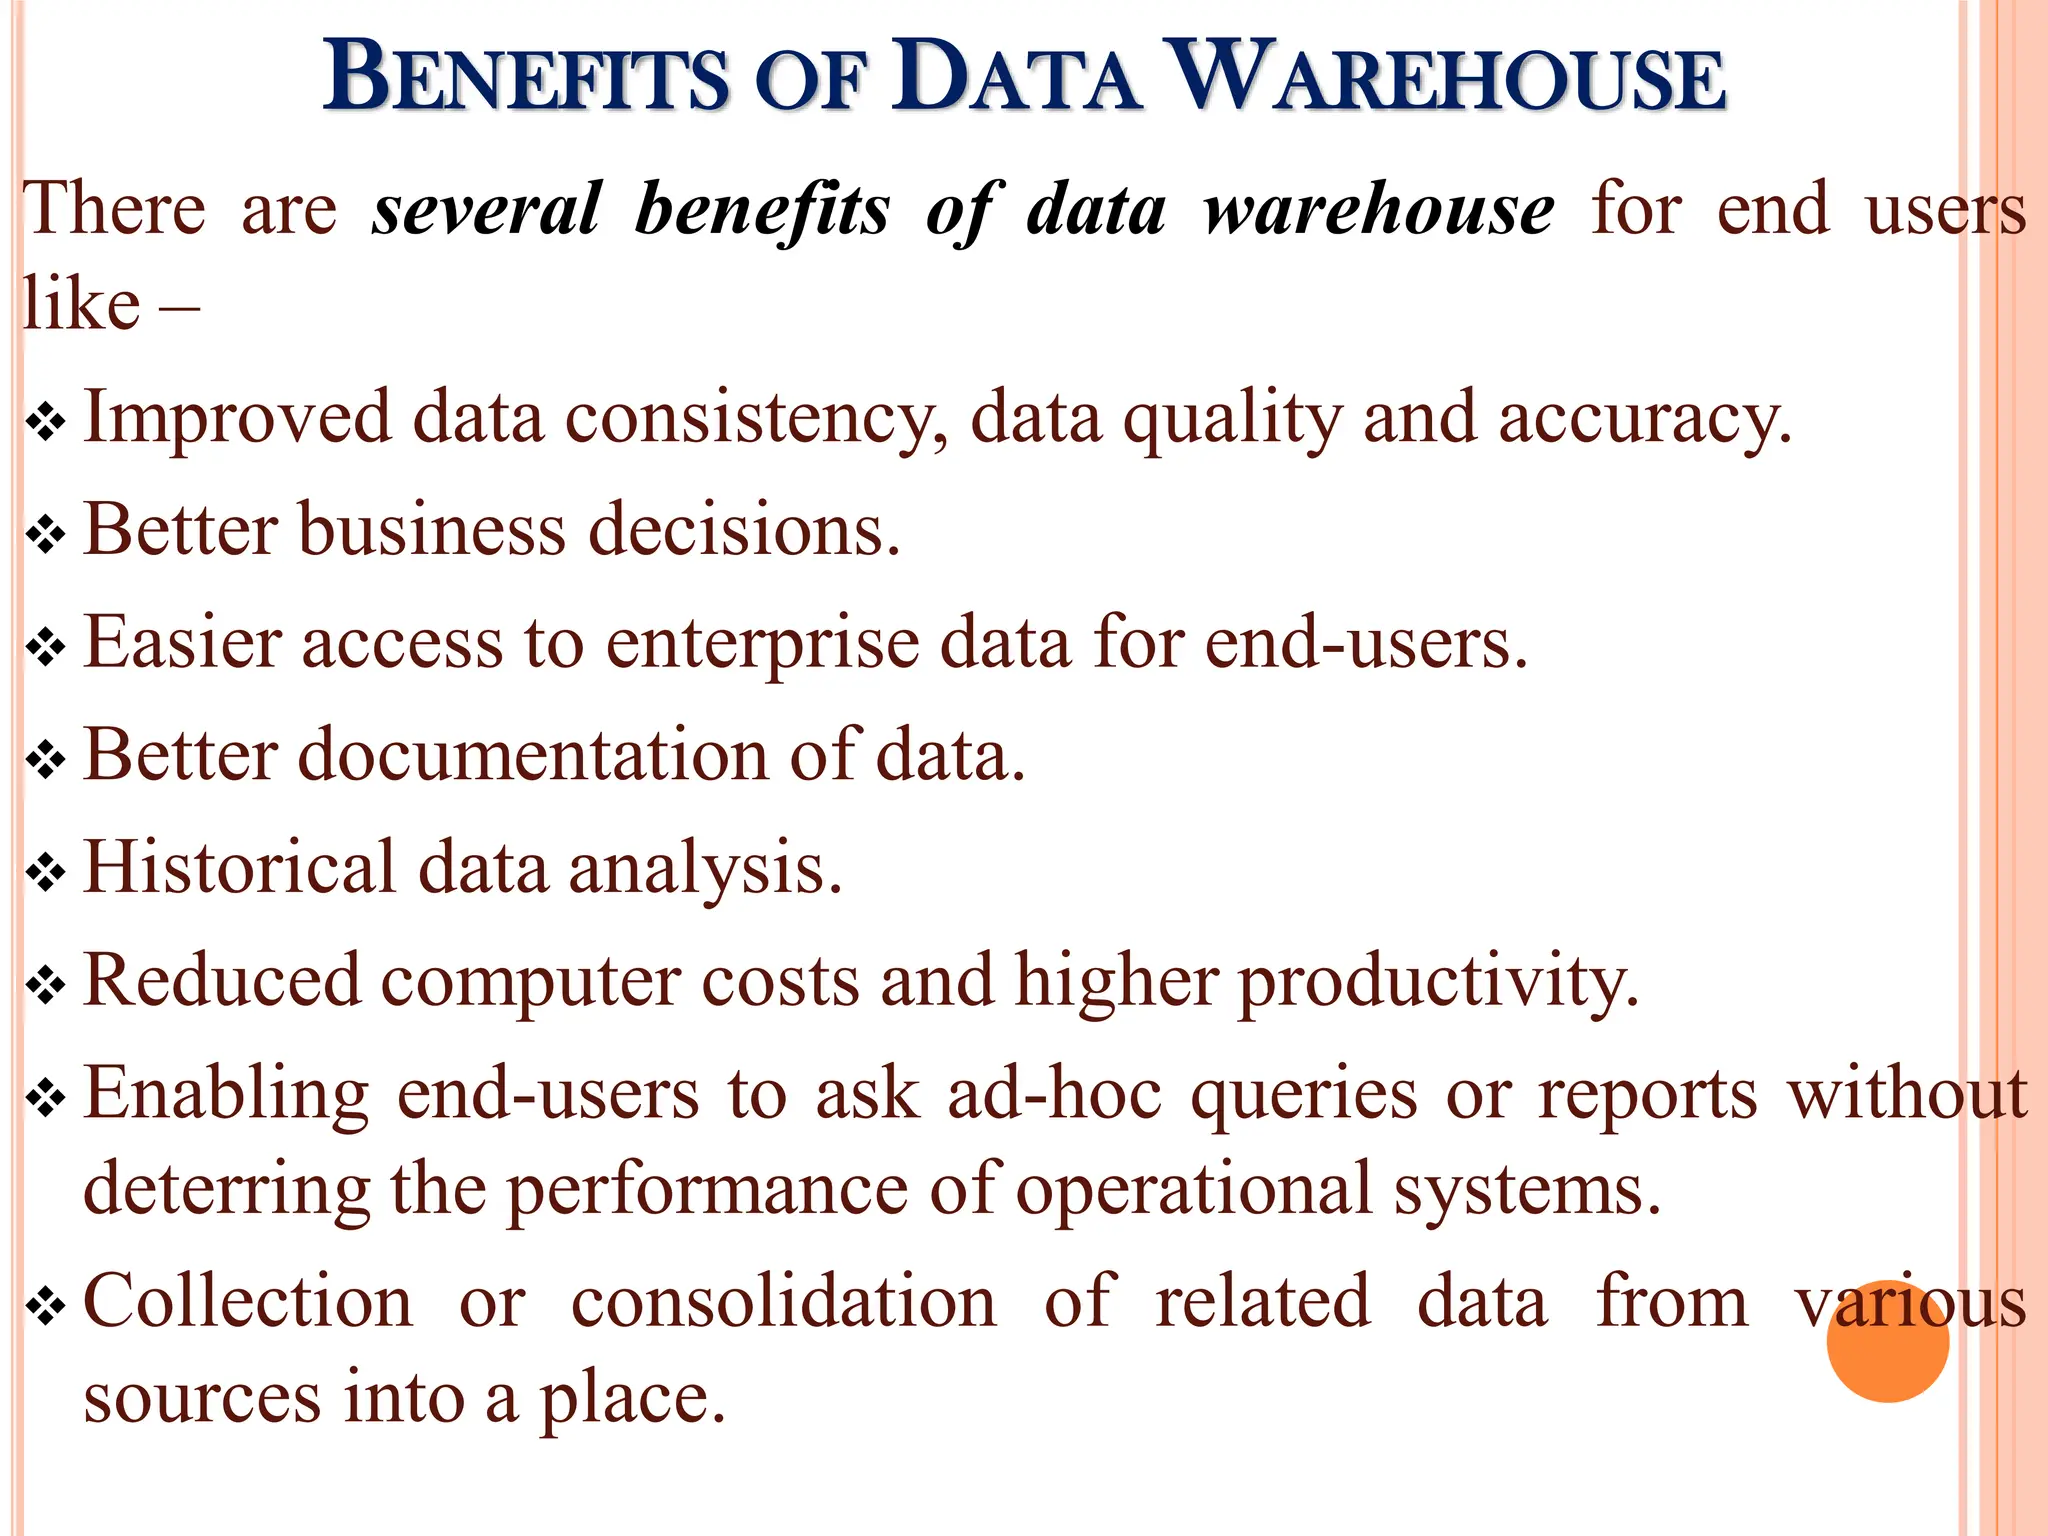
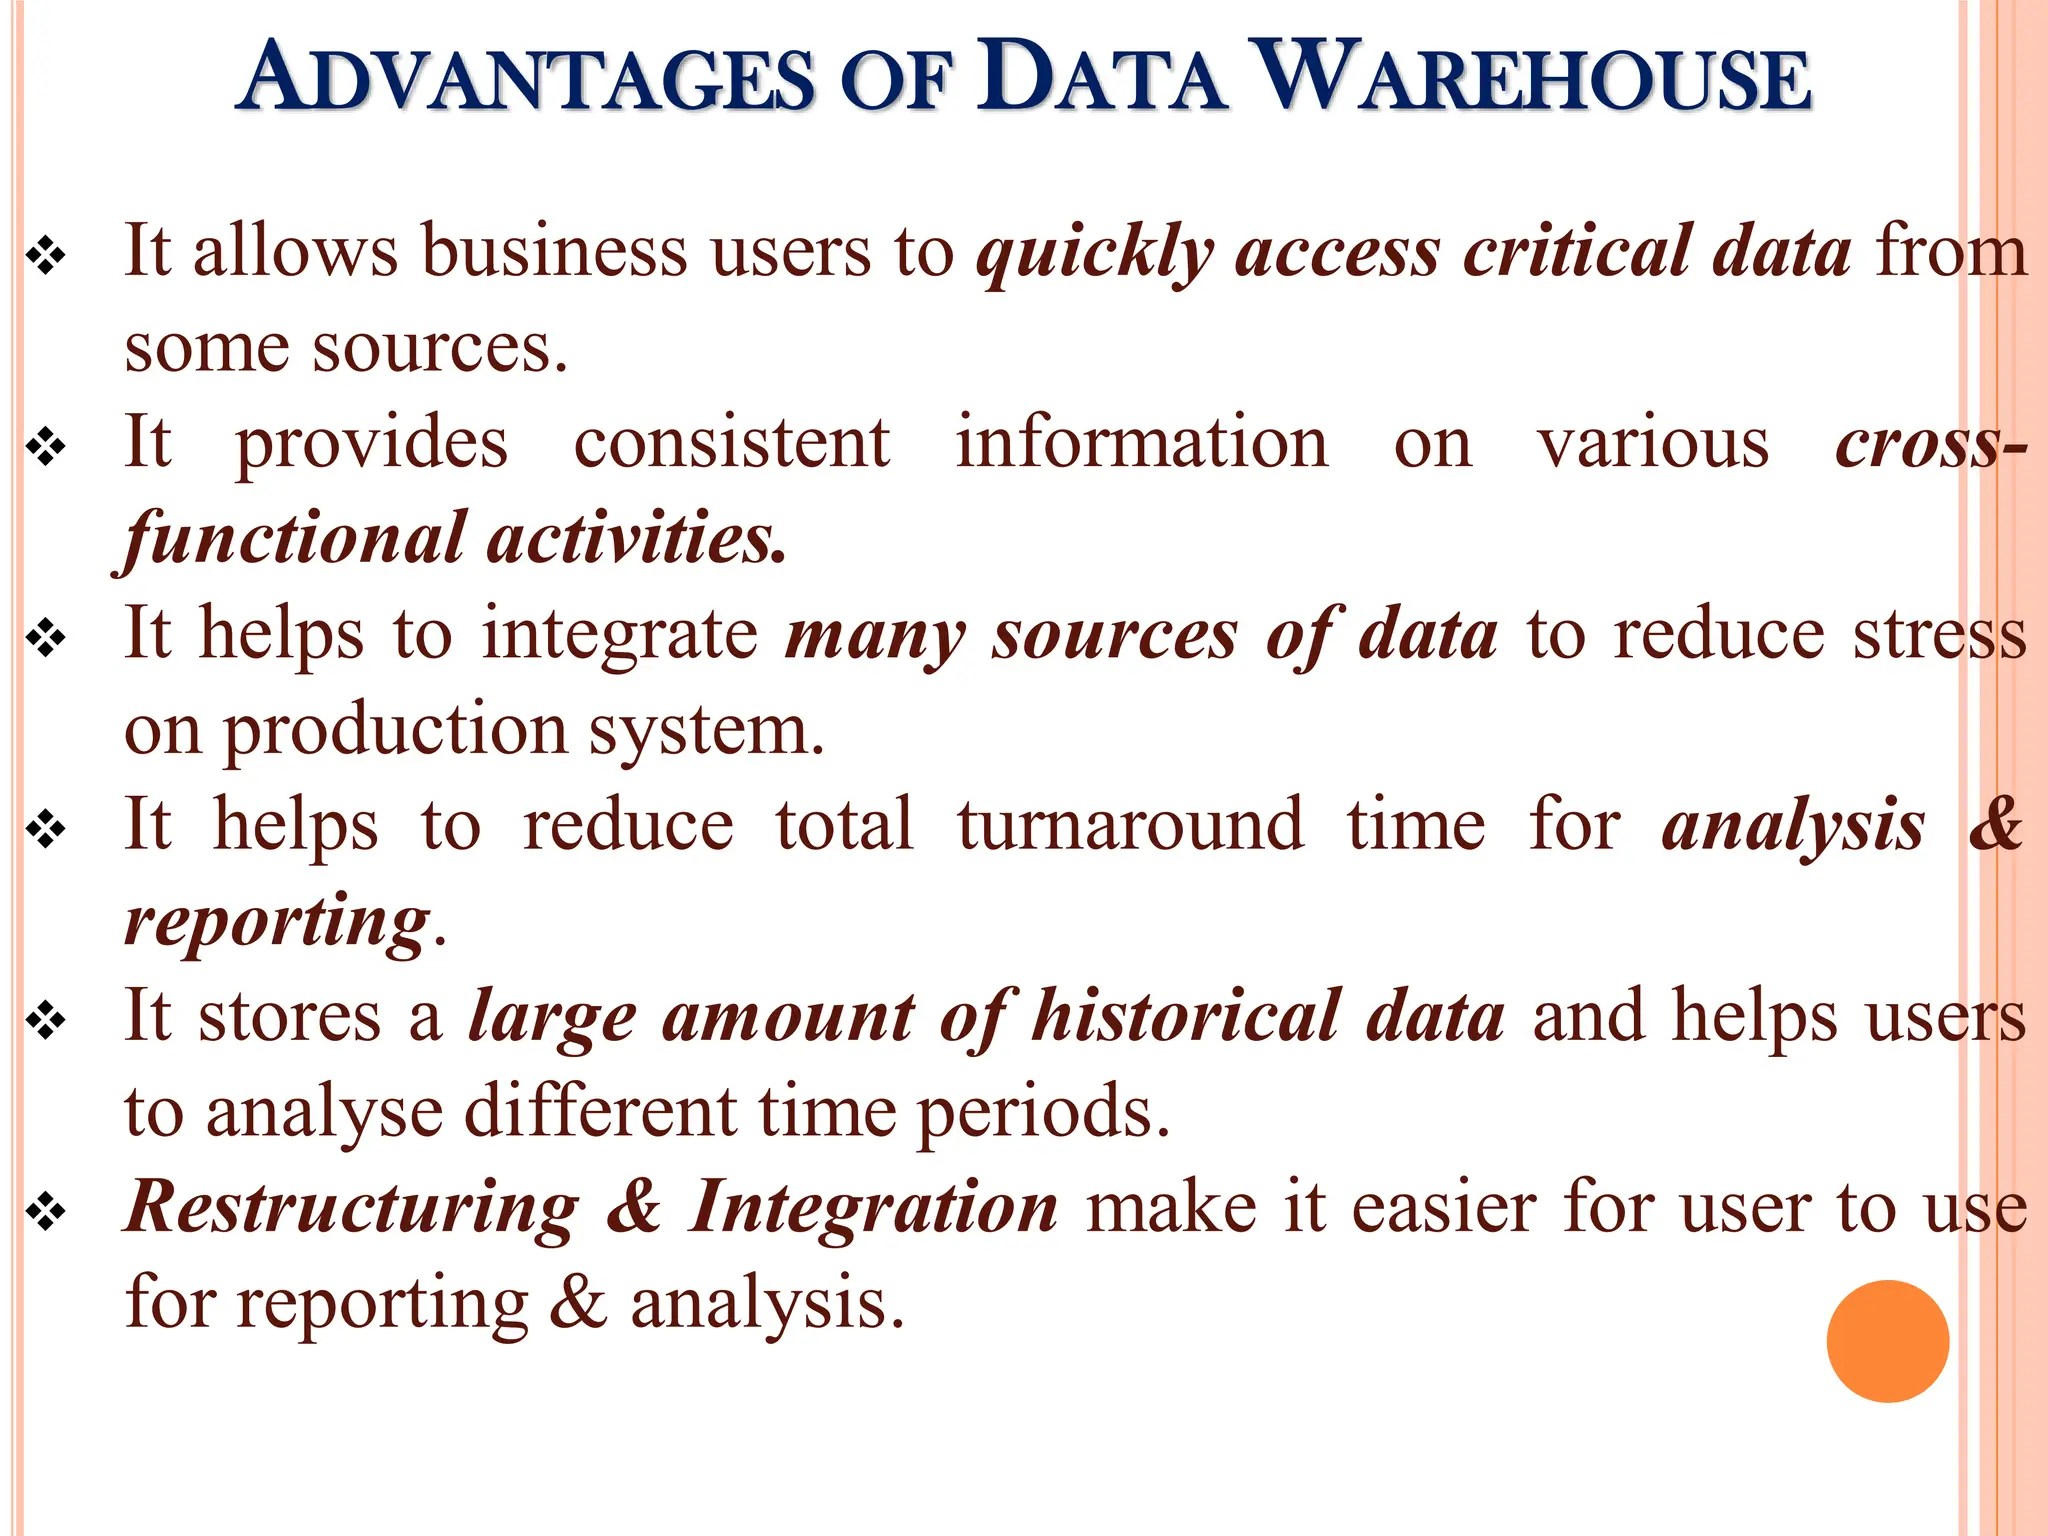
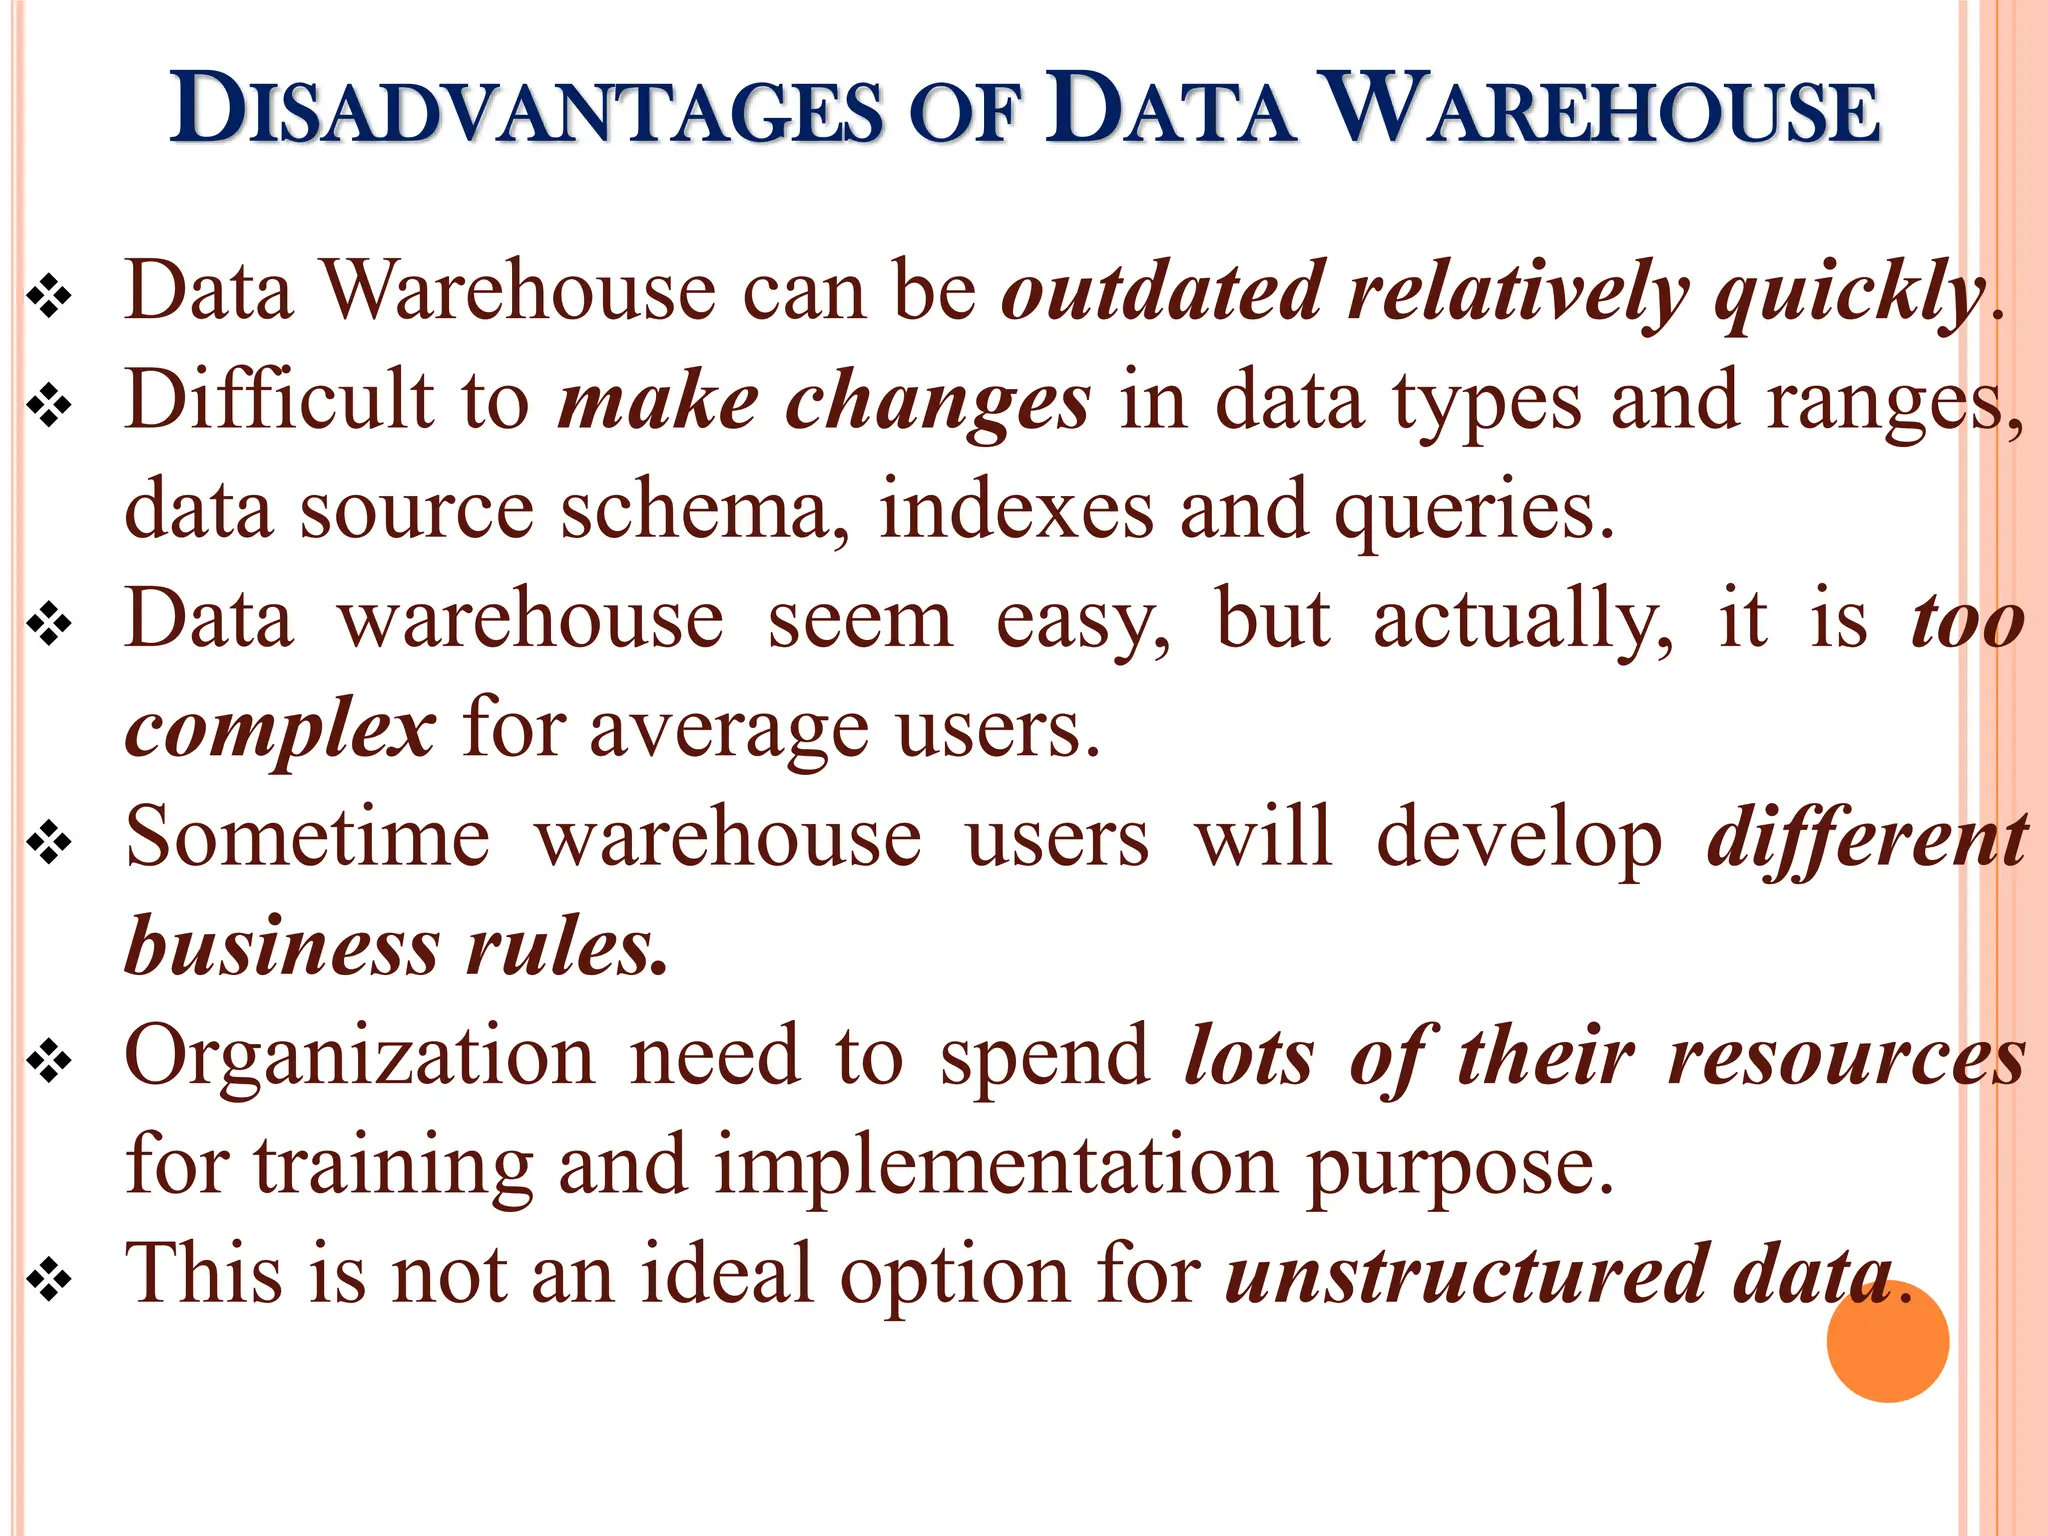
Benefits for end-users including consistency and improved decision-making, but also highlights potential disadvantages.
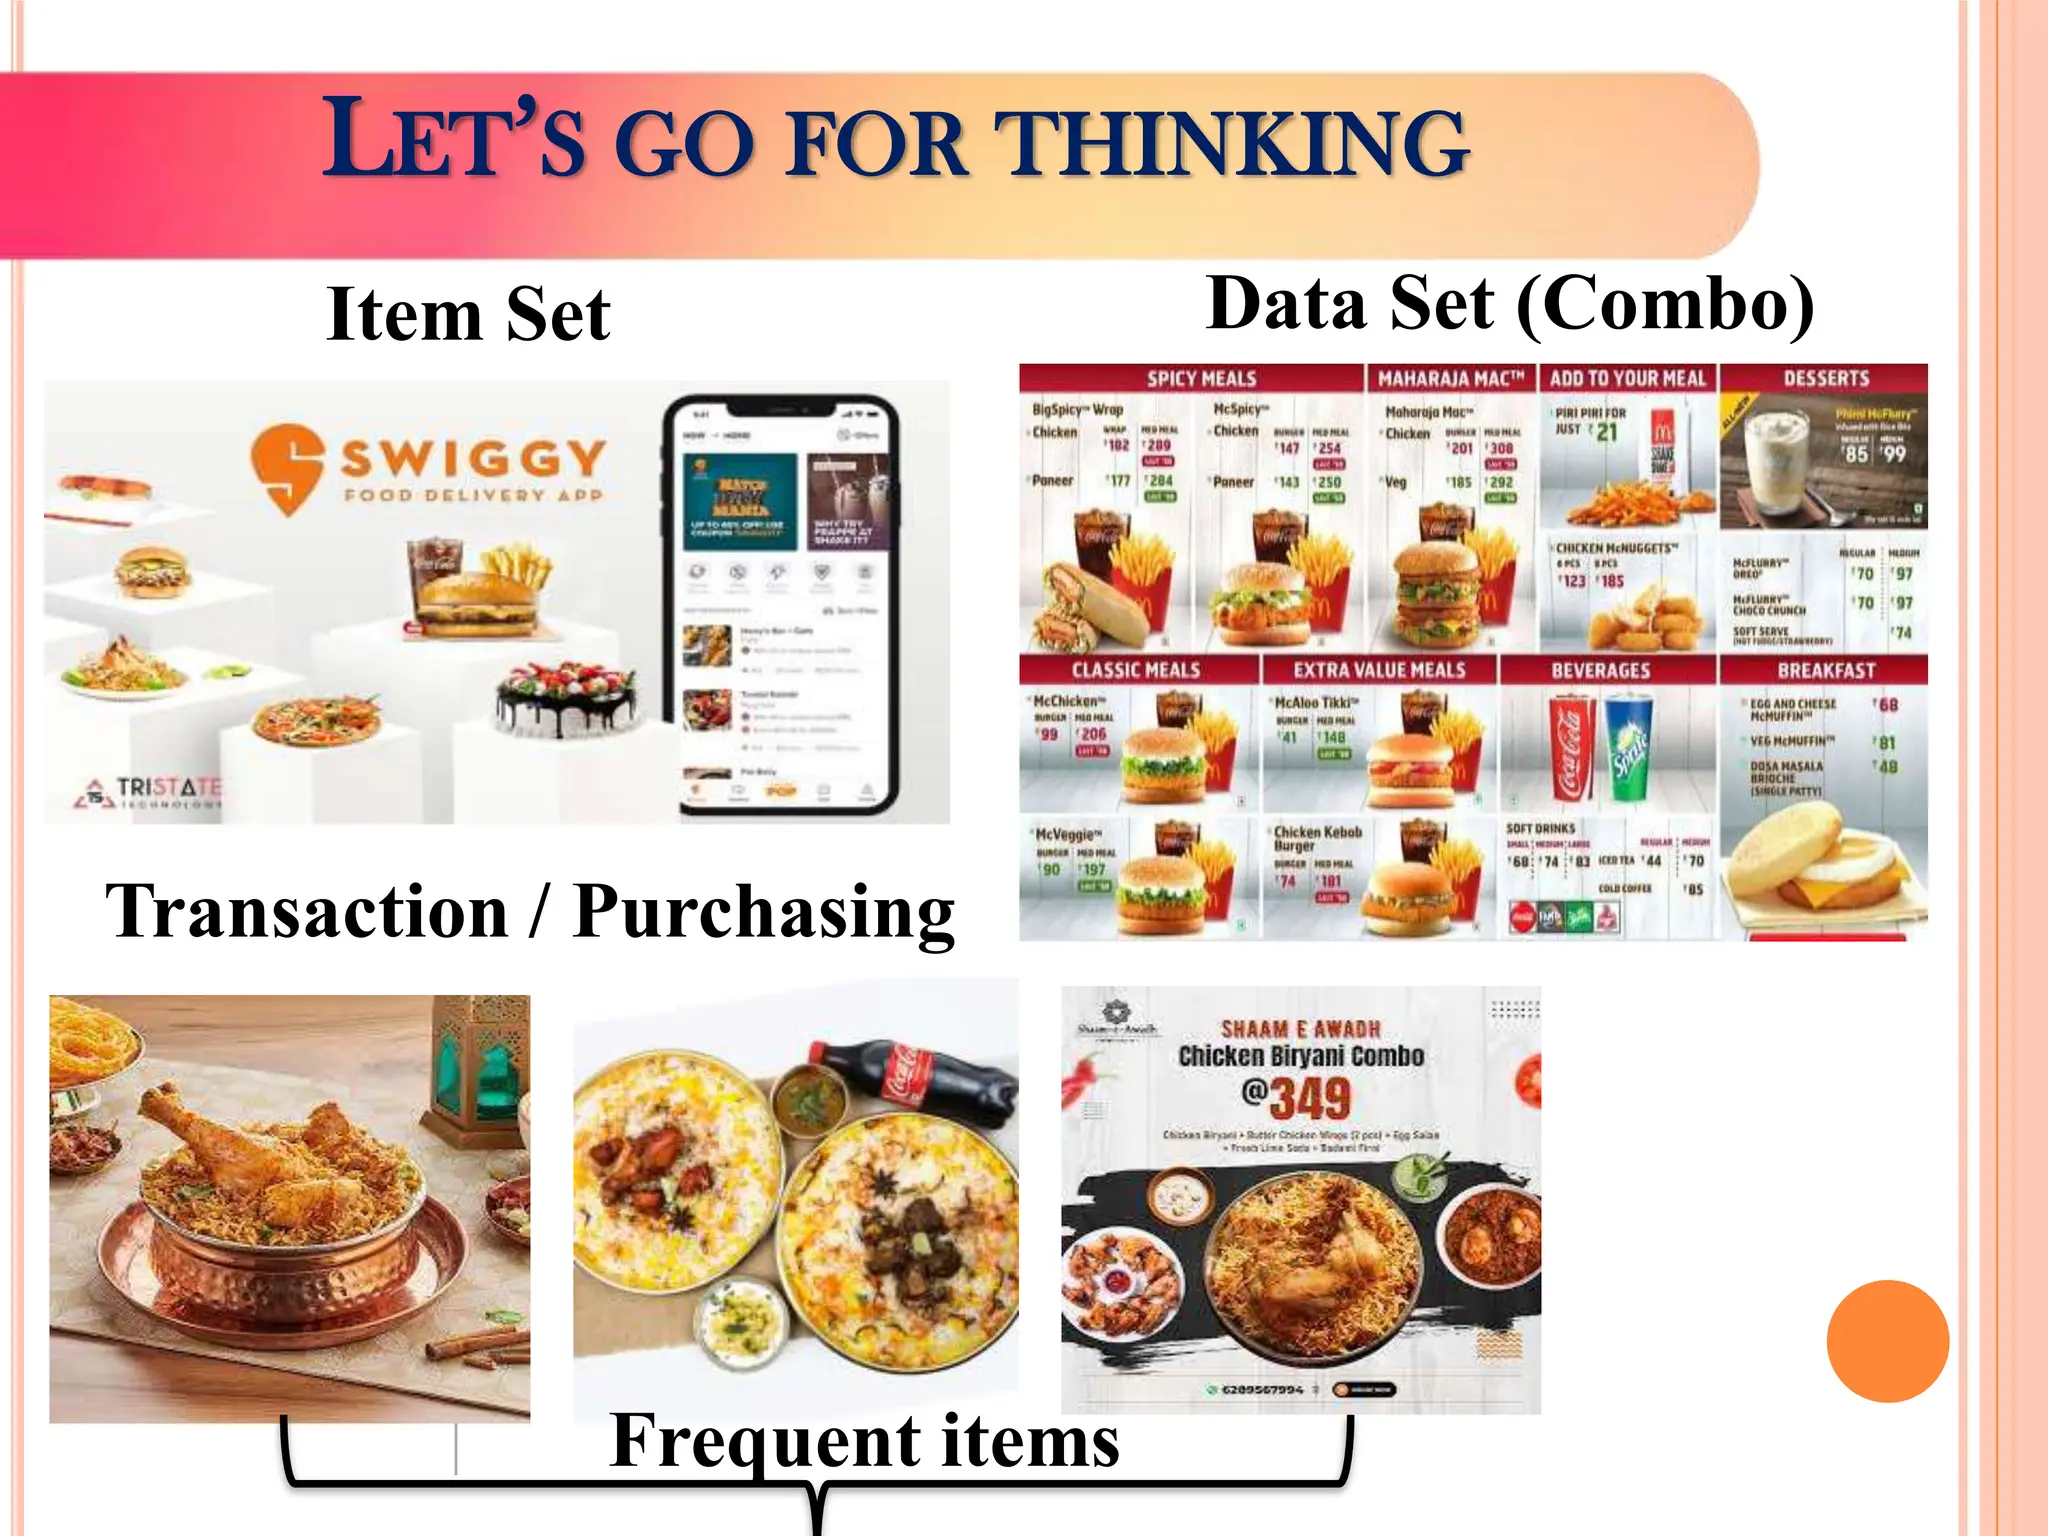
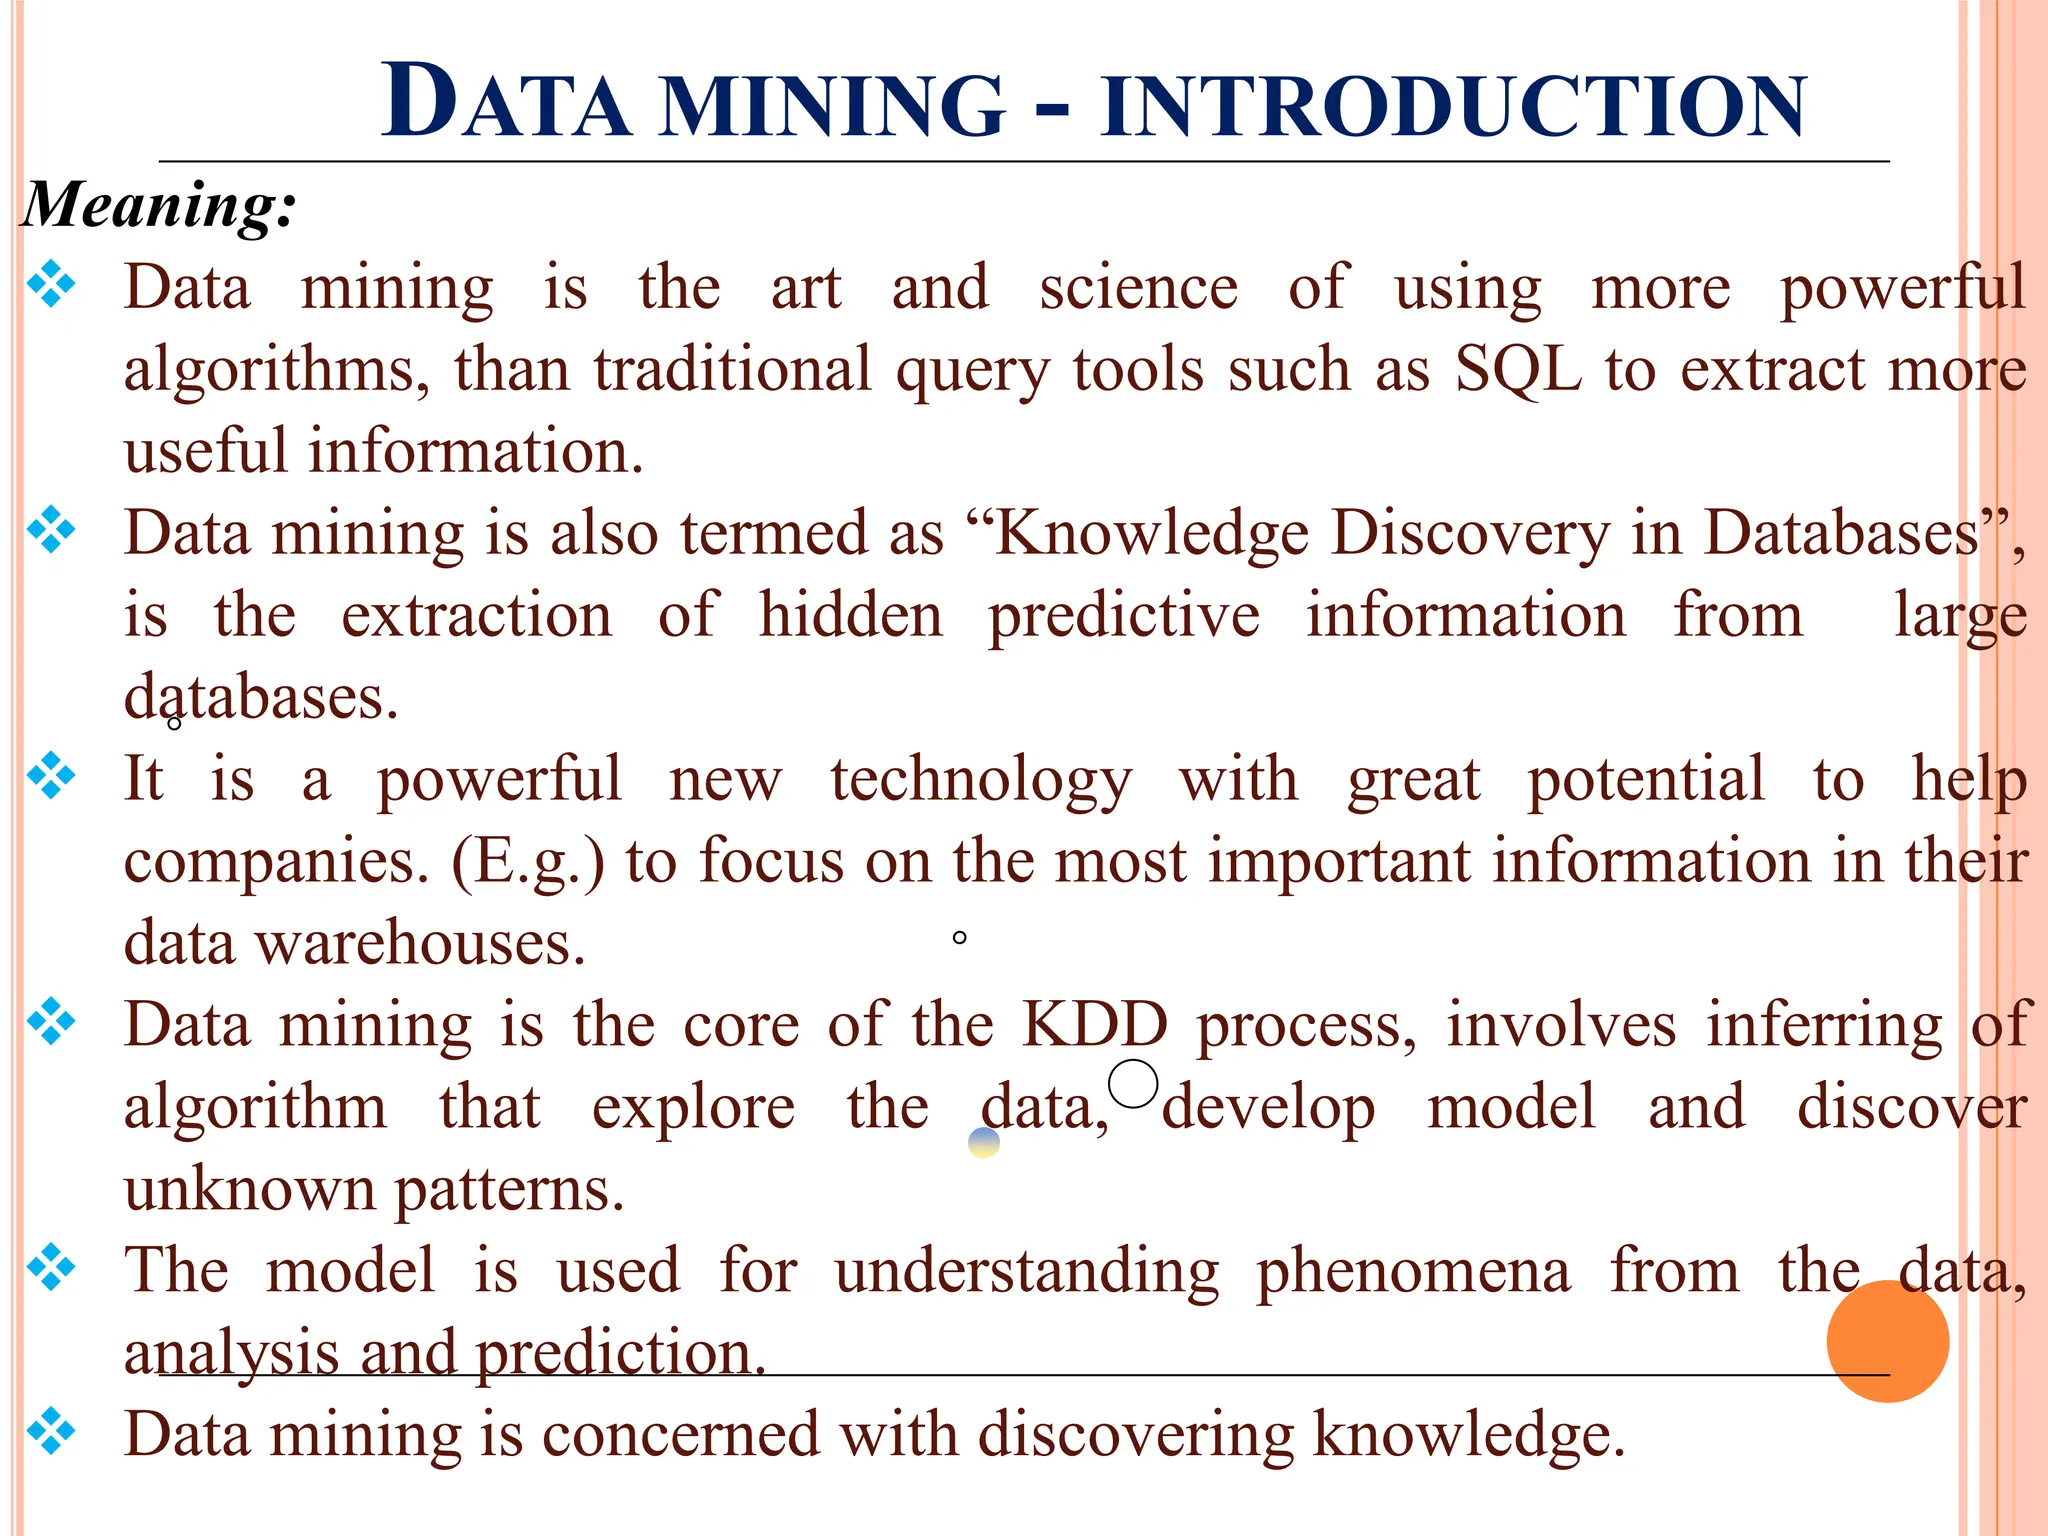
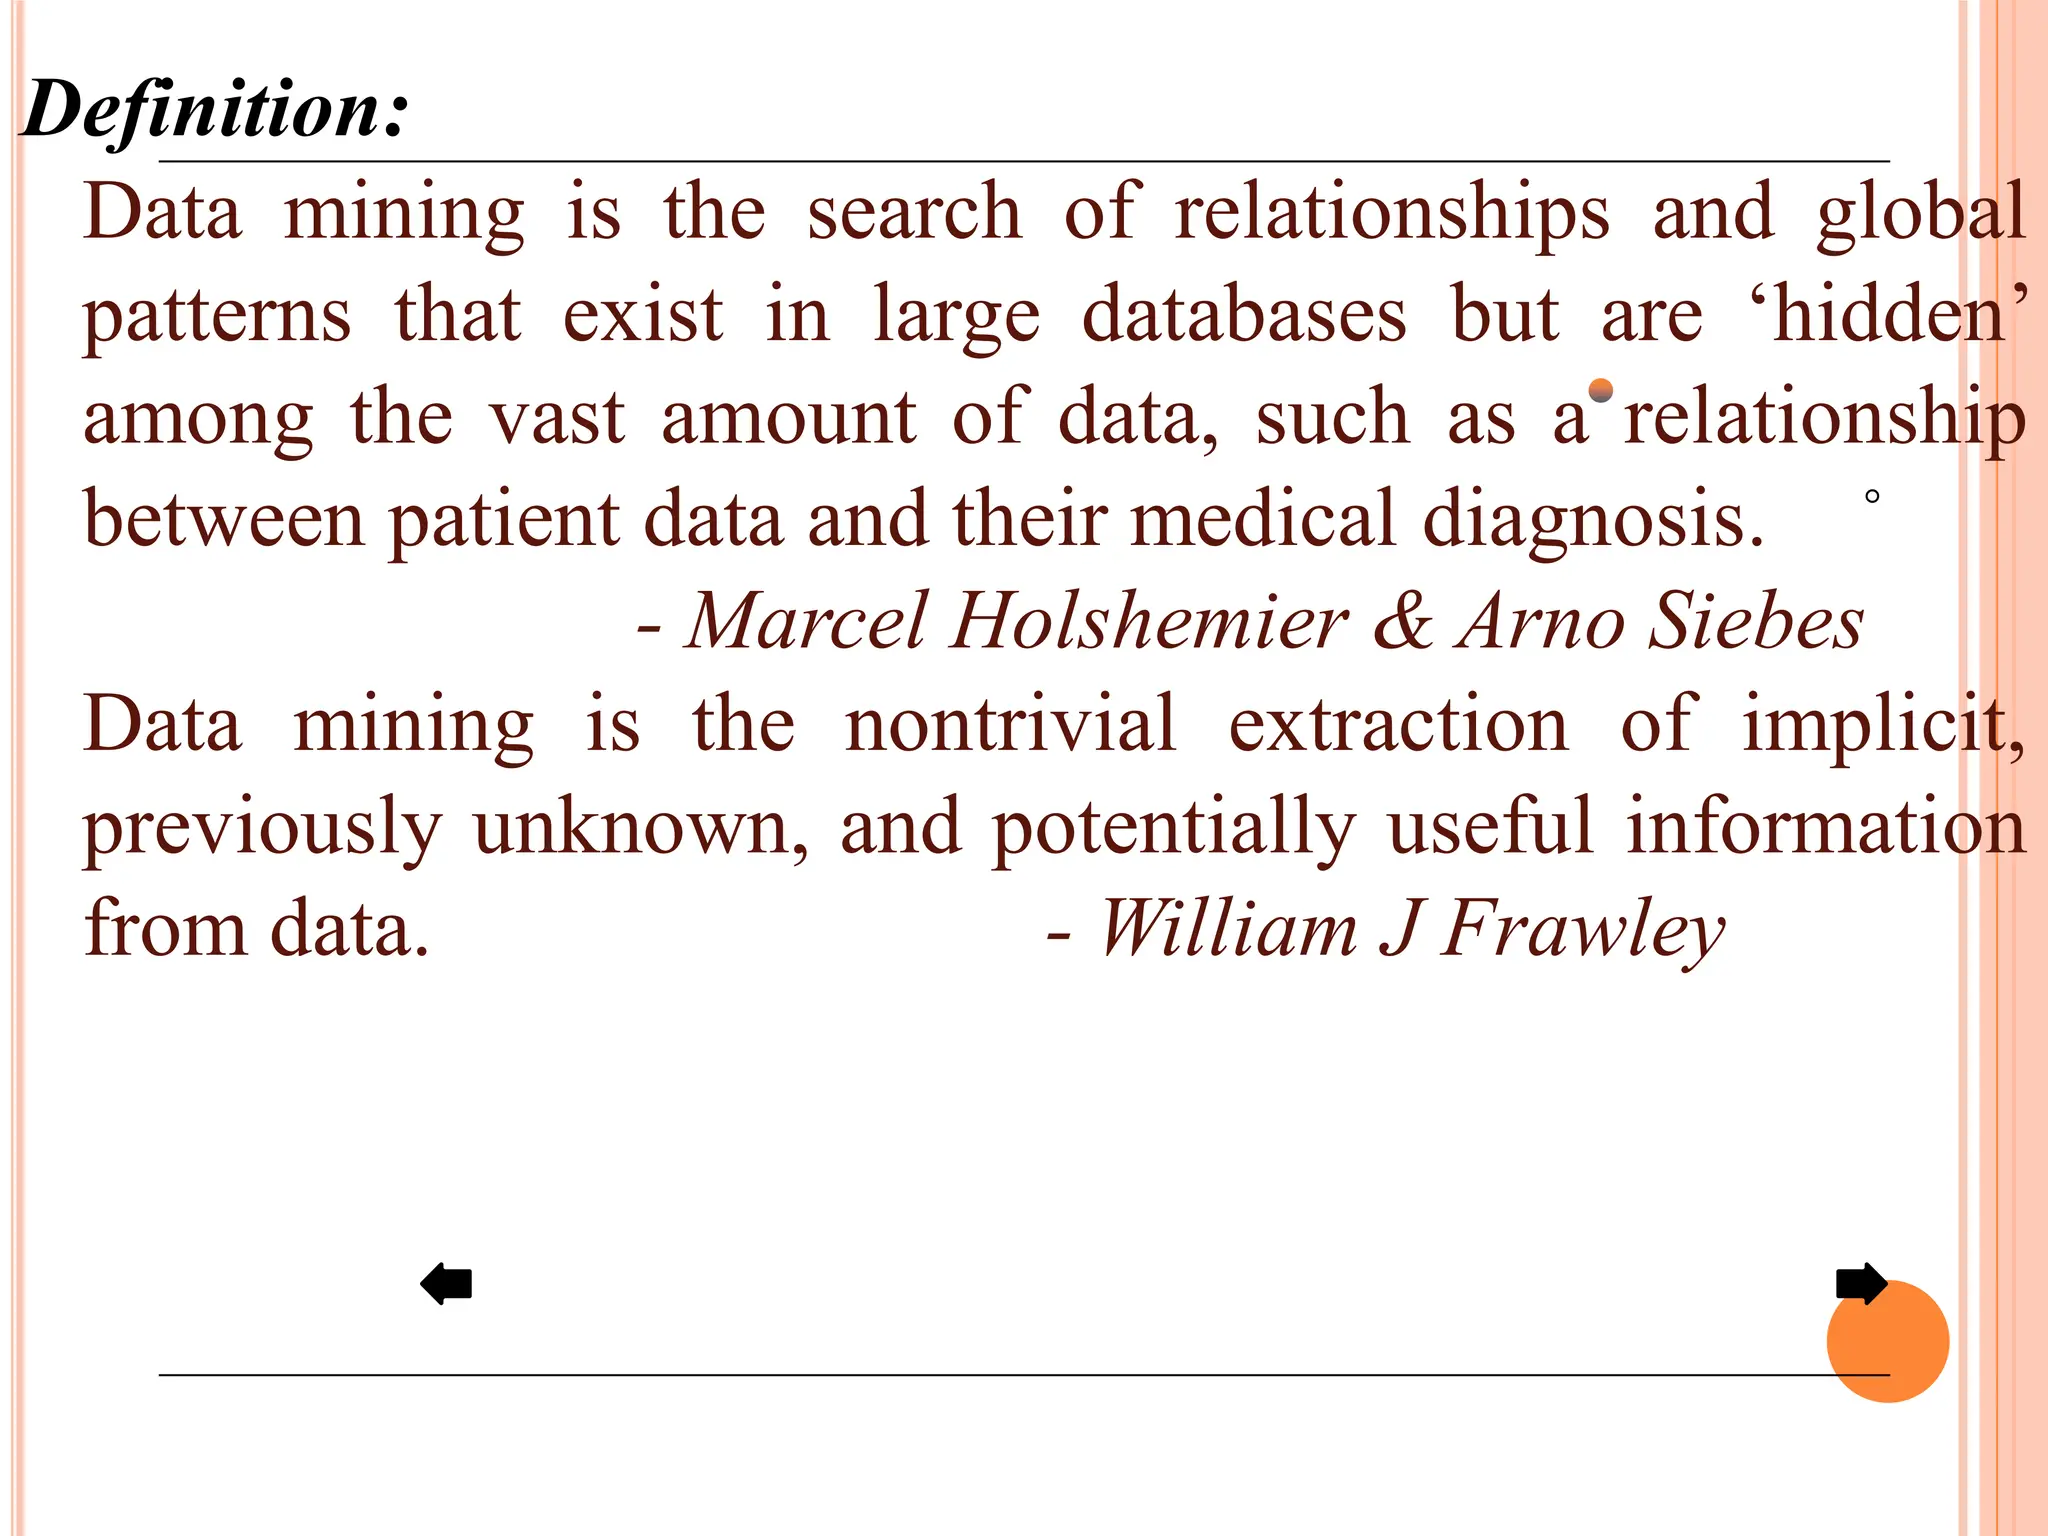
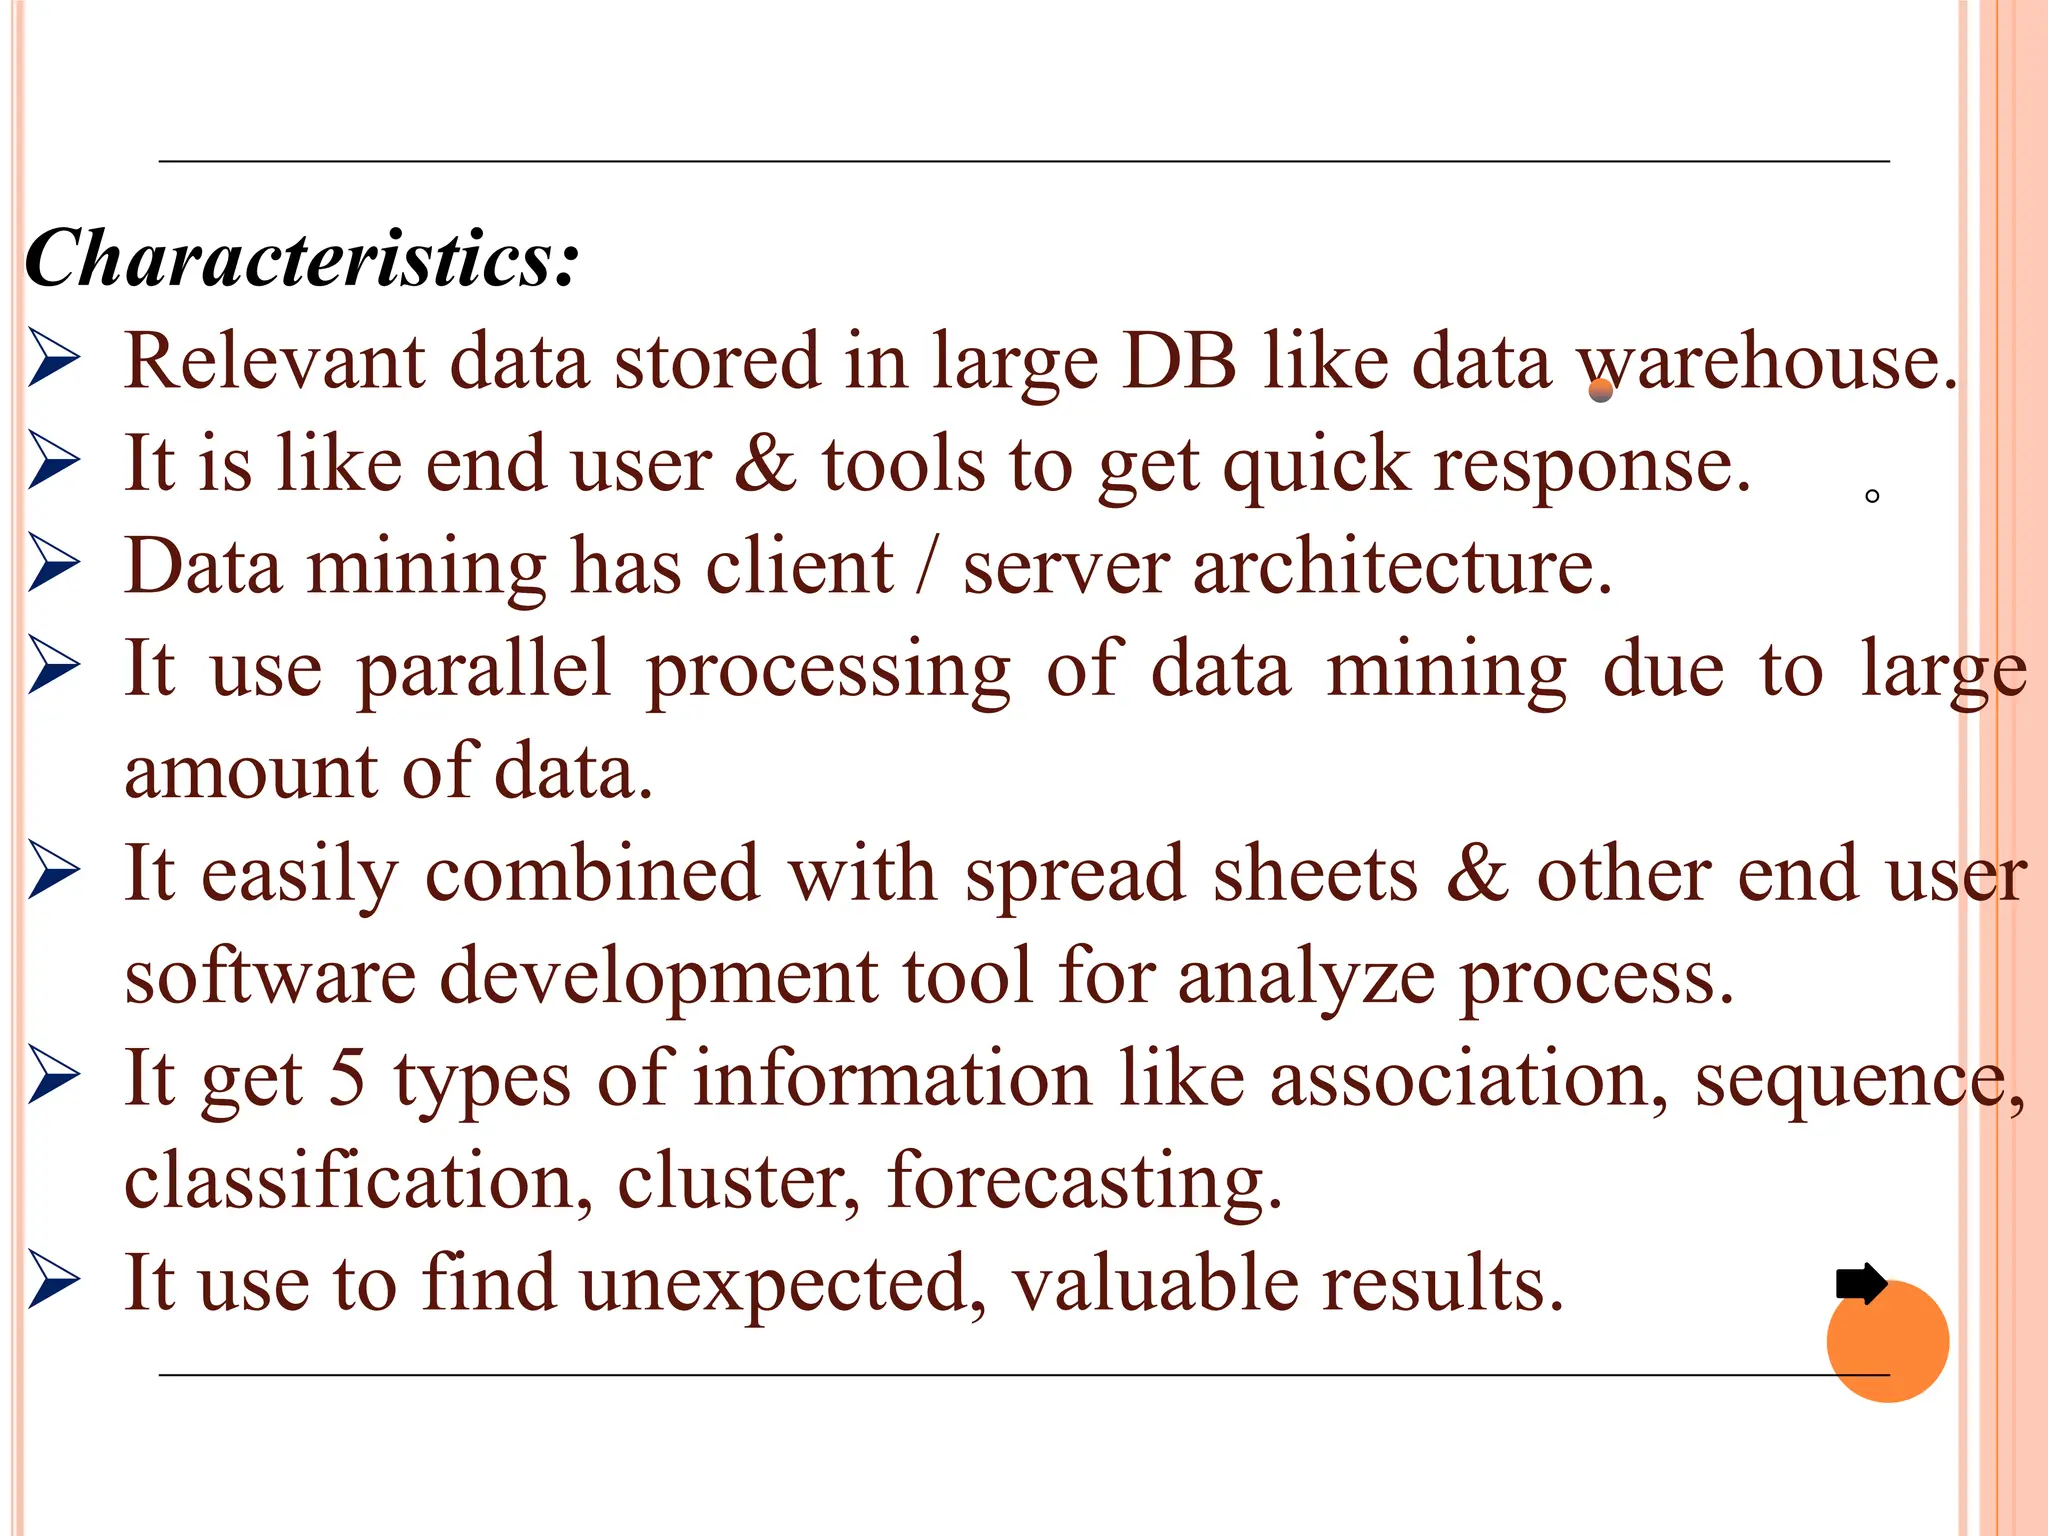
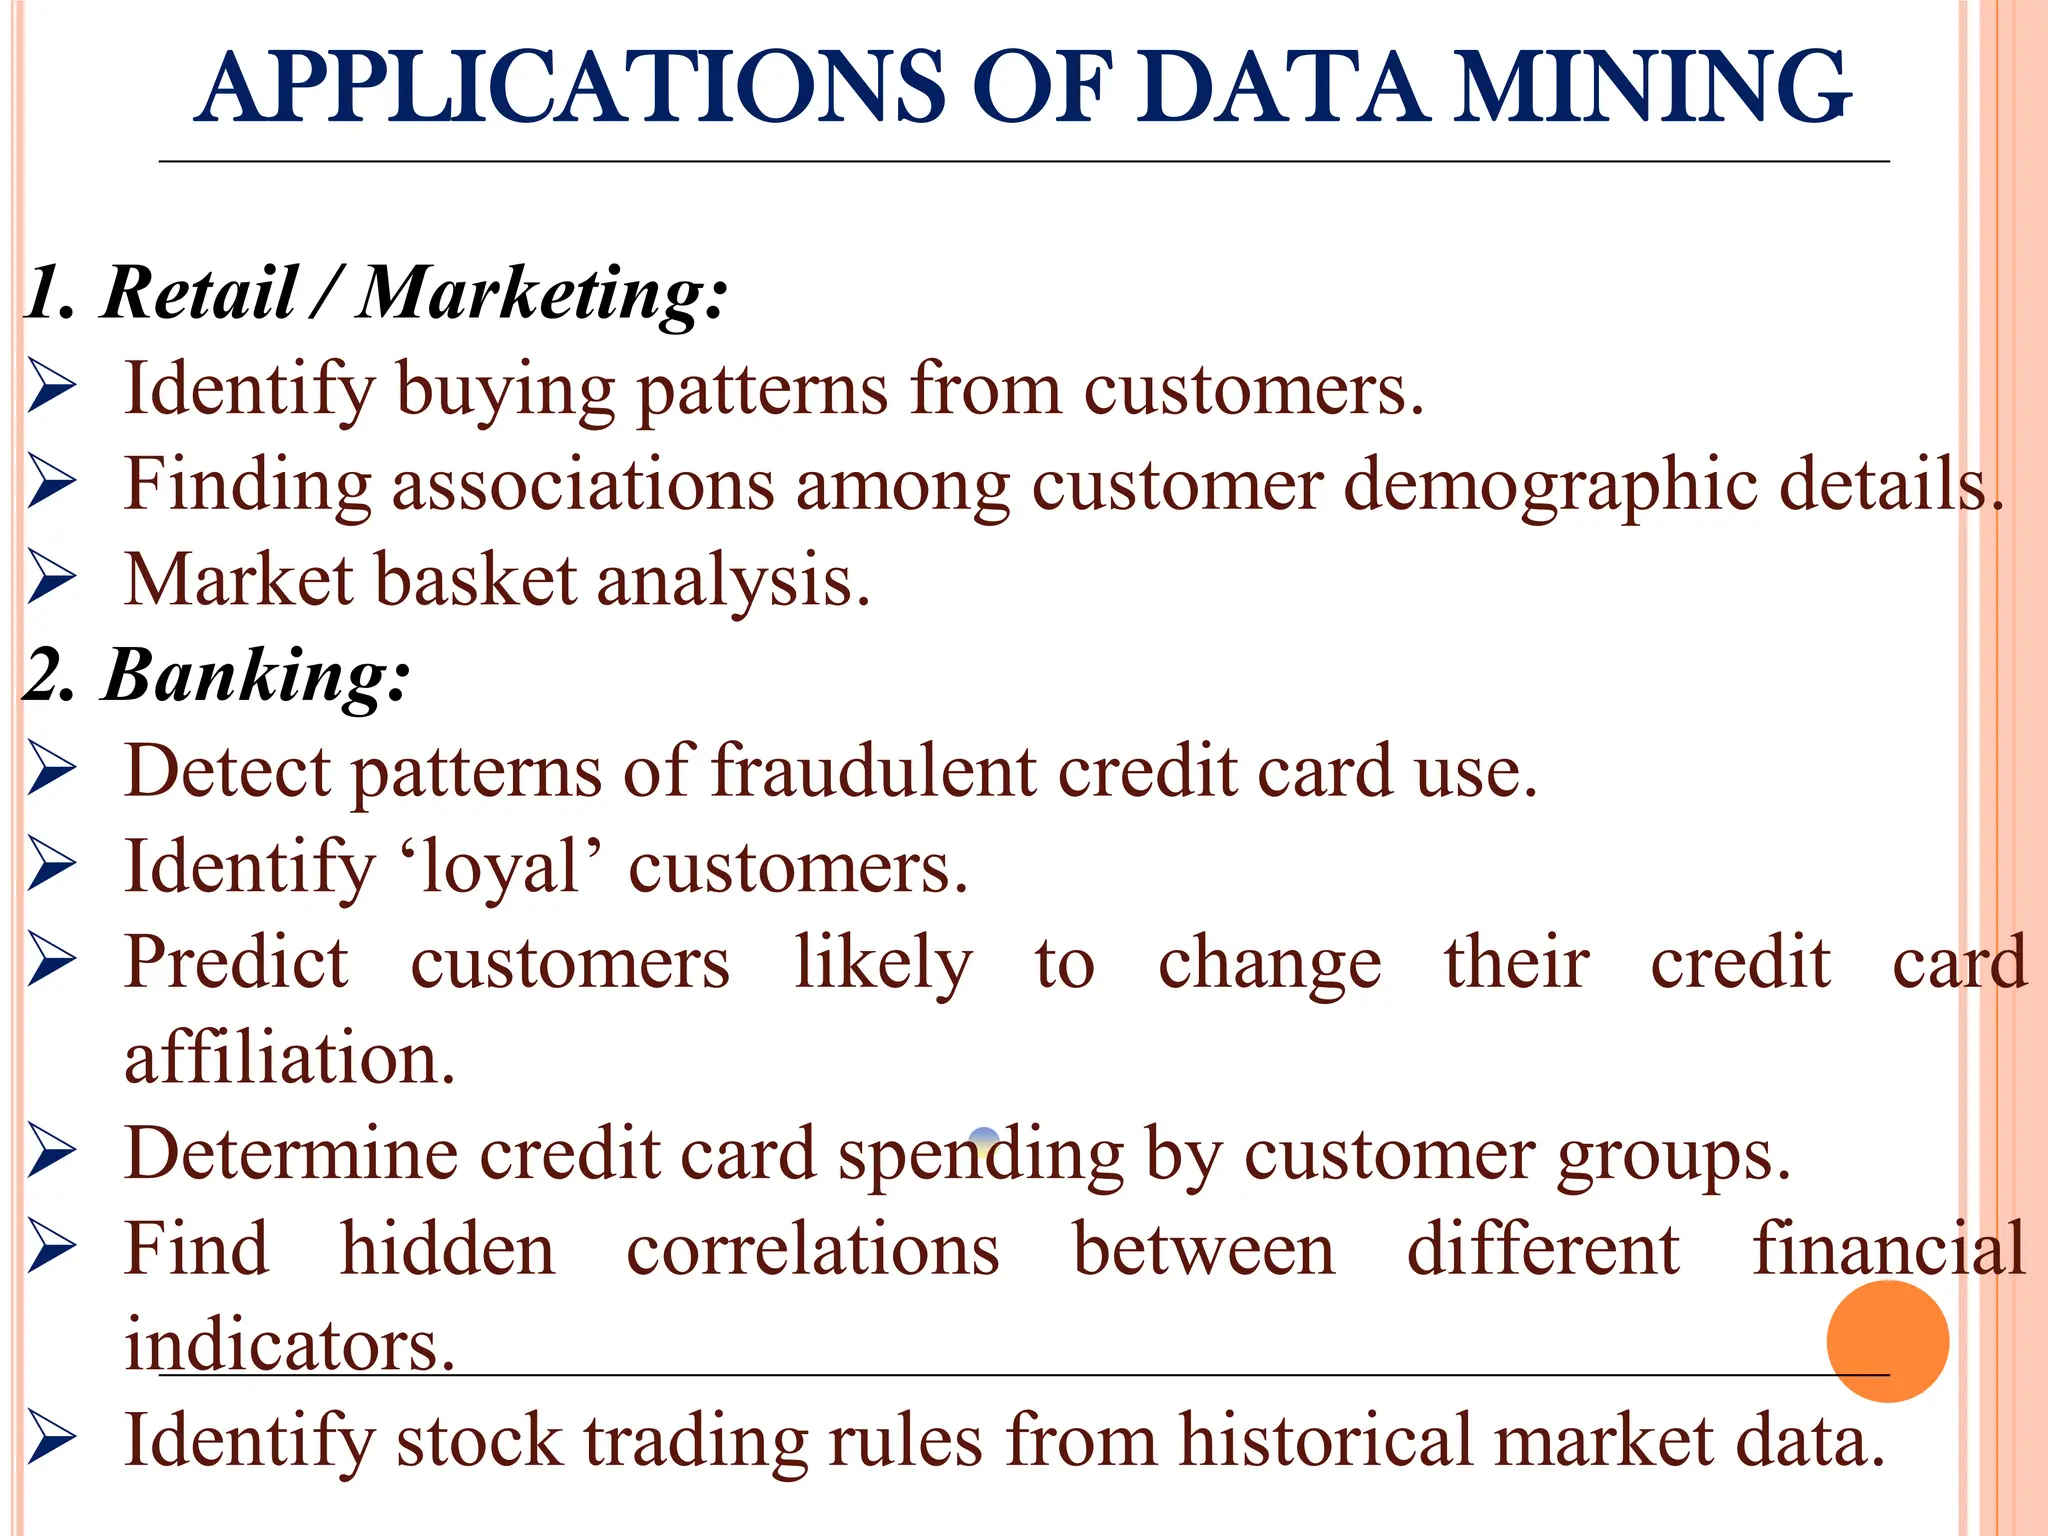
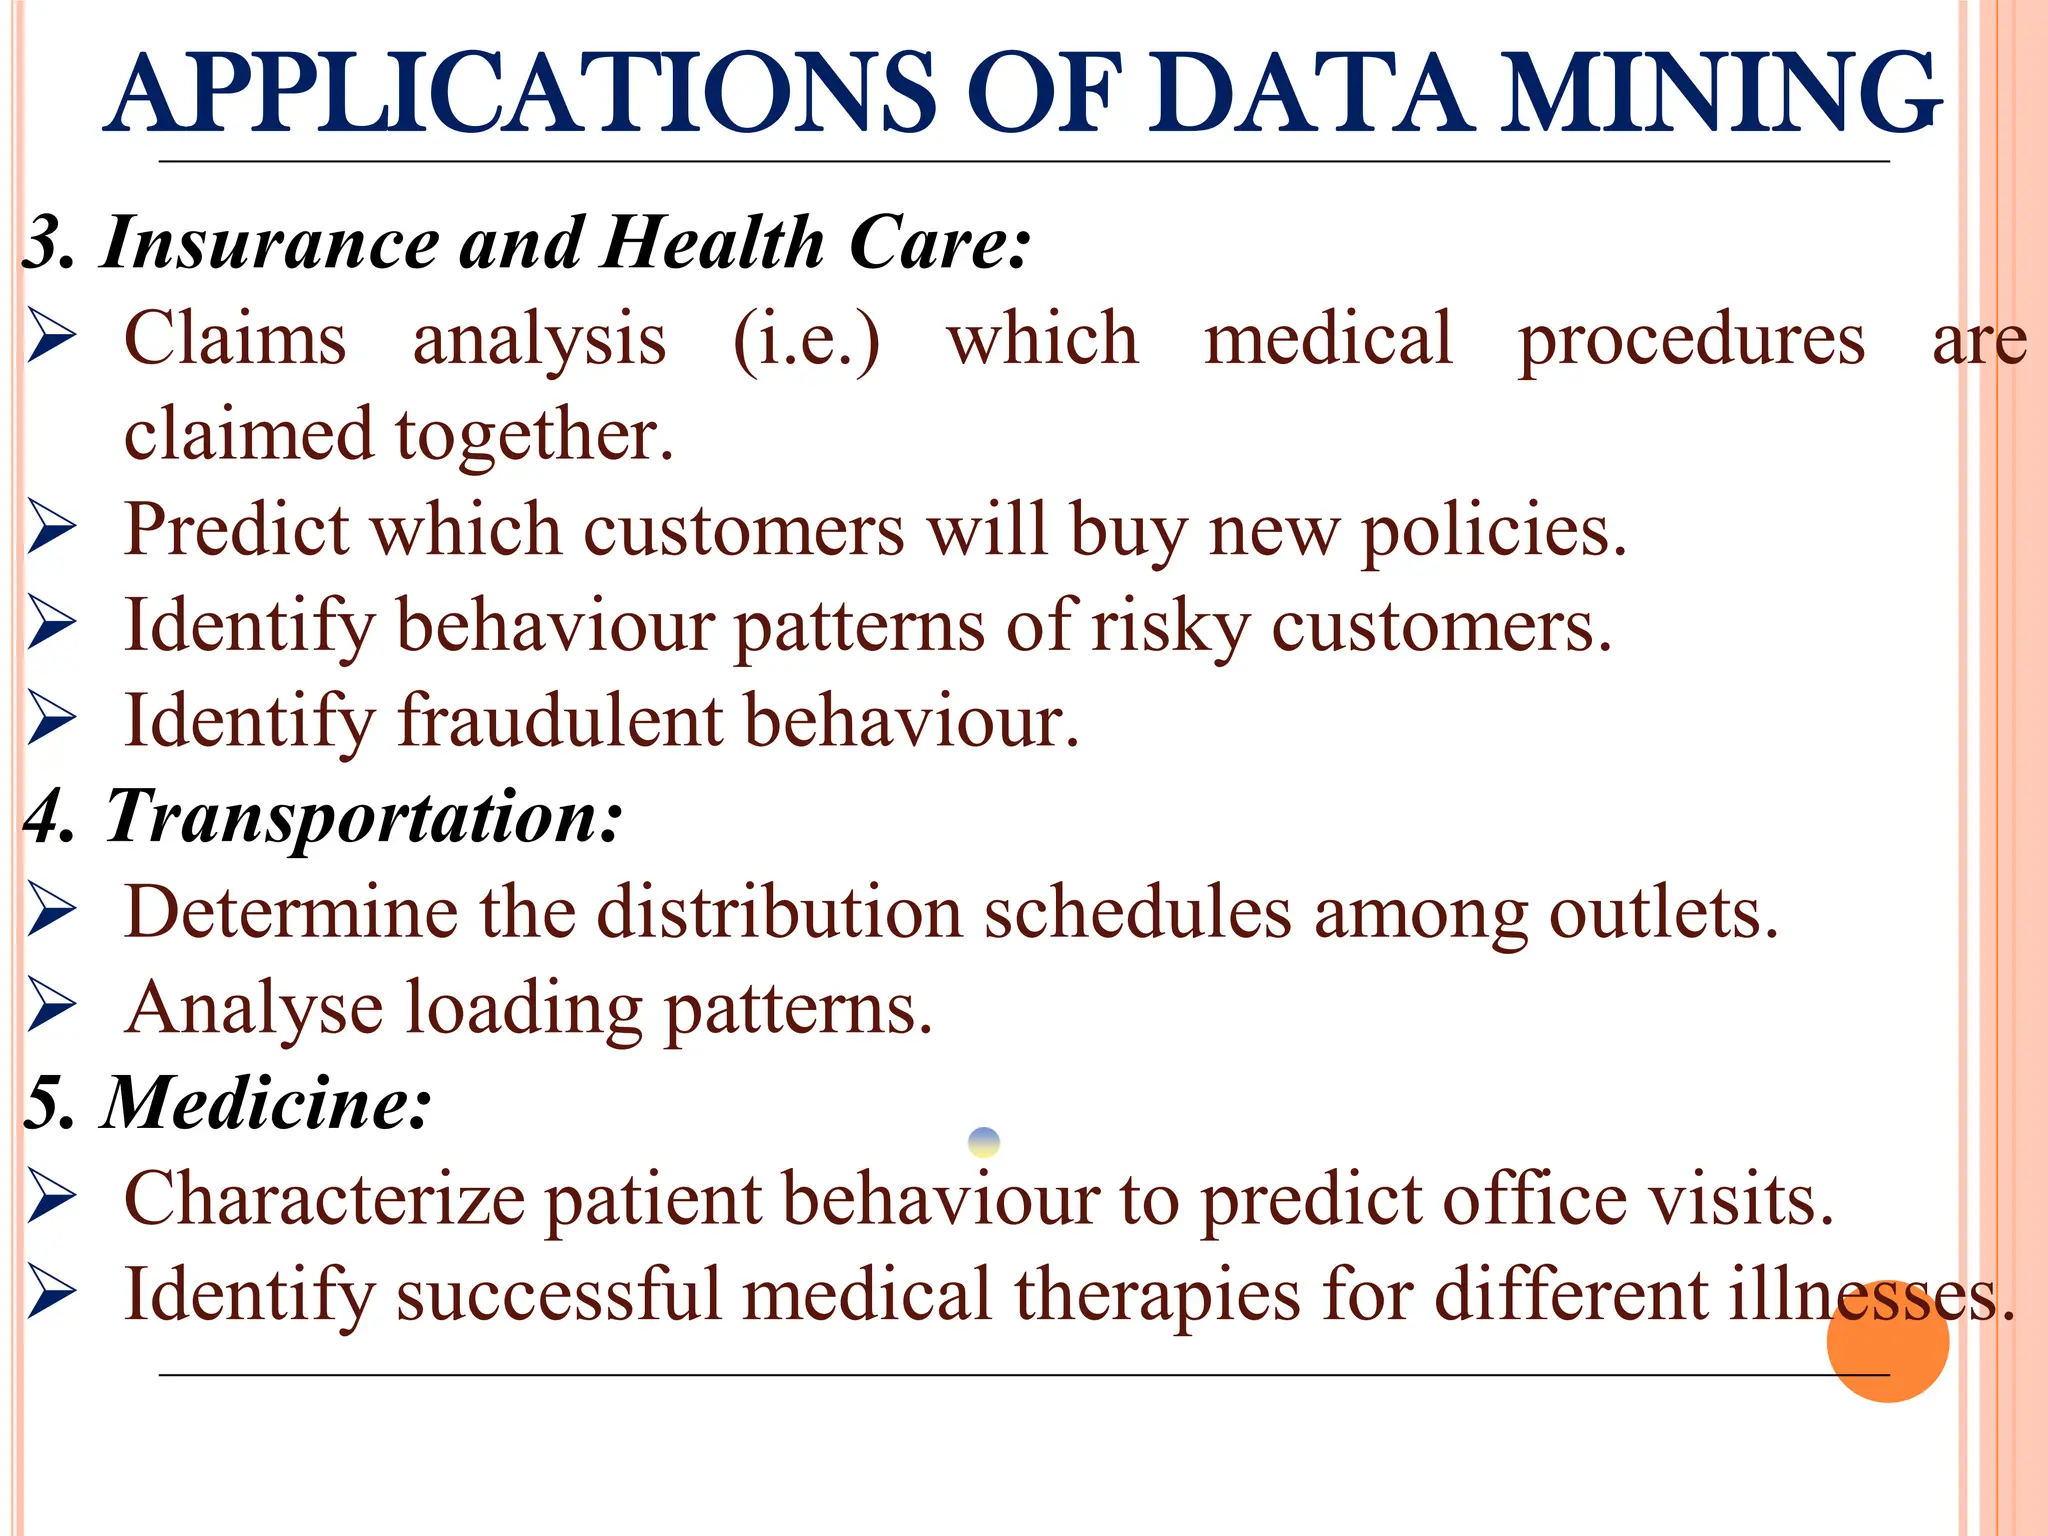
Overview of data mining as knowledge extraction from databases, its algorithms, advantages, and applications in different sectors.
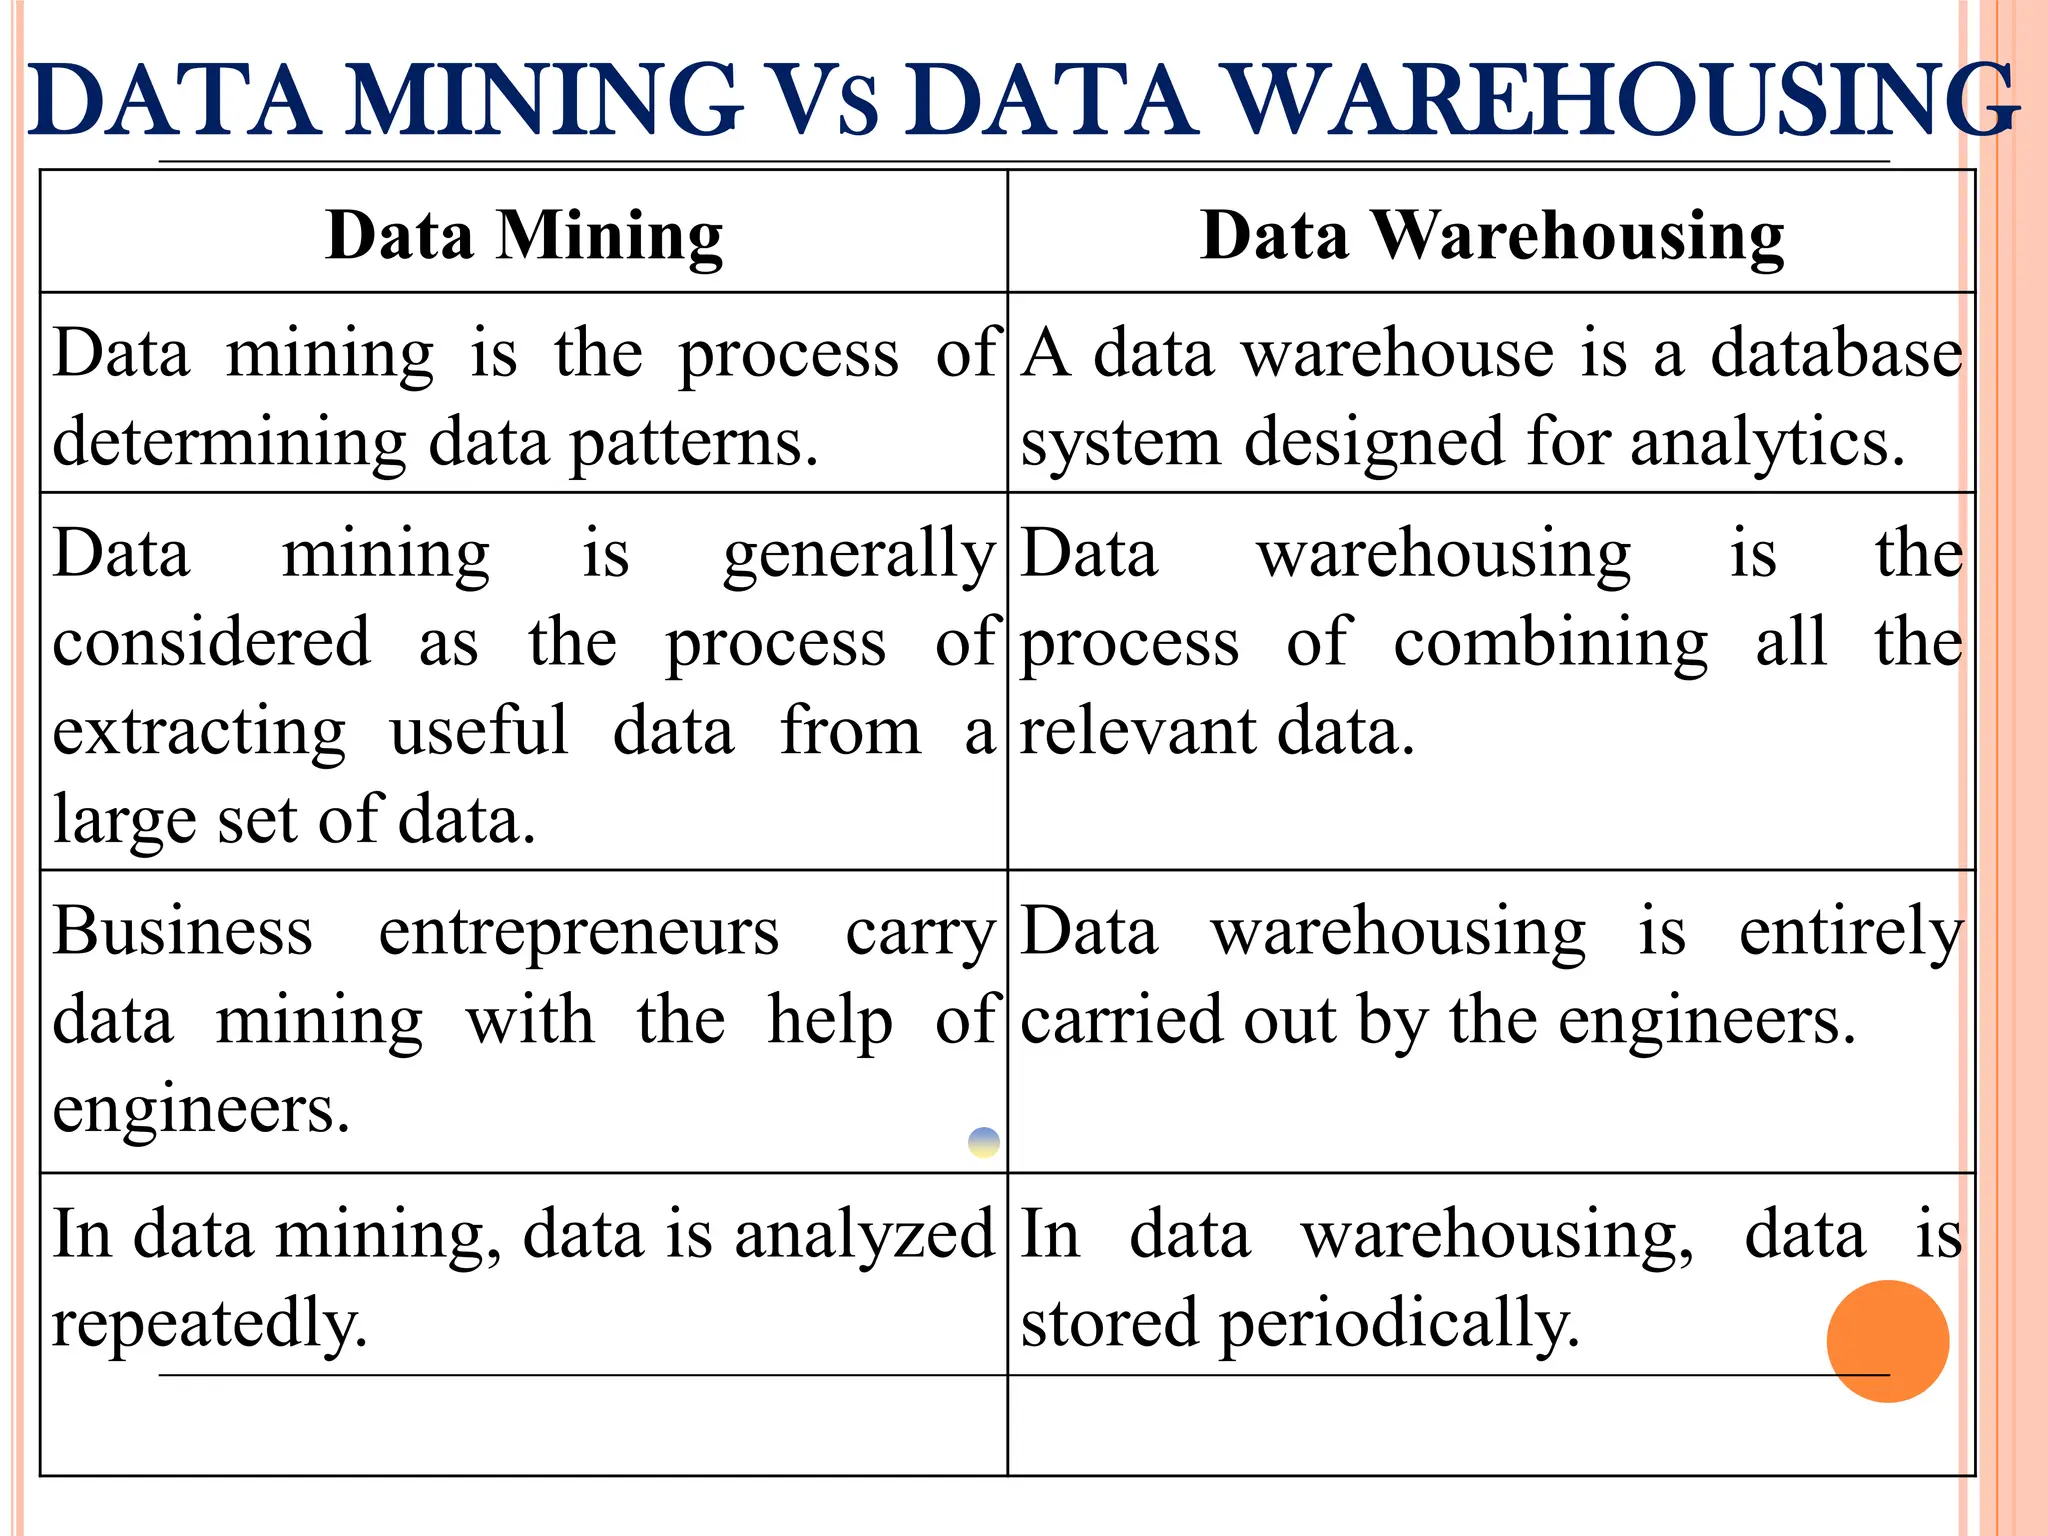
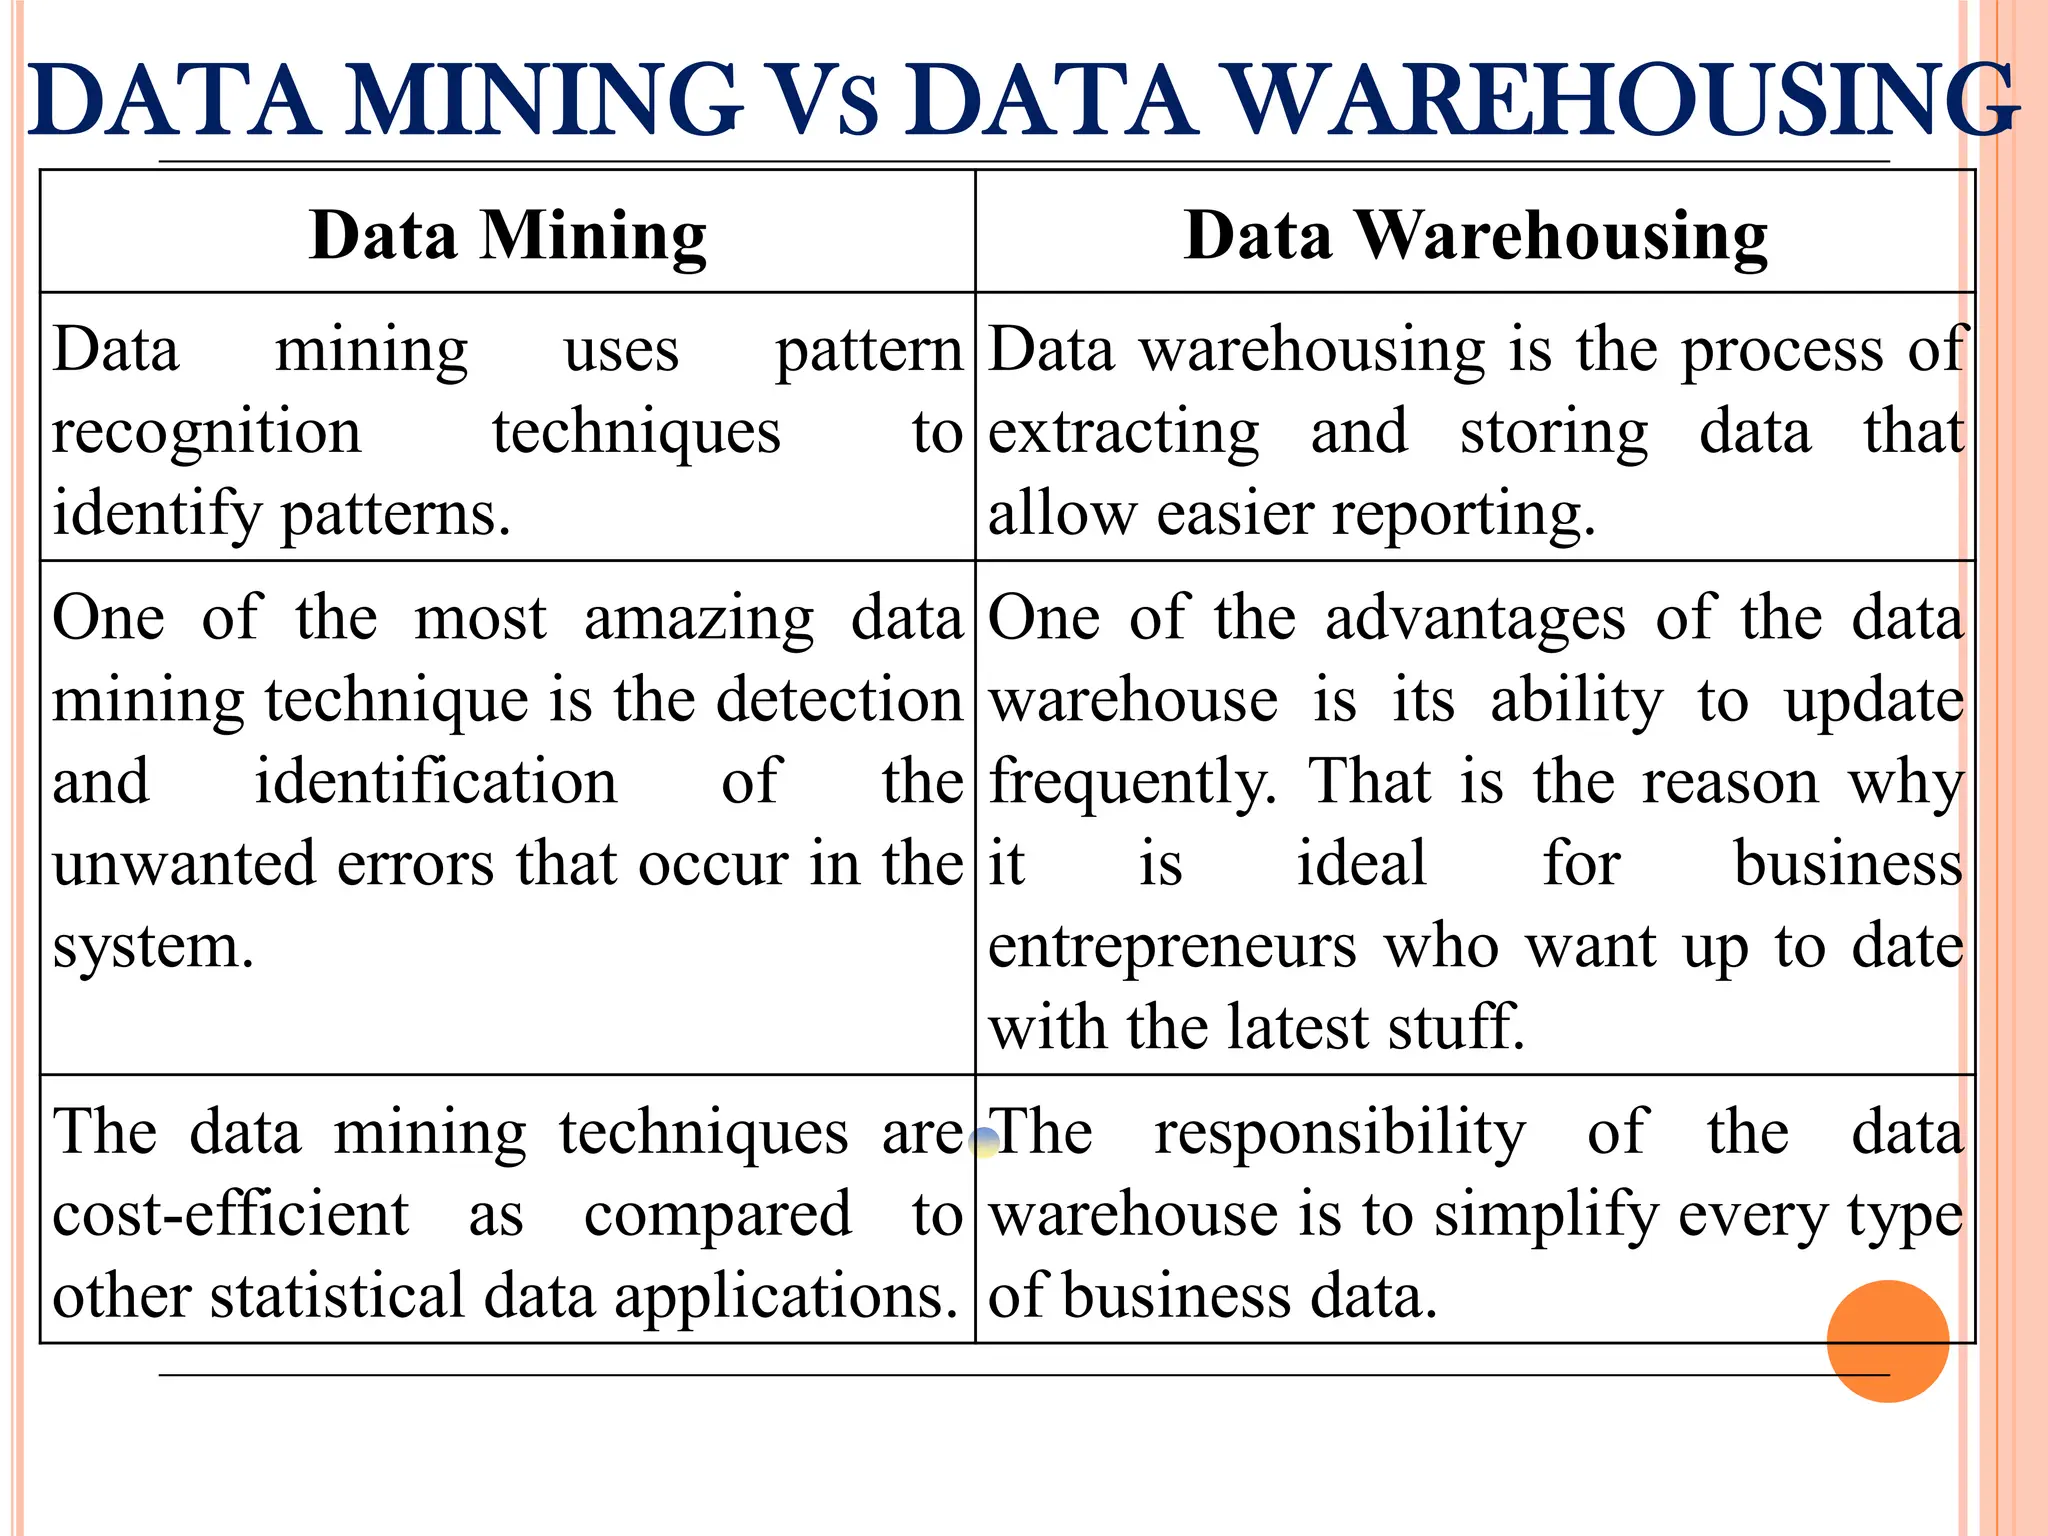
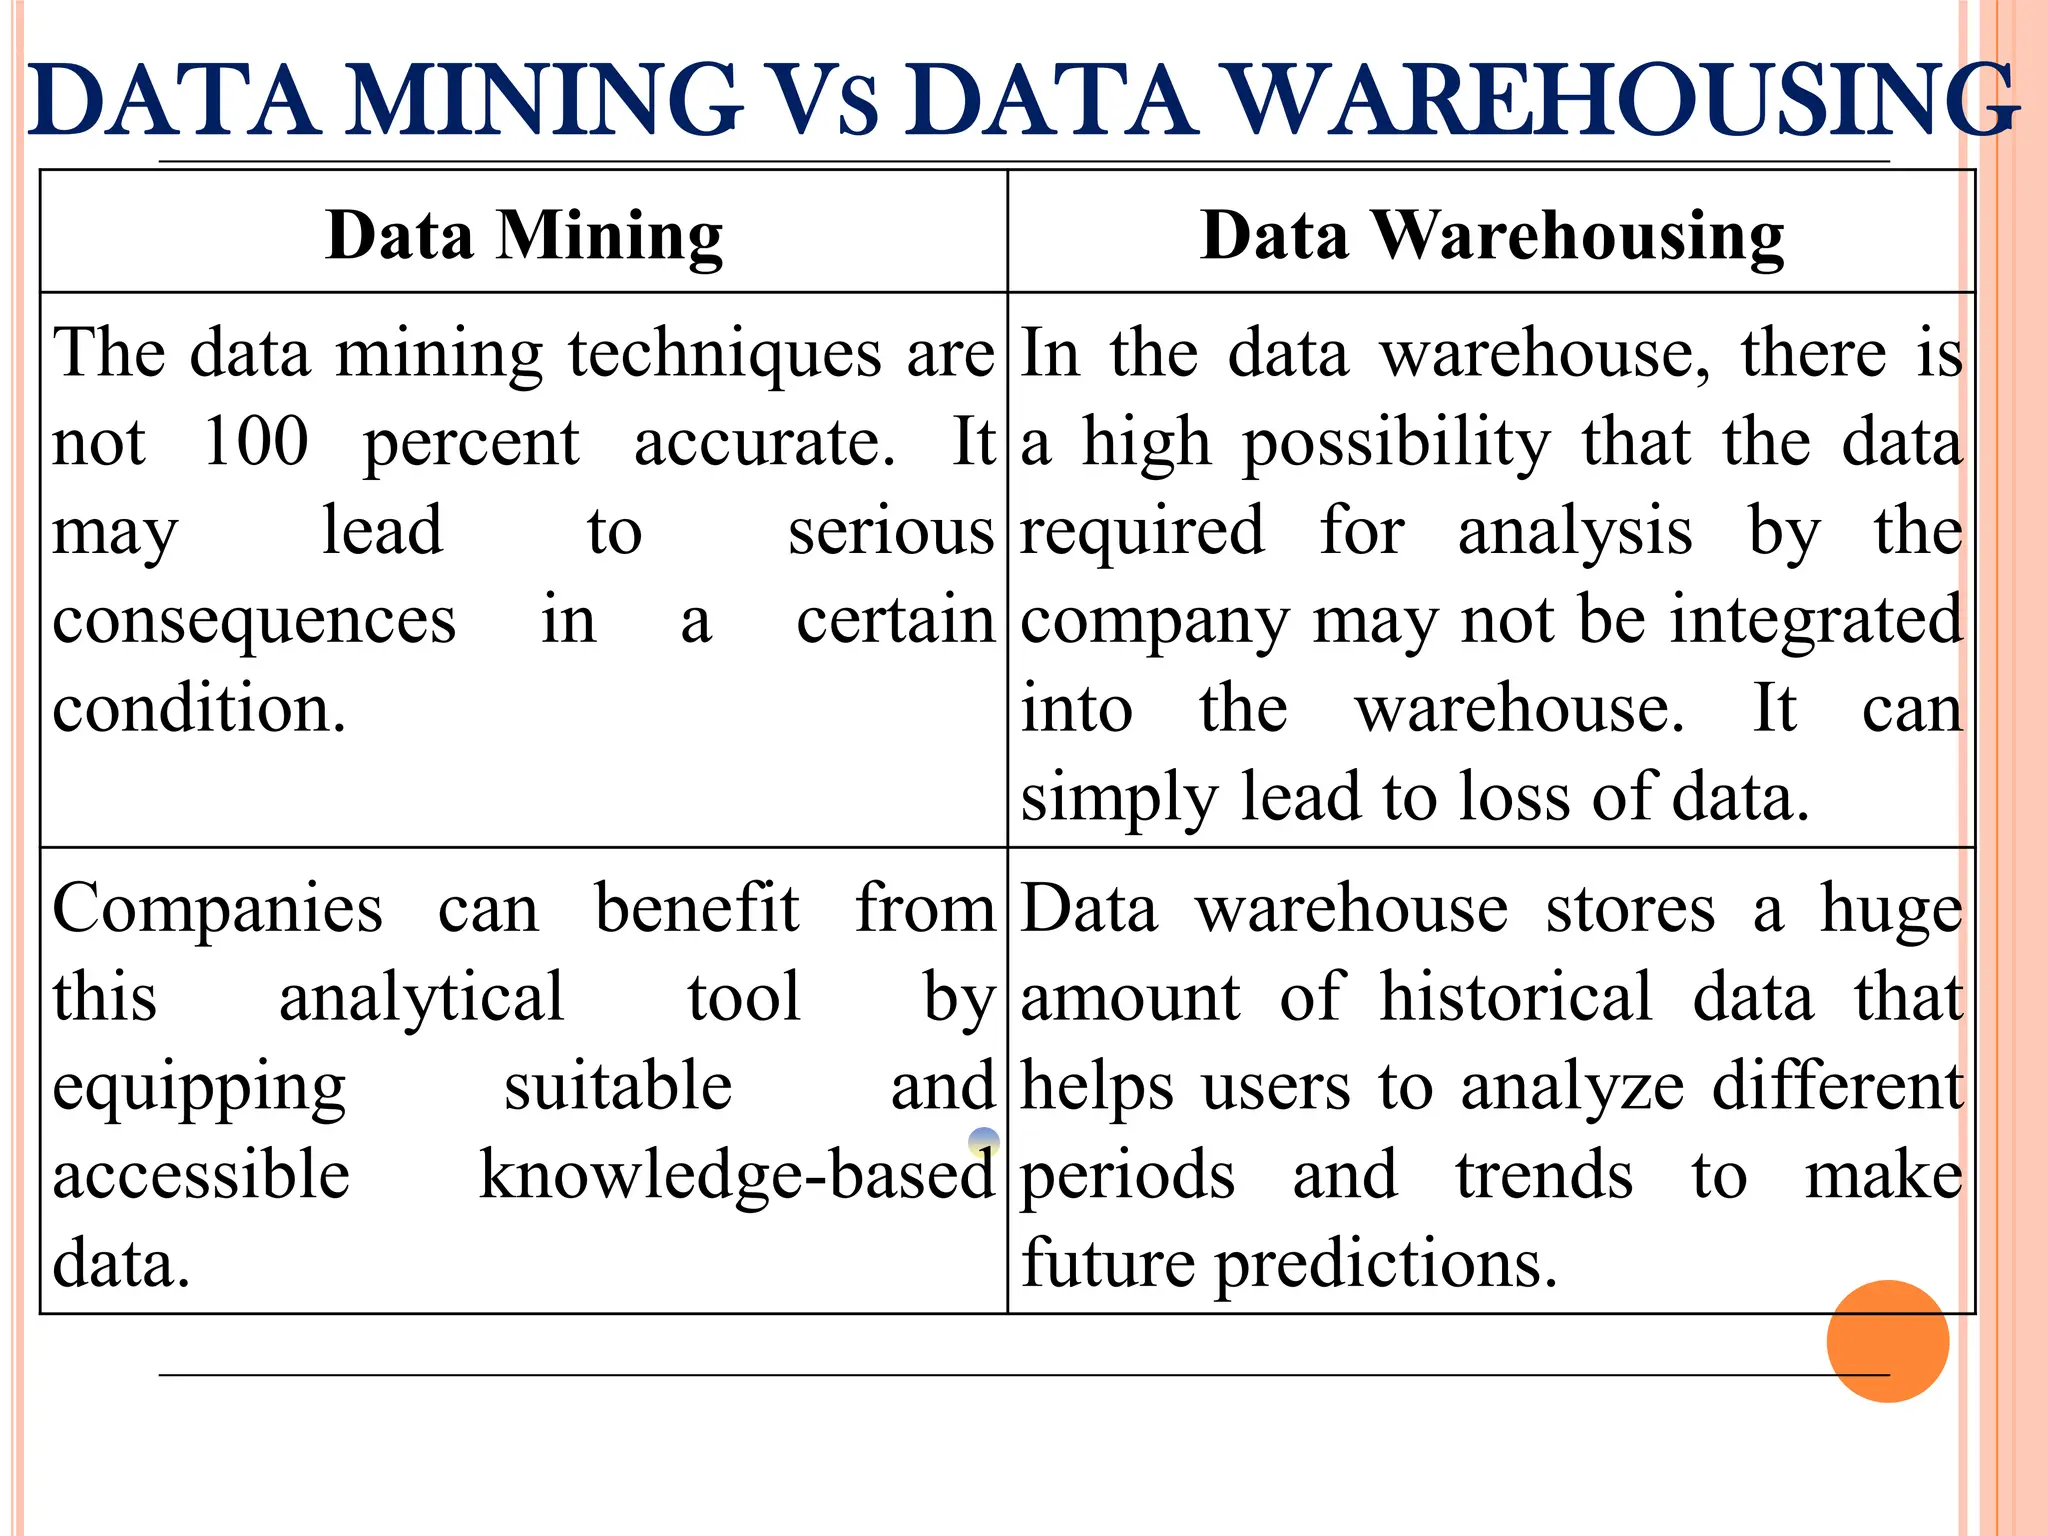
Comparison between data mining and warehousing in terms of processes, techniques, and responsibilities in data management.
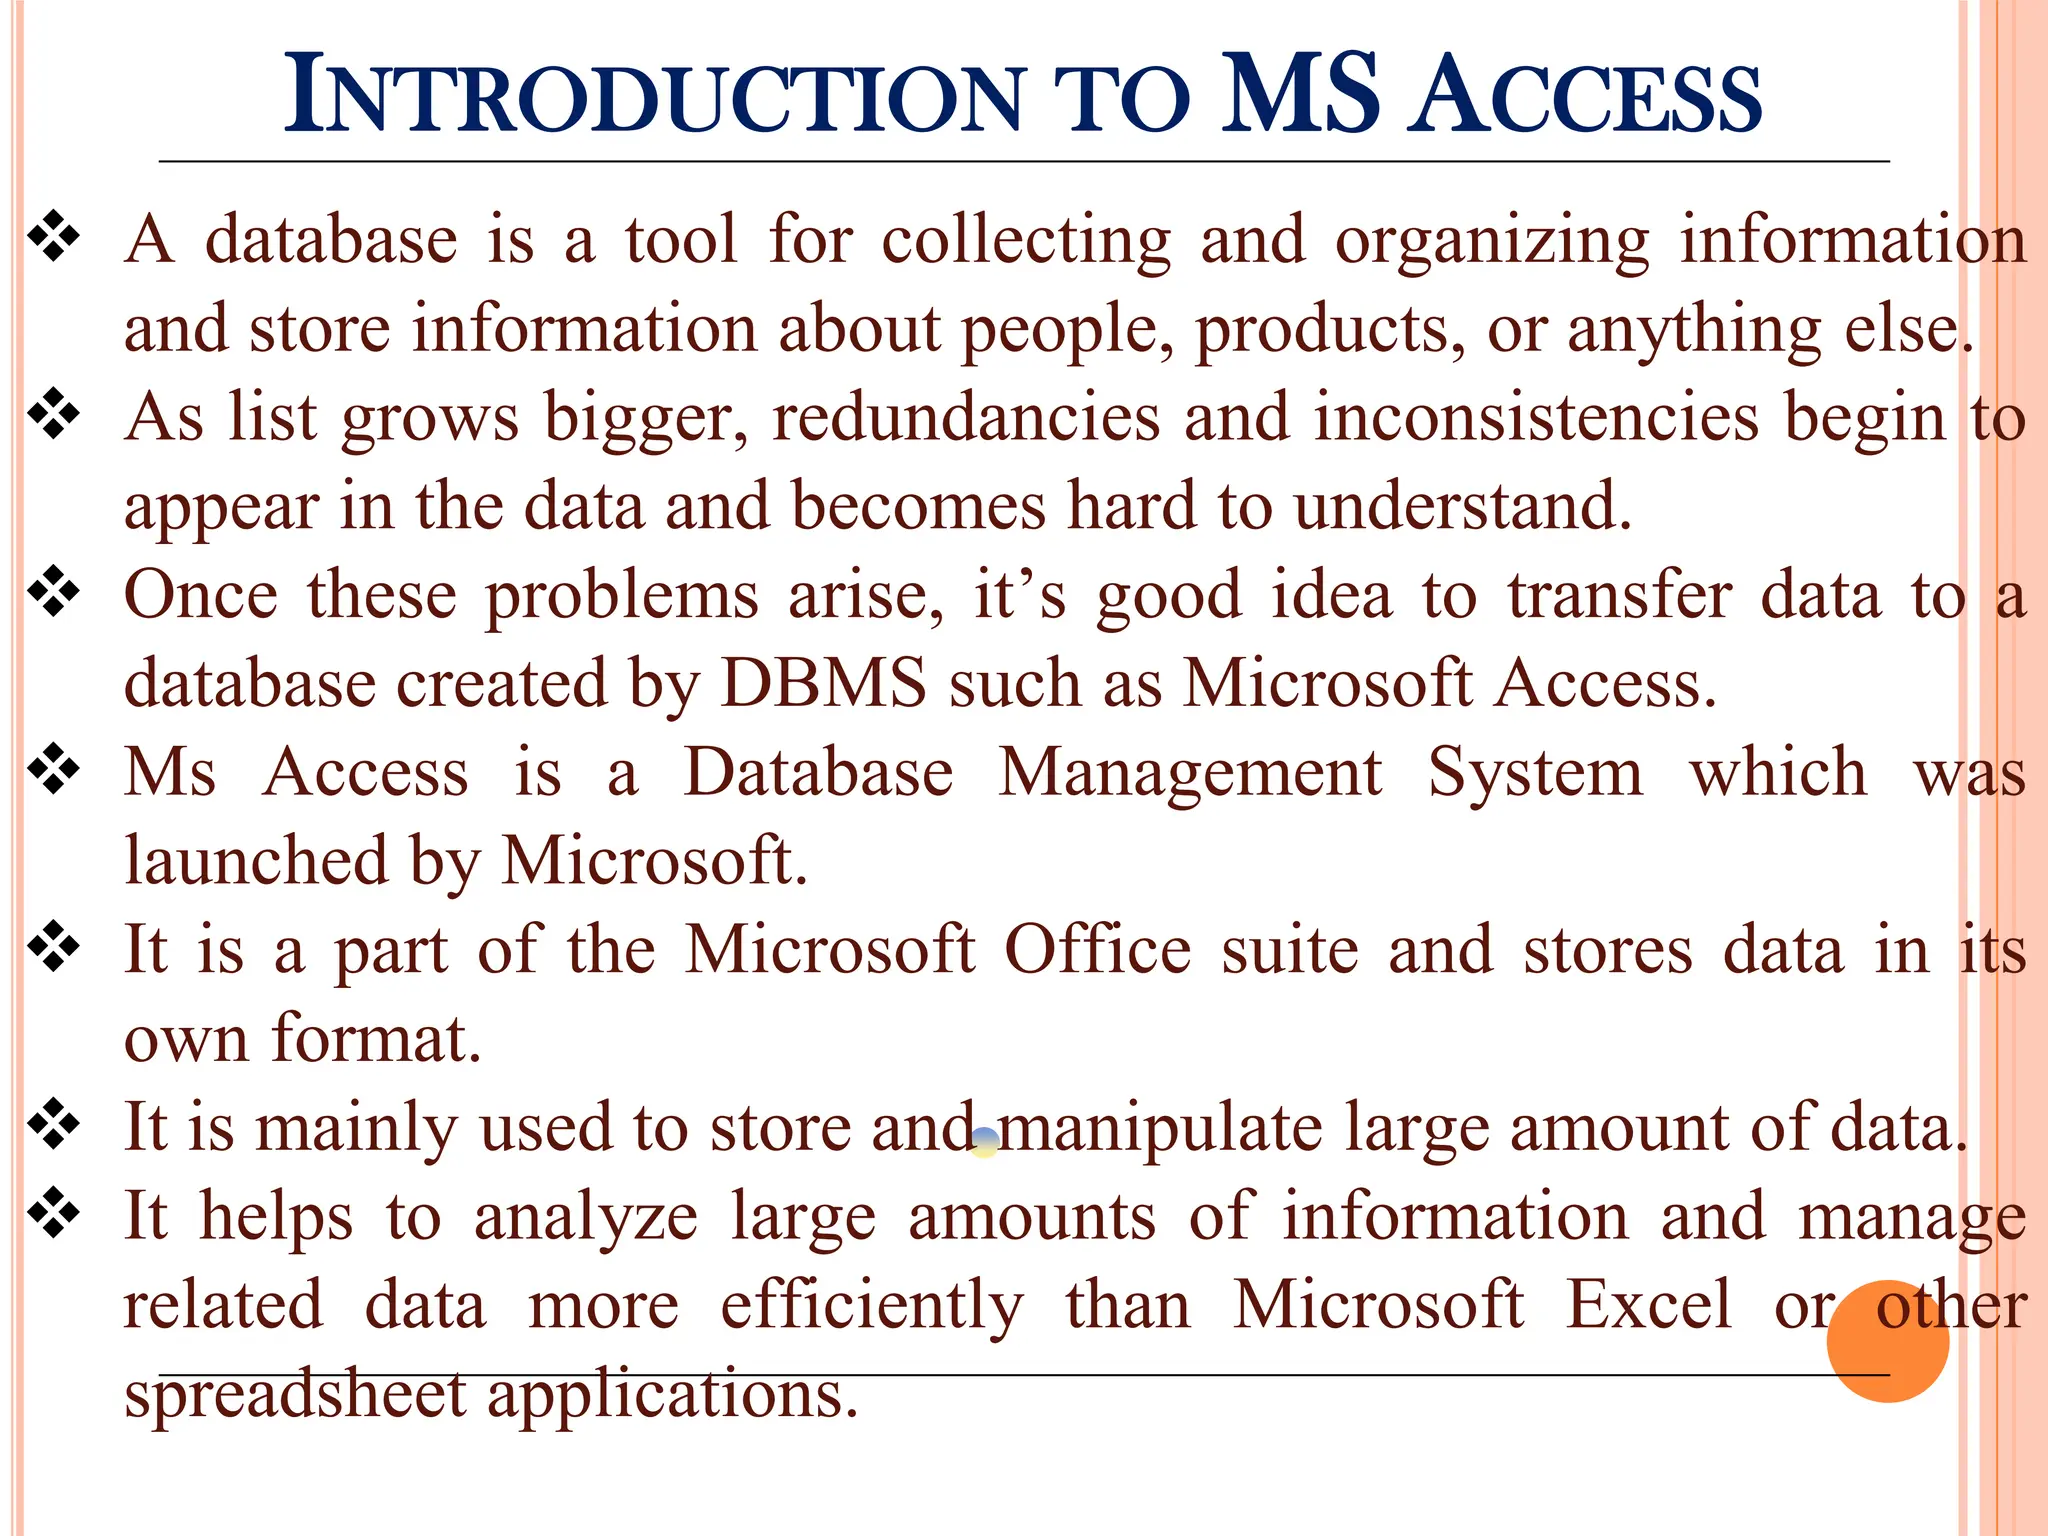
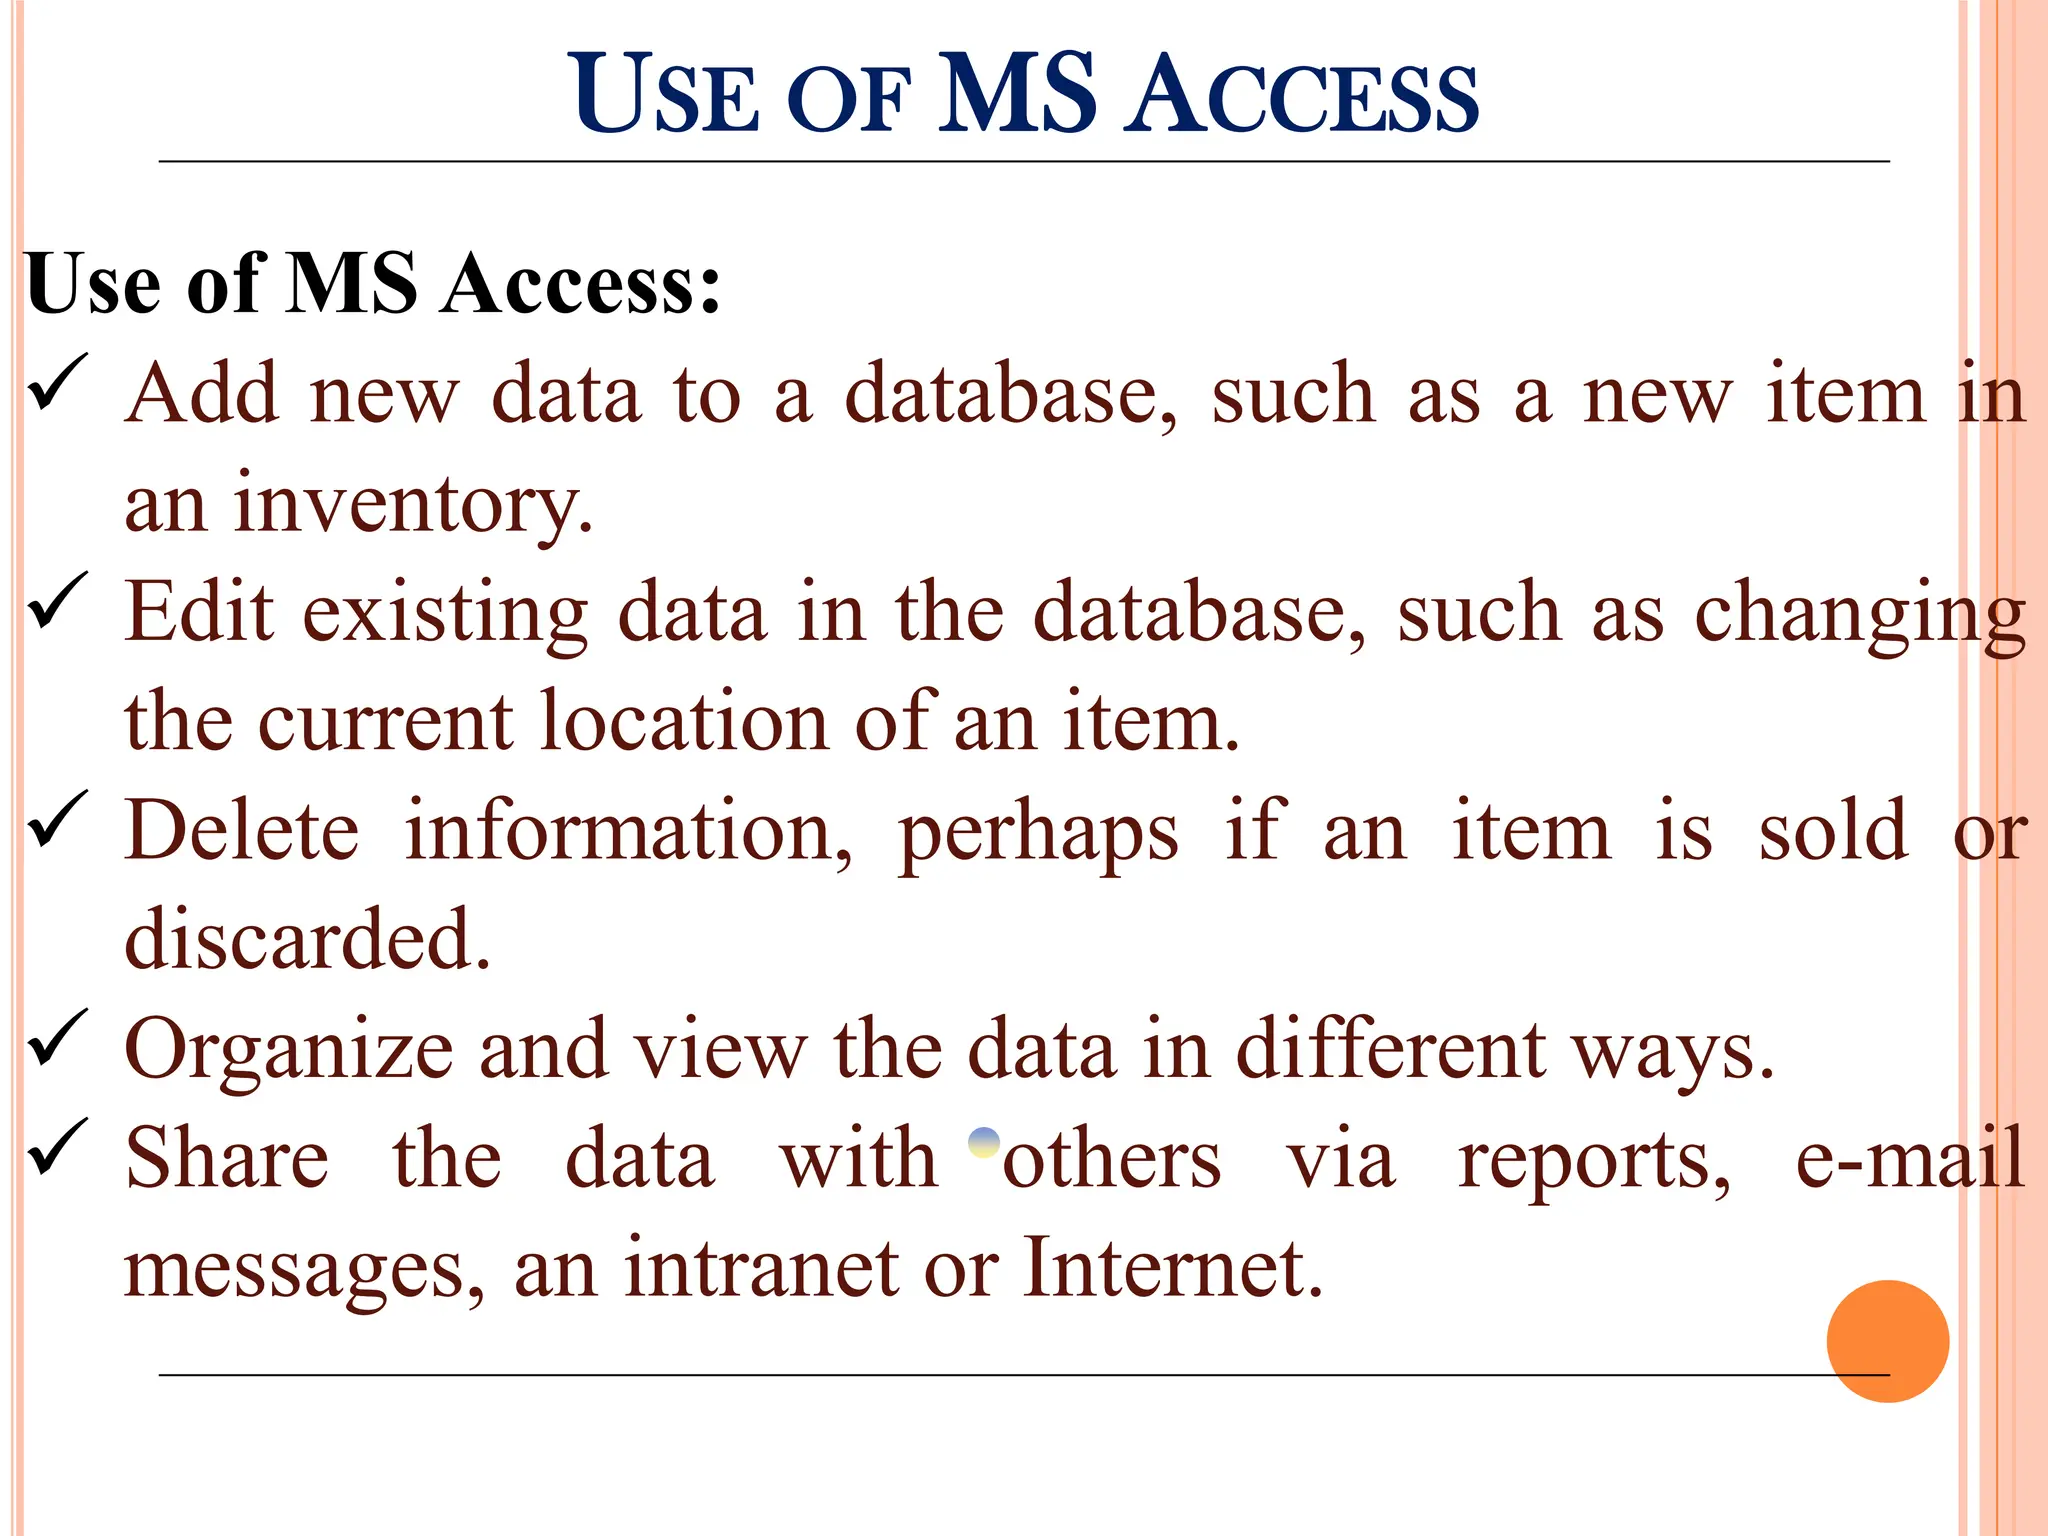
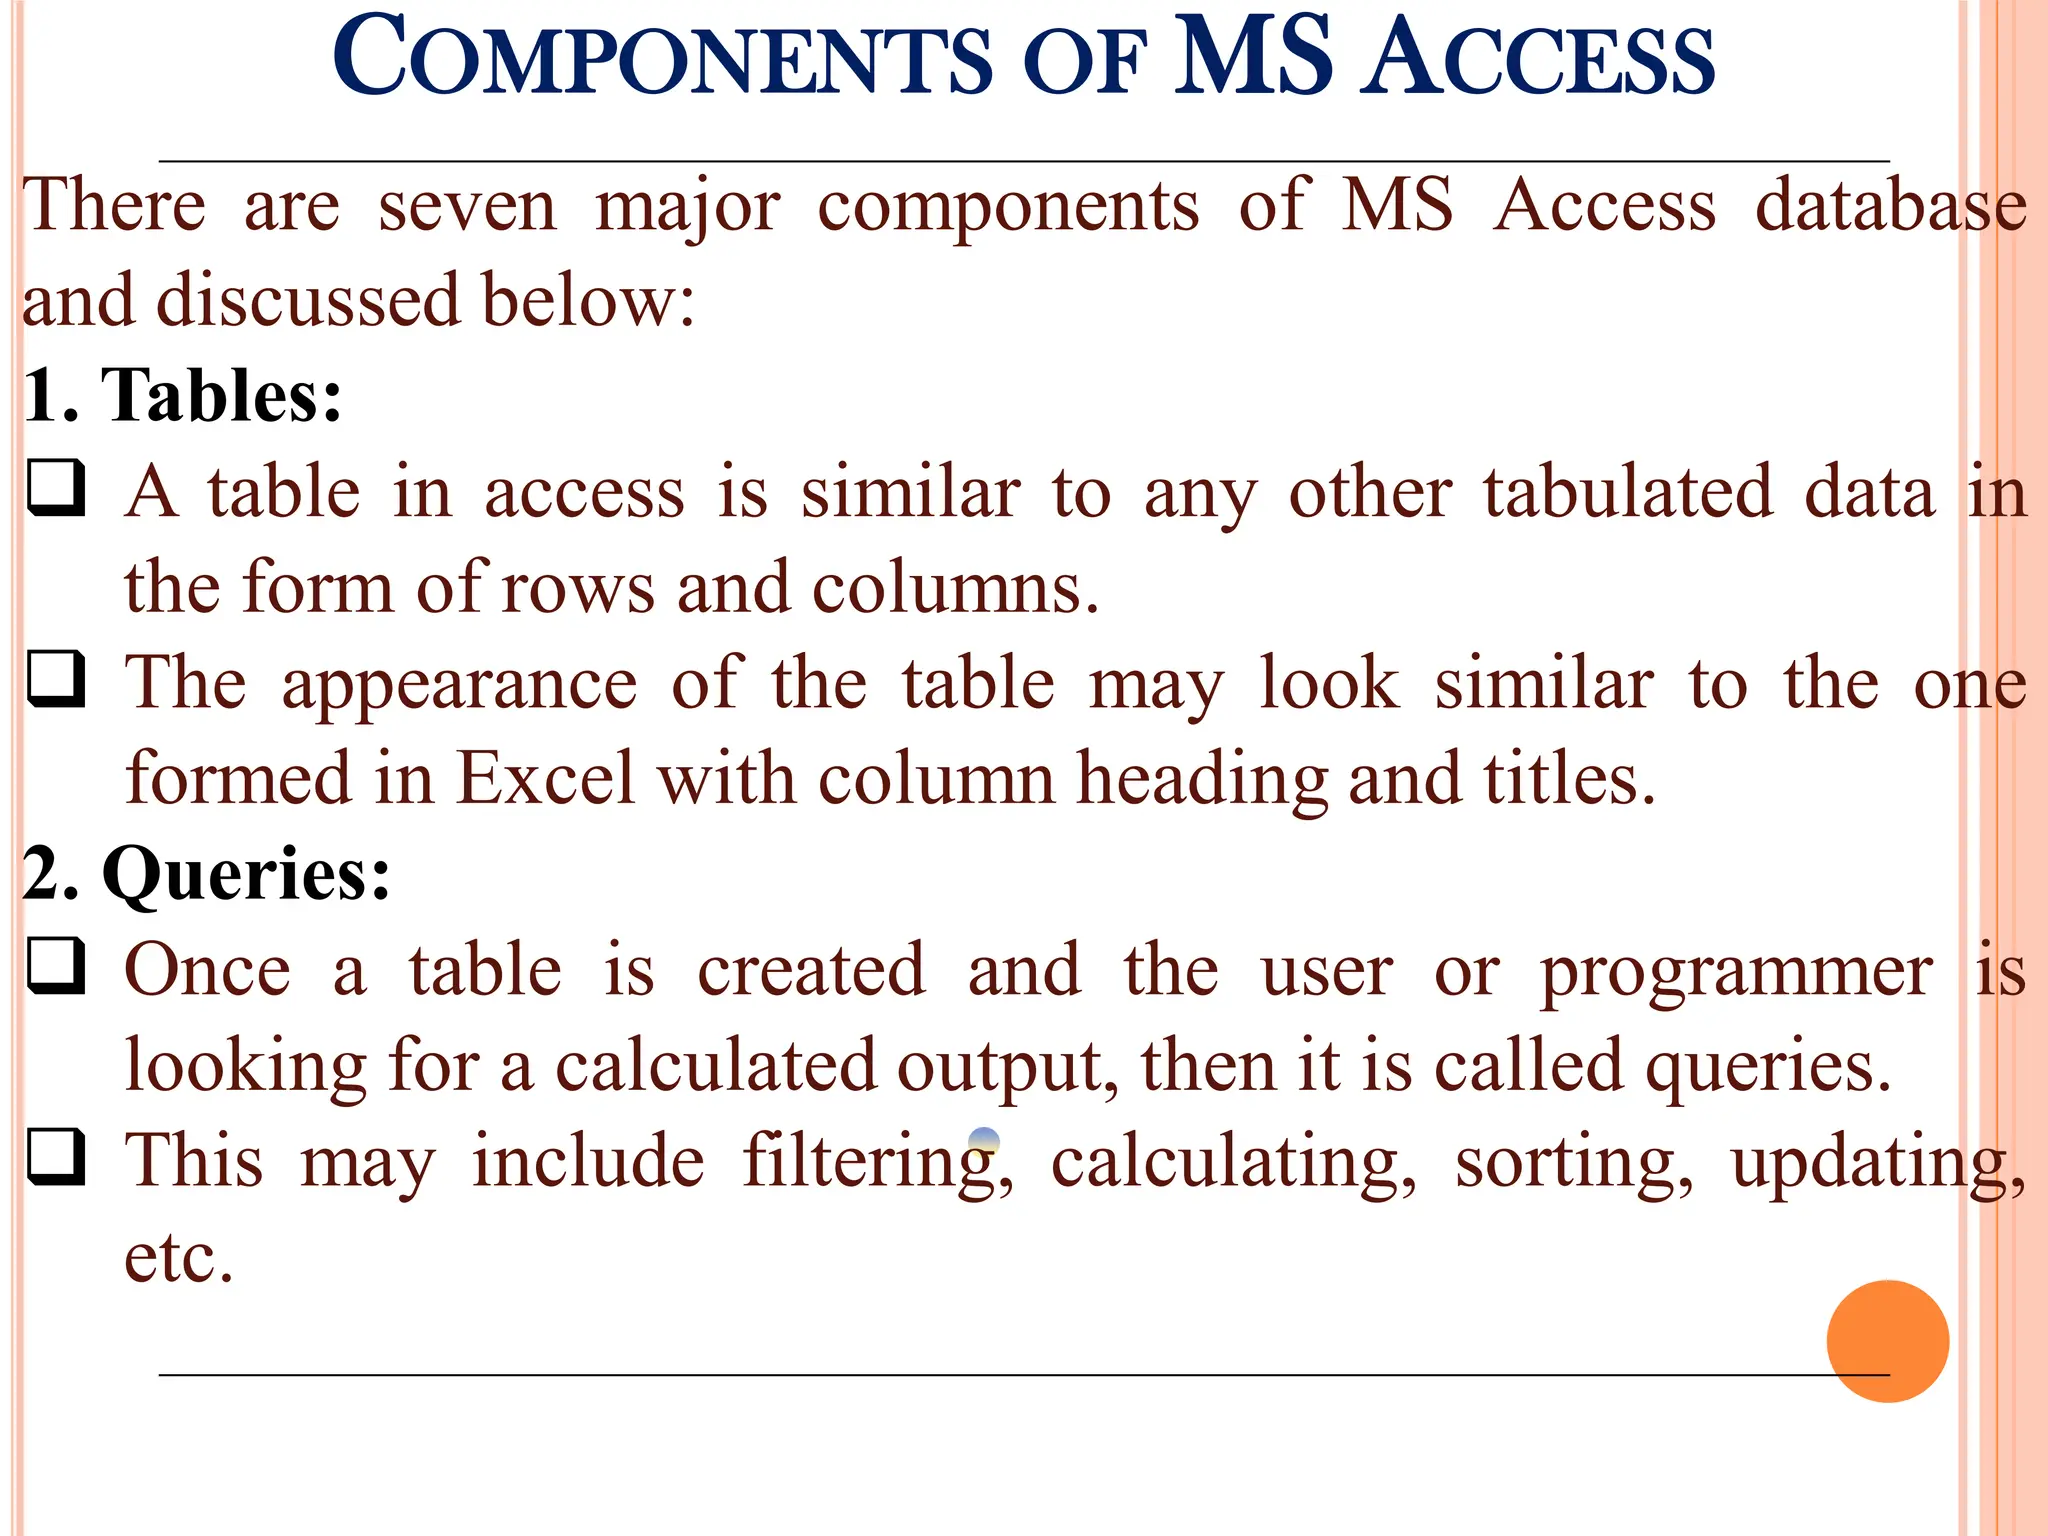
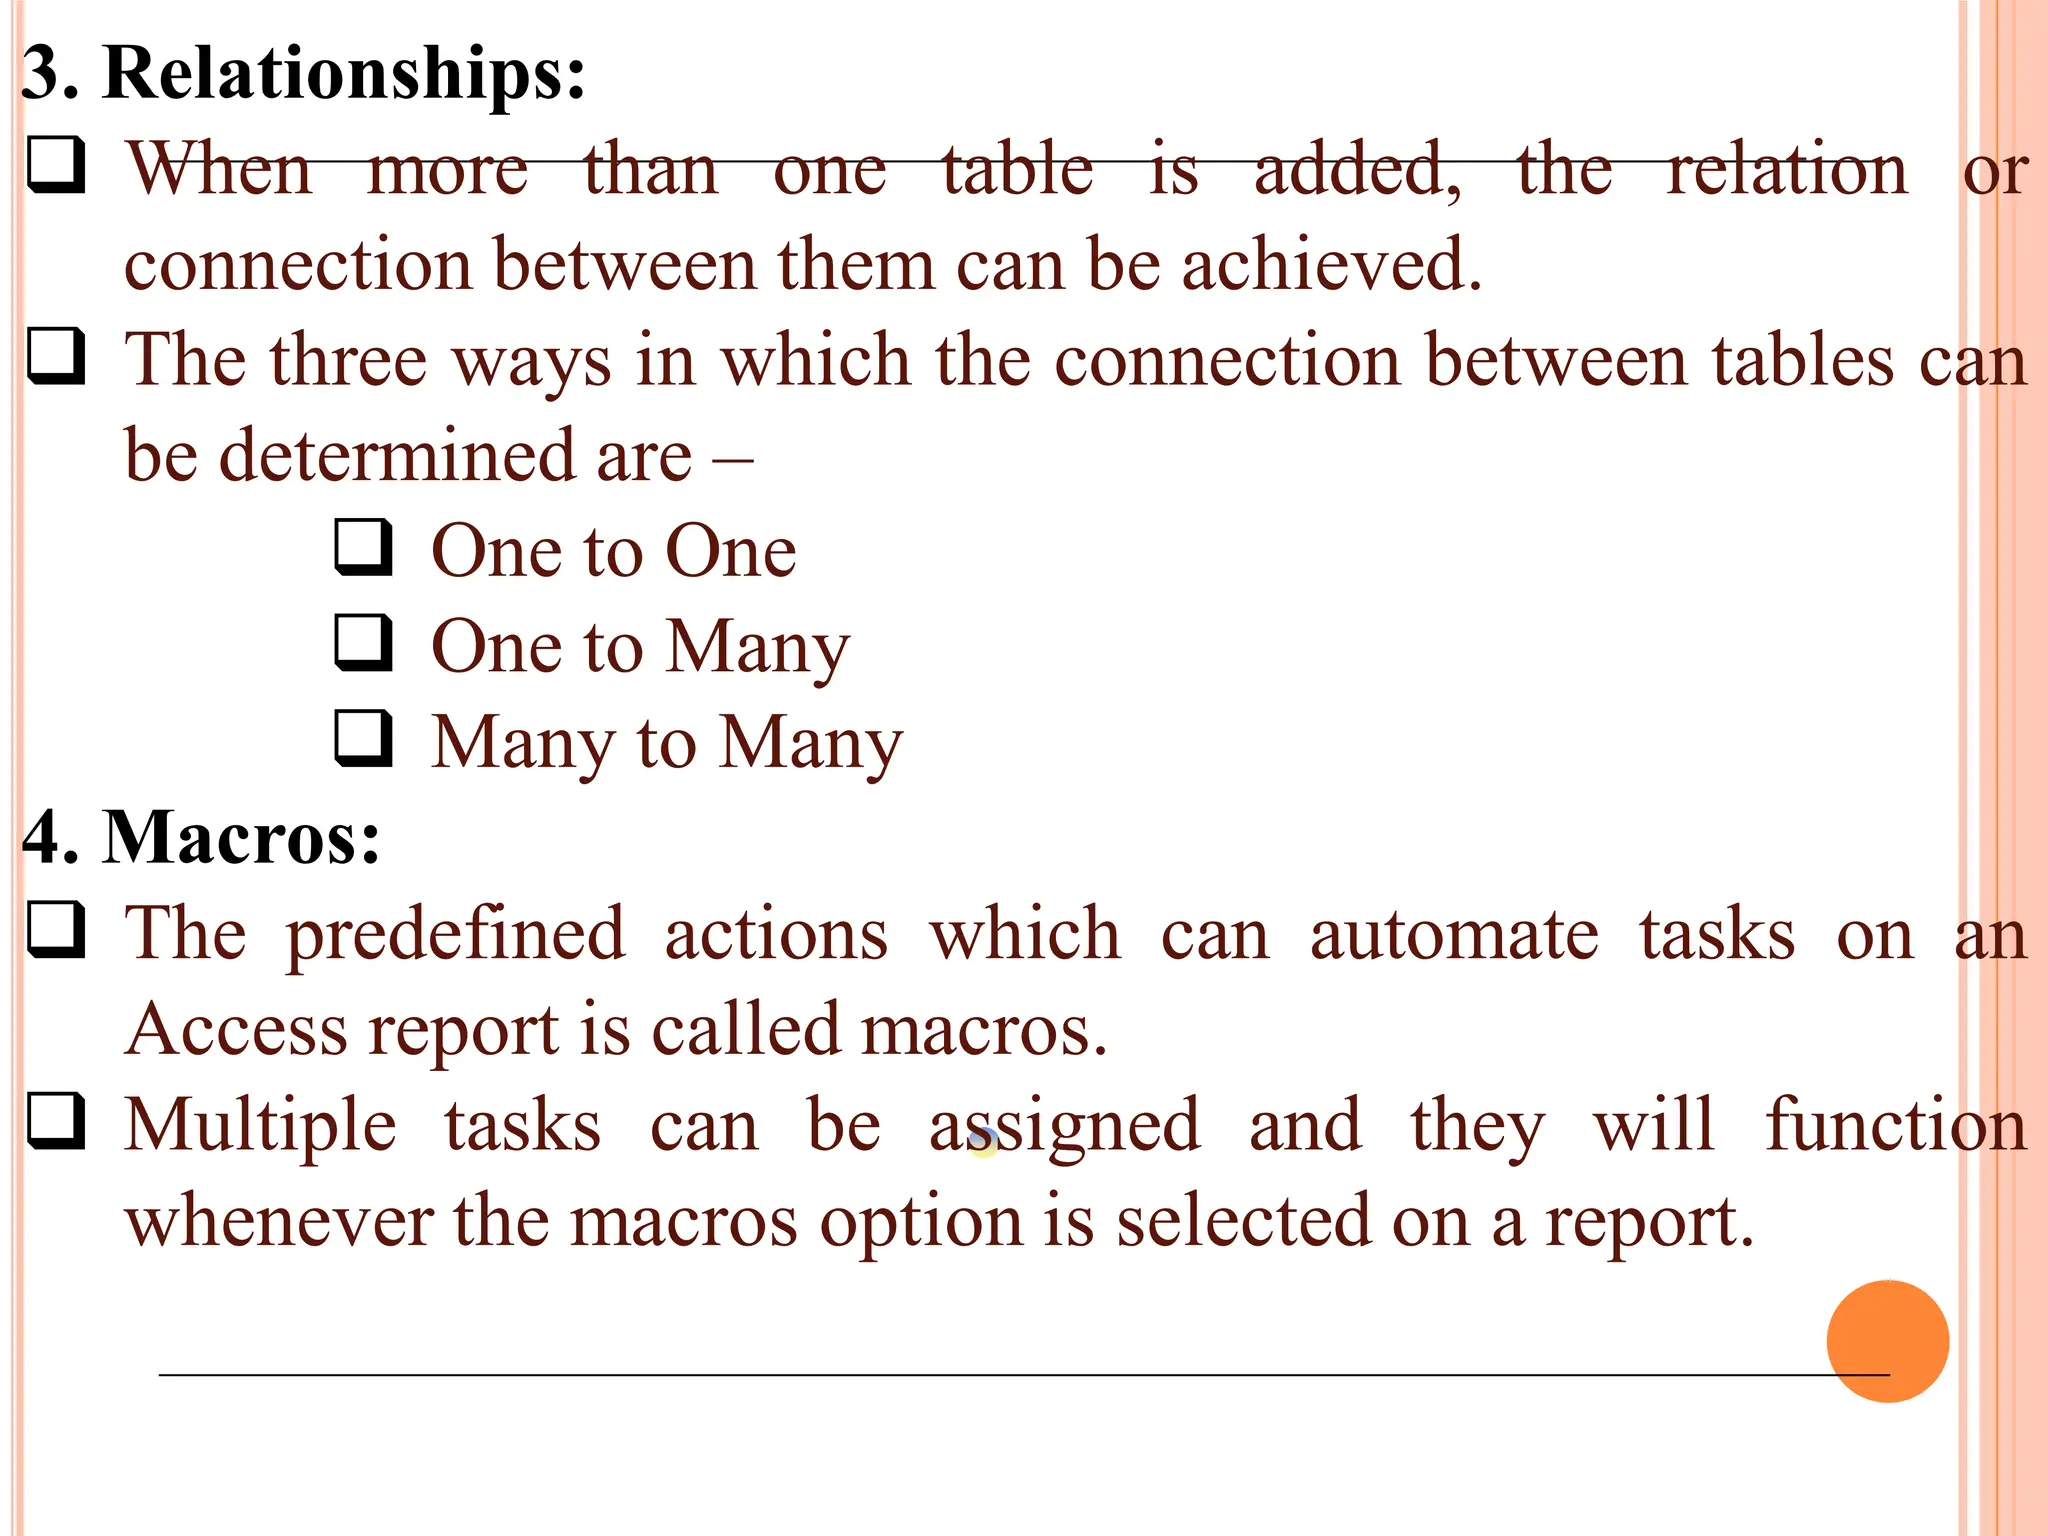
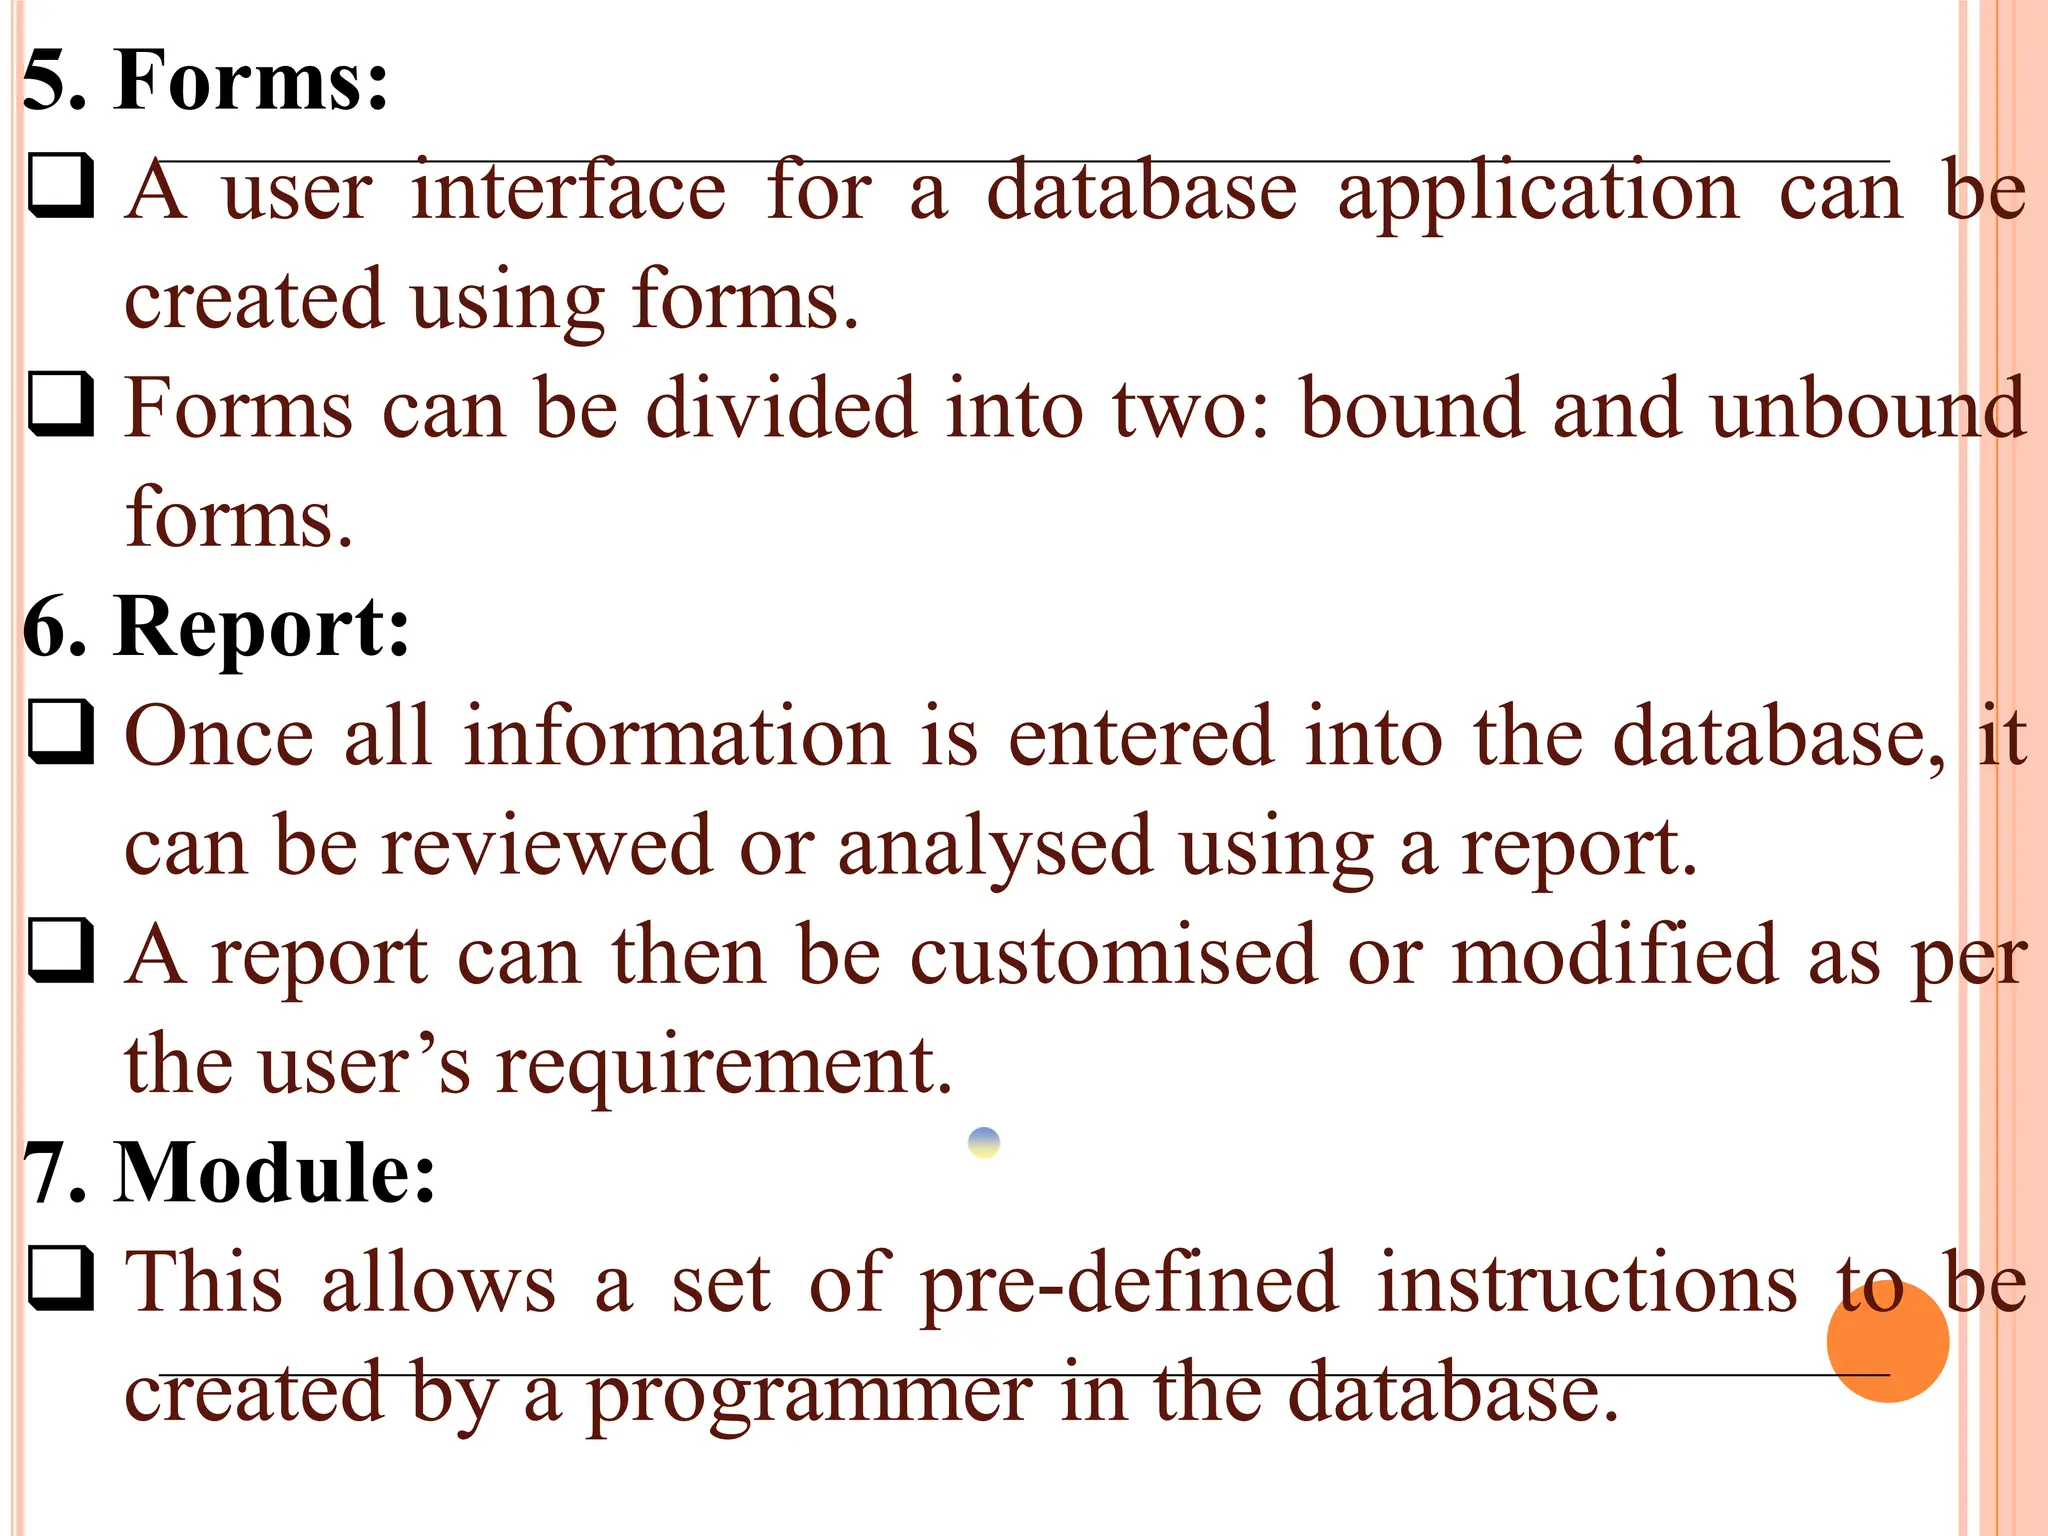
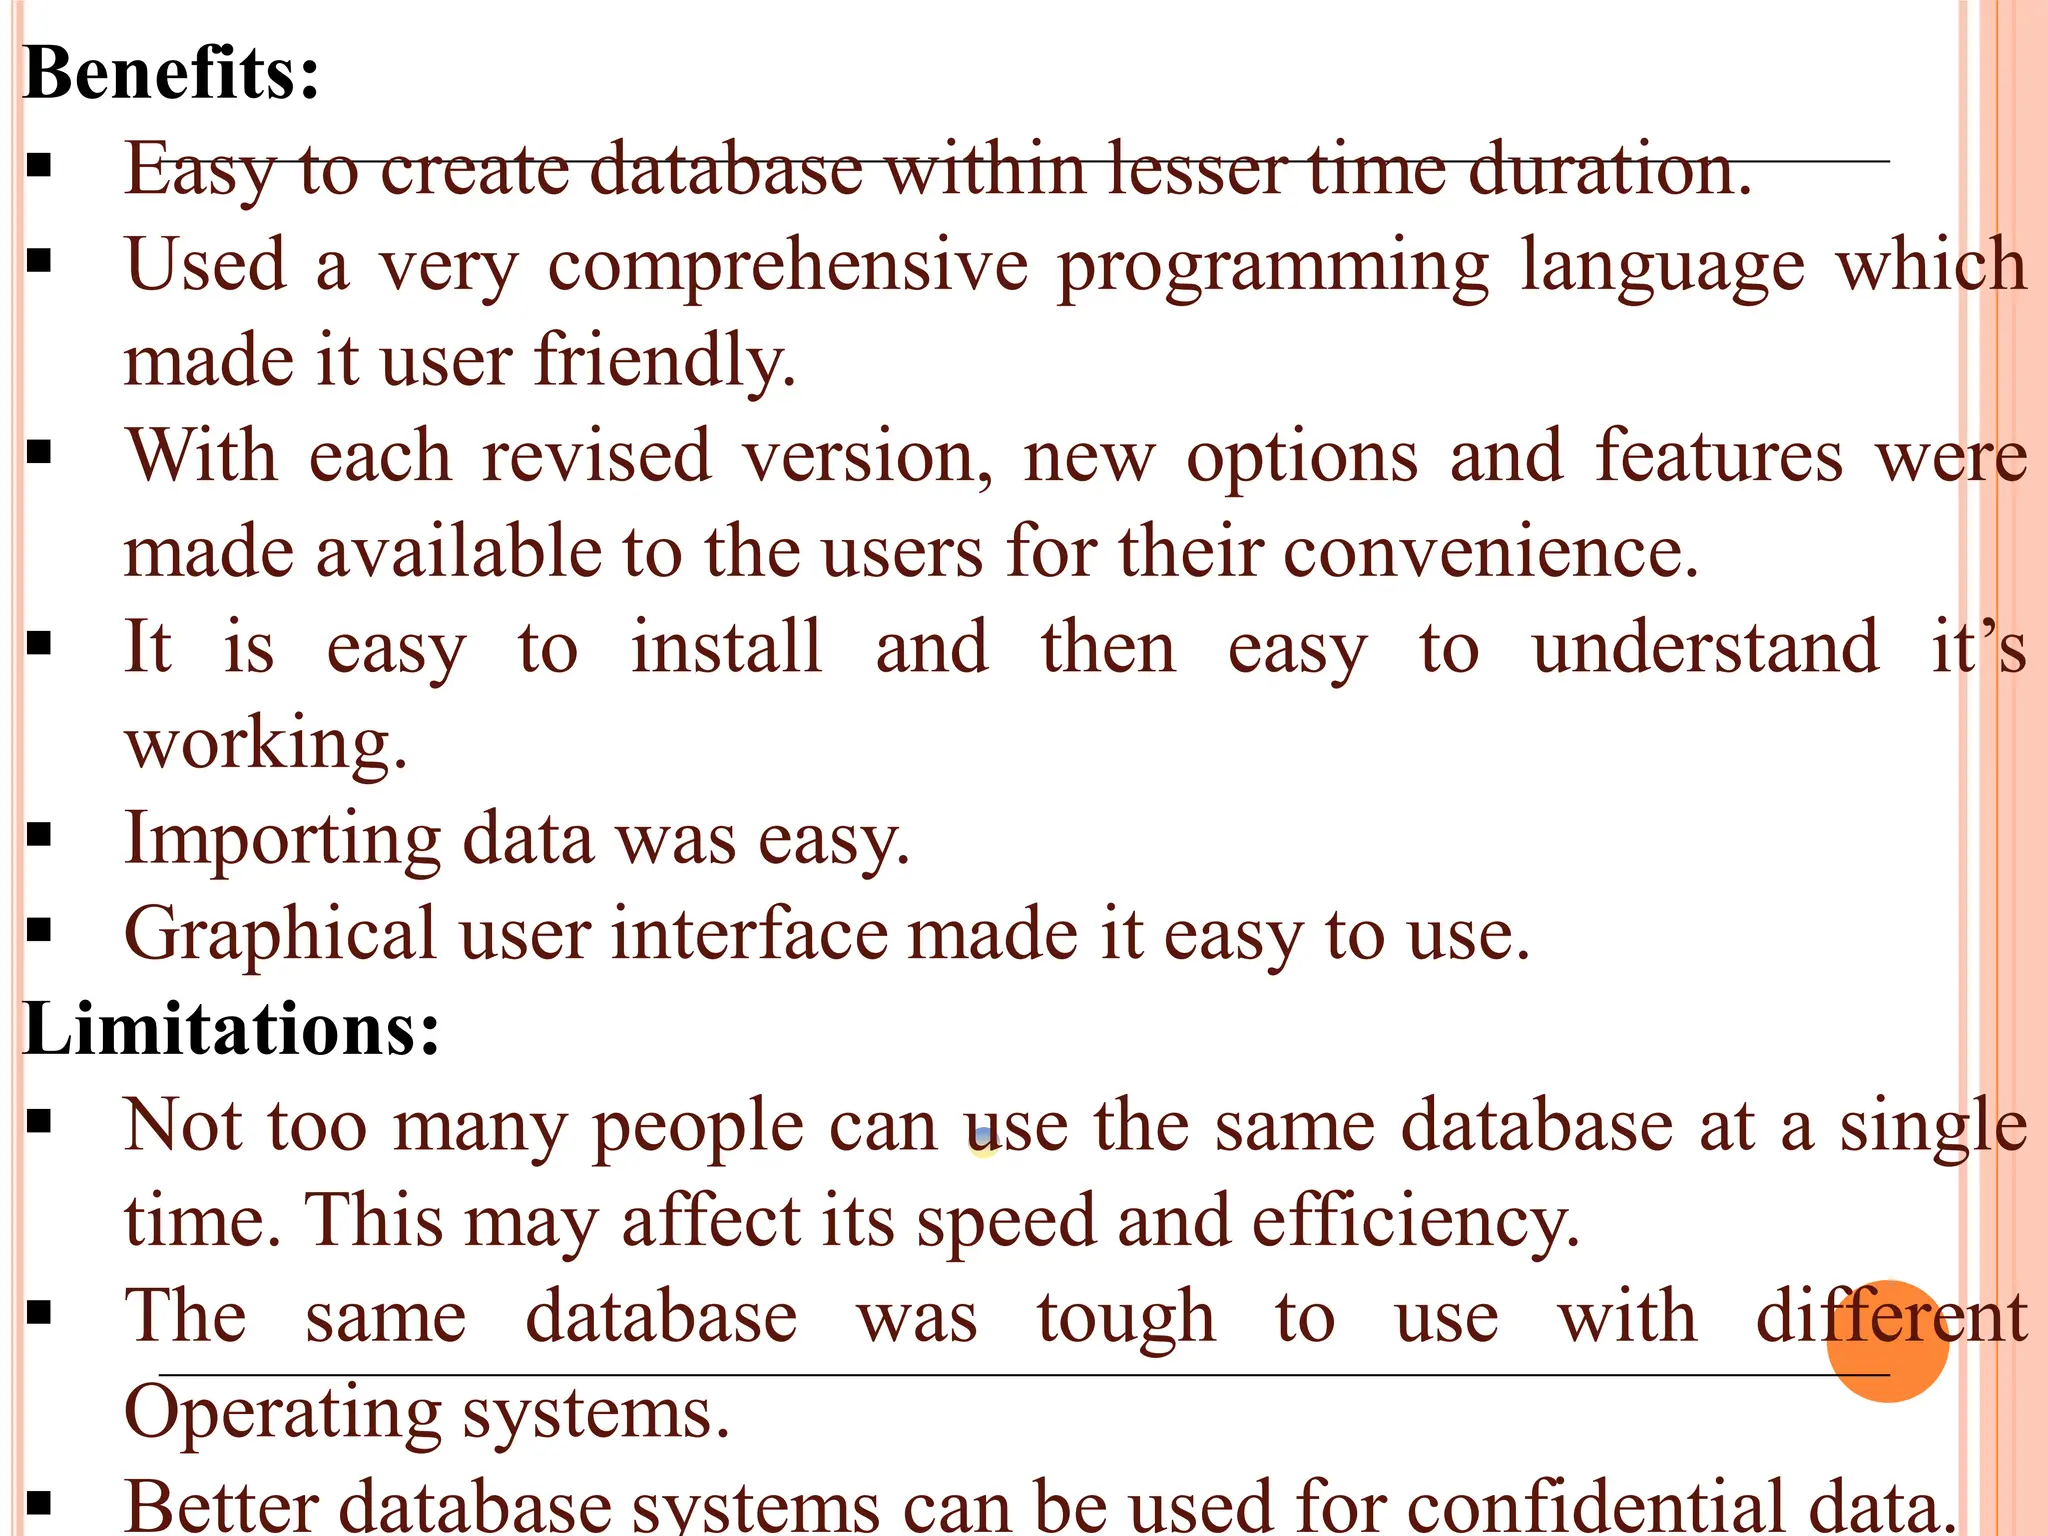
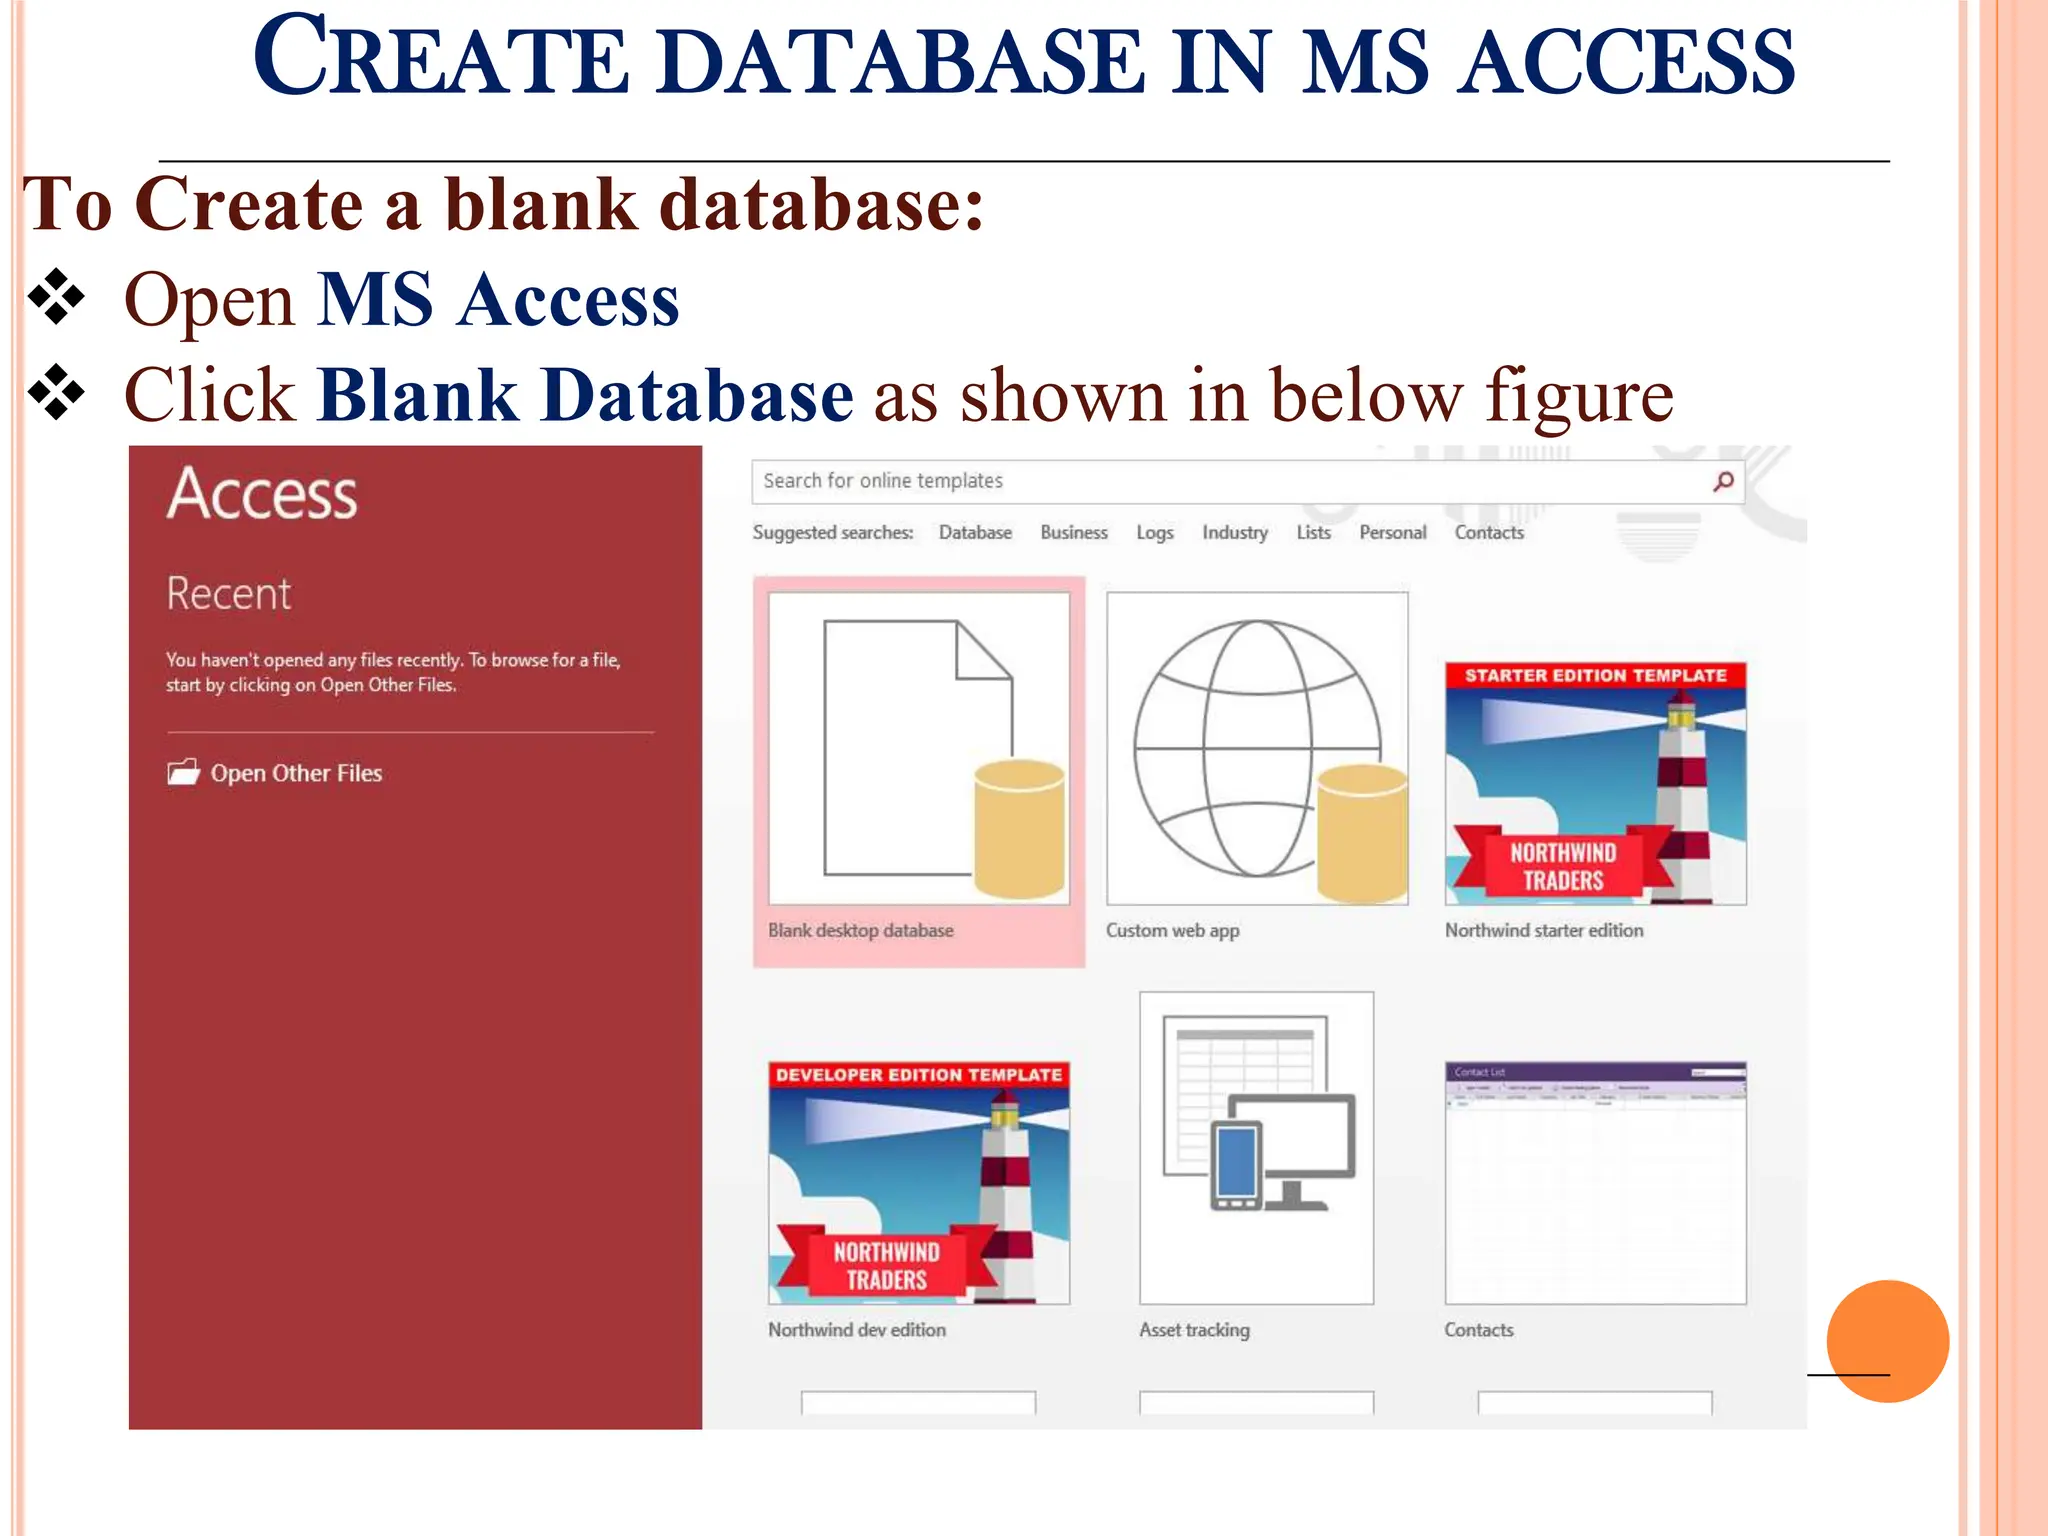
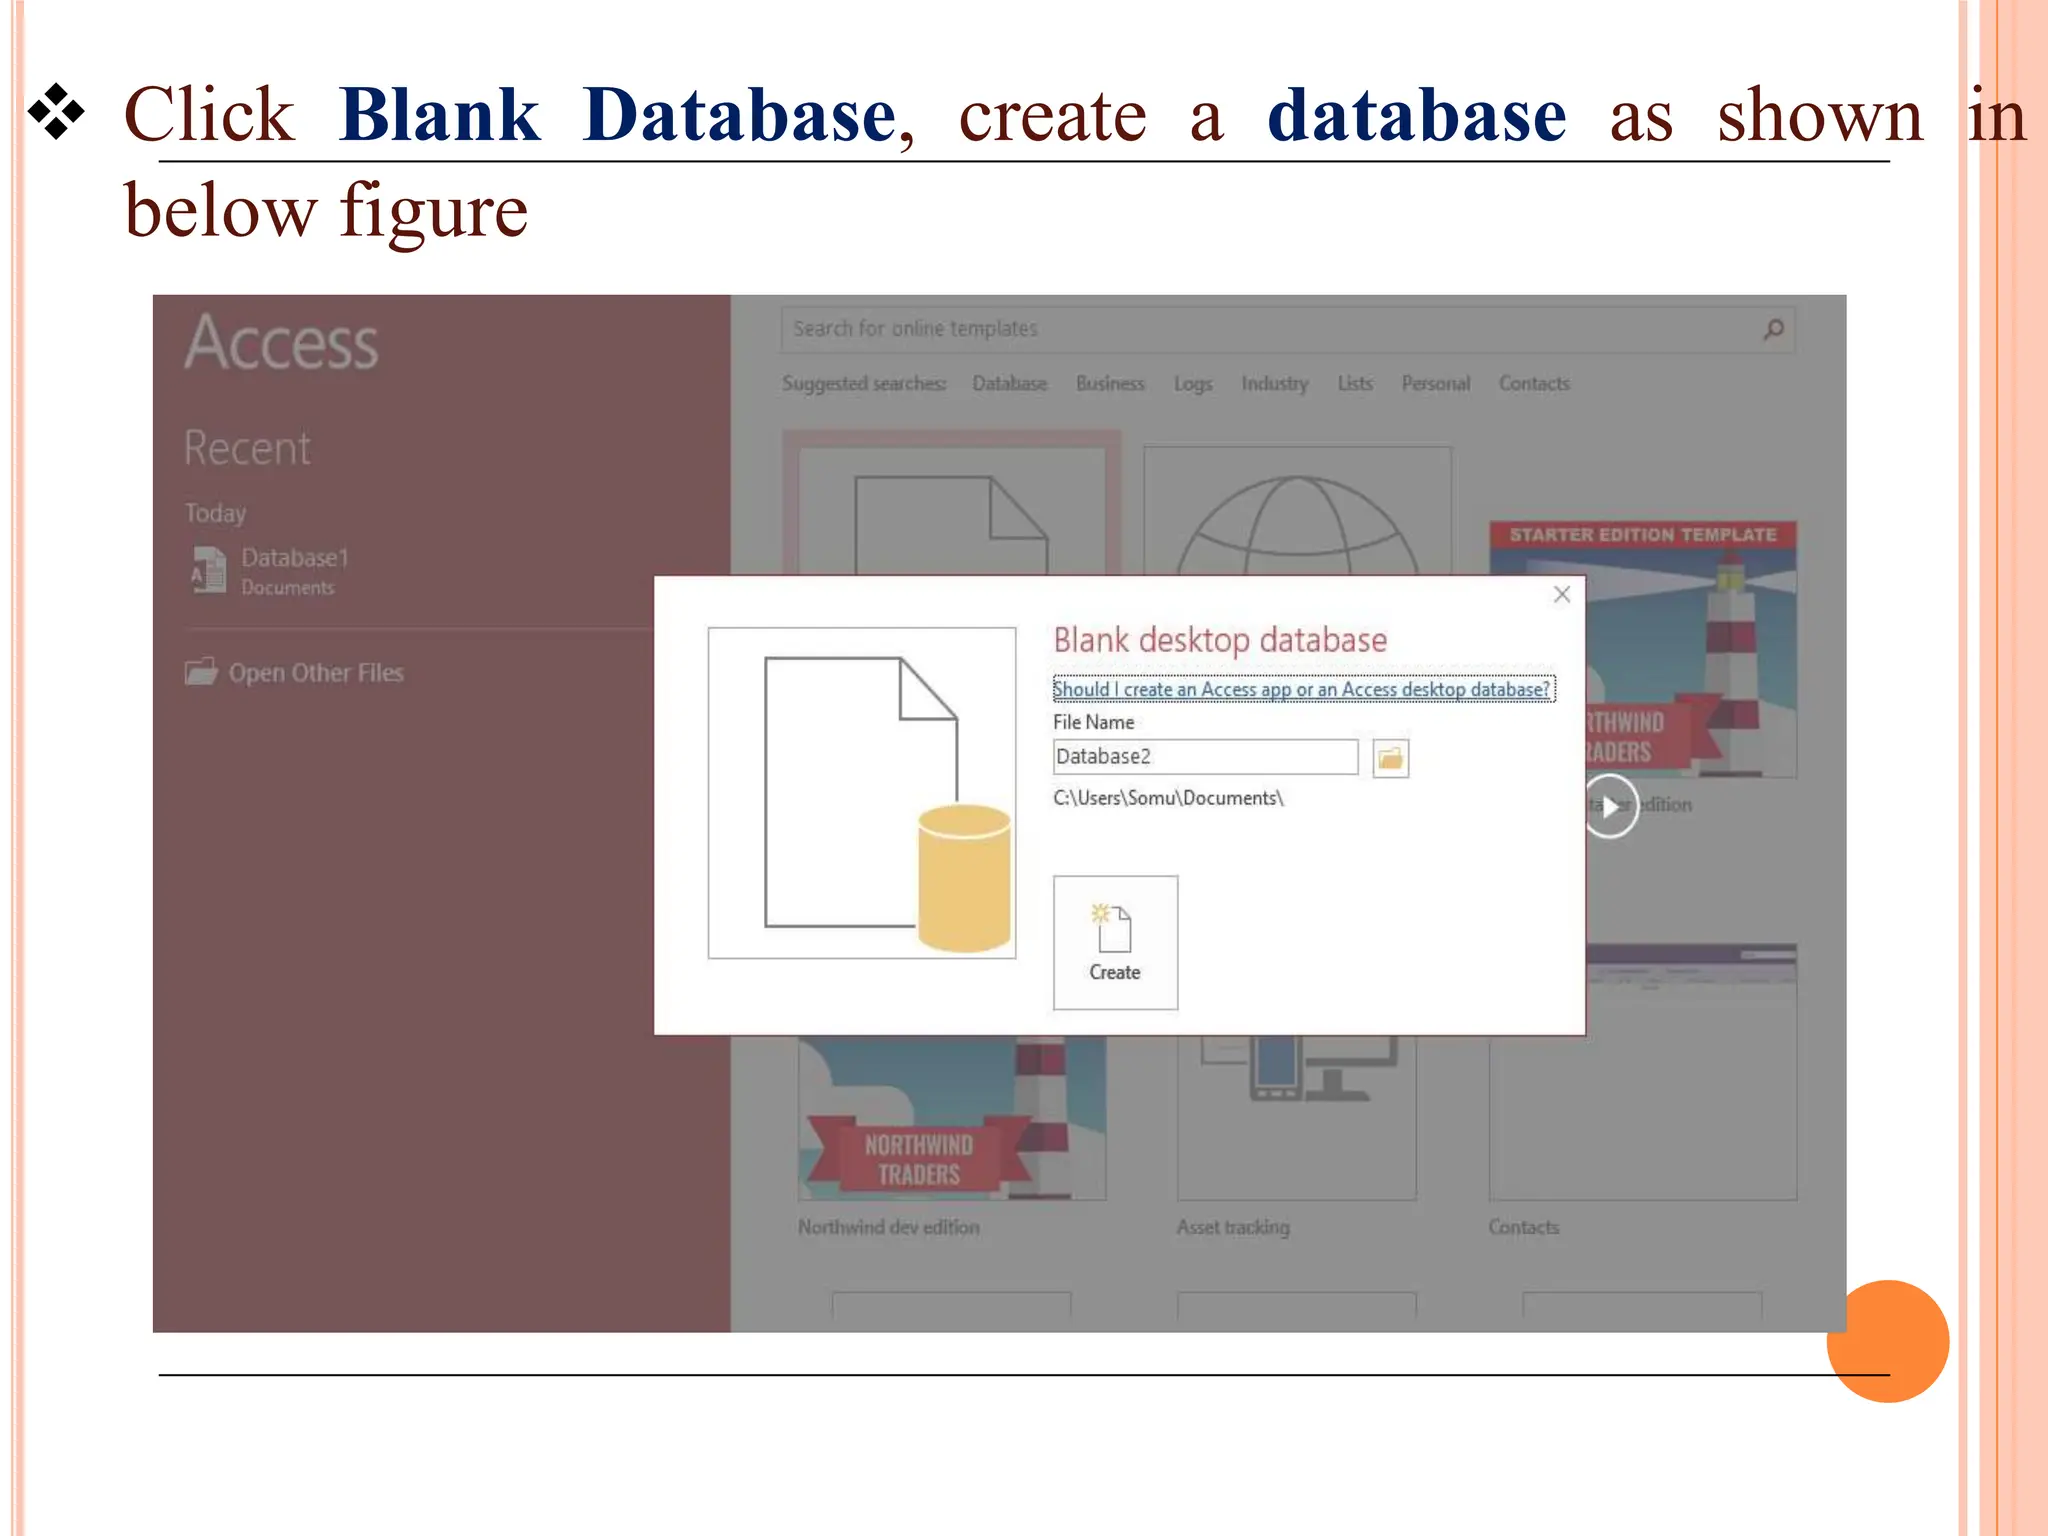
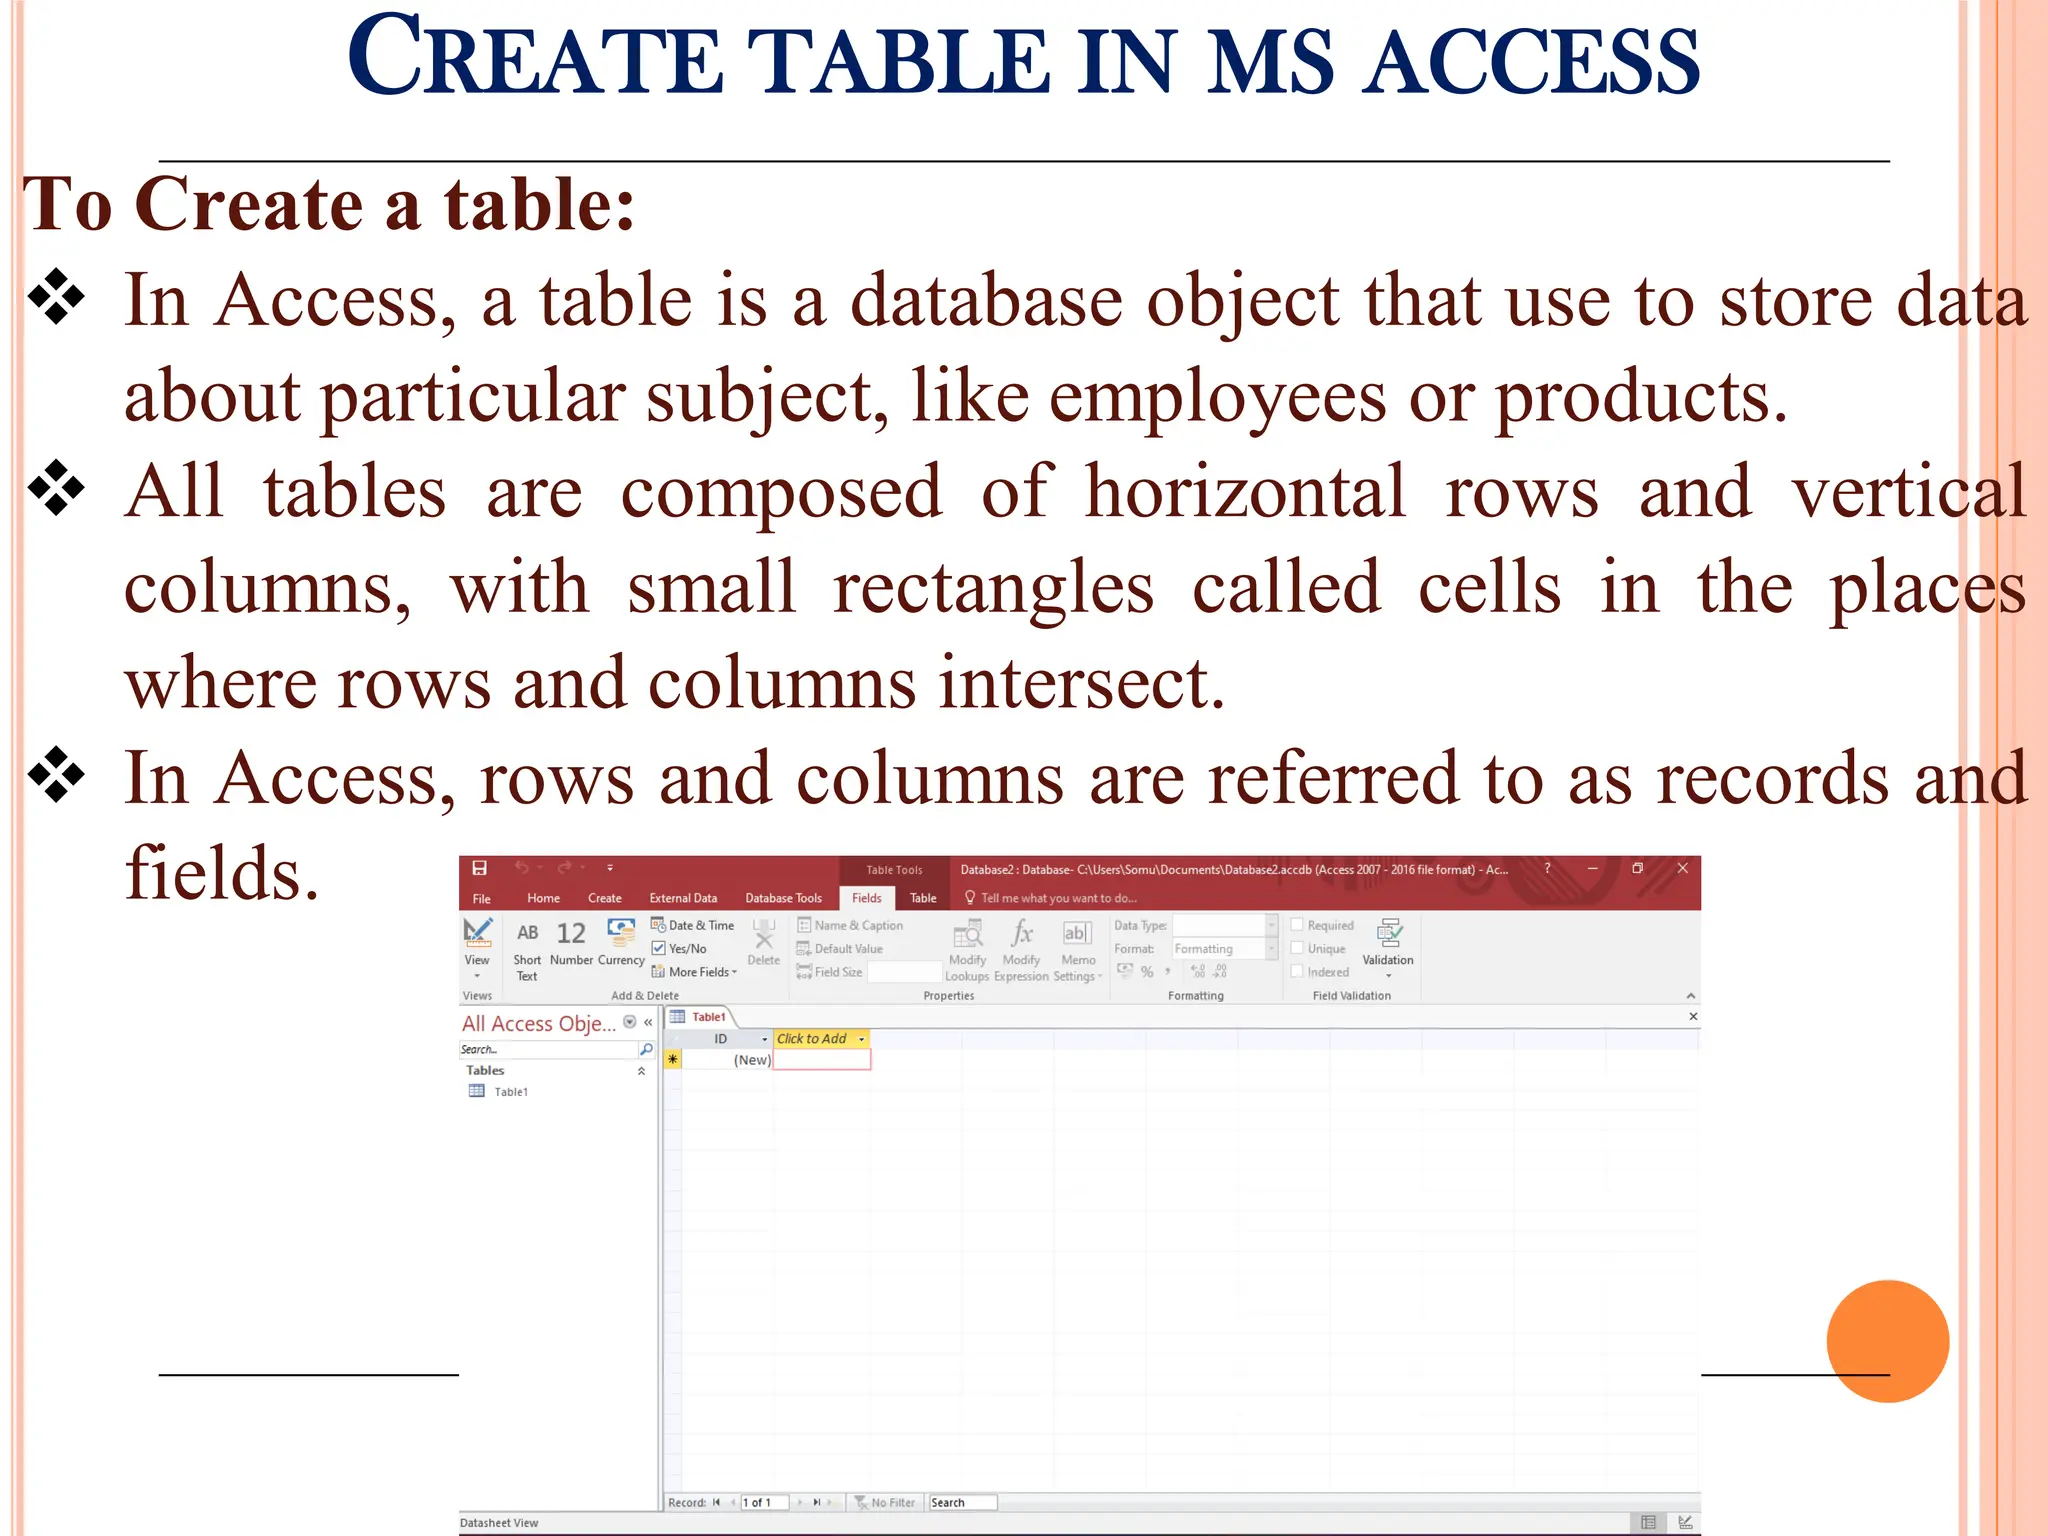
Overview of Microsoft Access as a DBMS tool for organizing and managing data with its major components and functionalities.
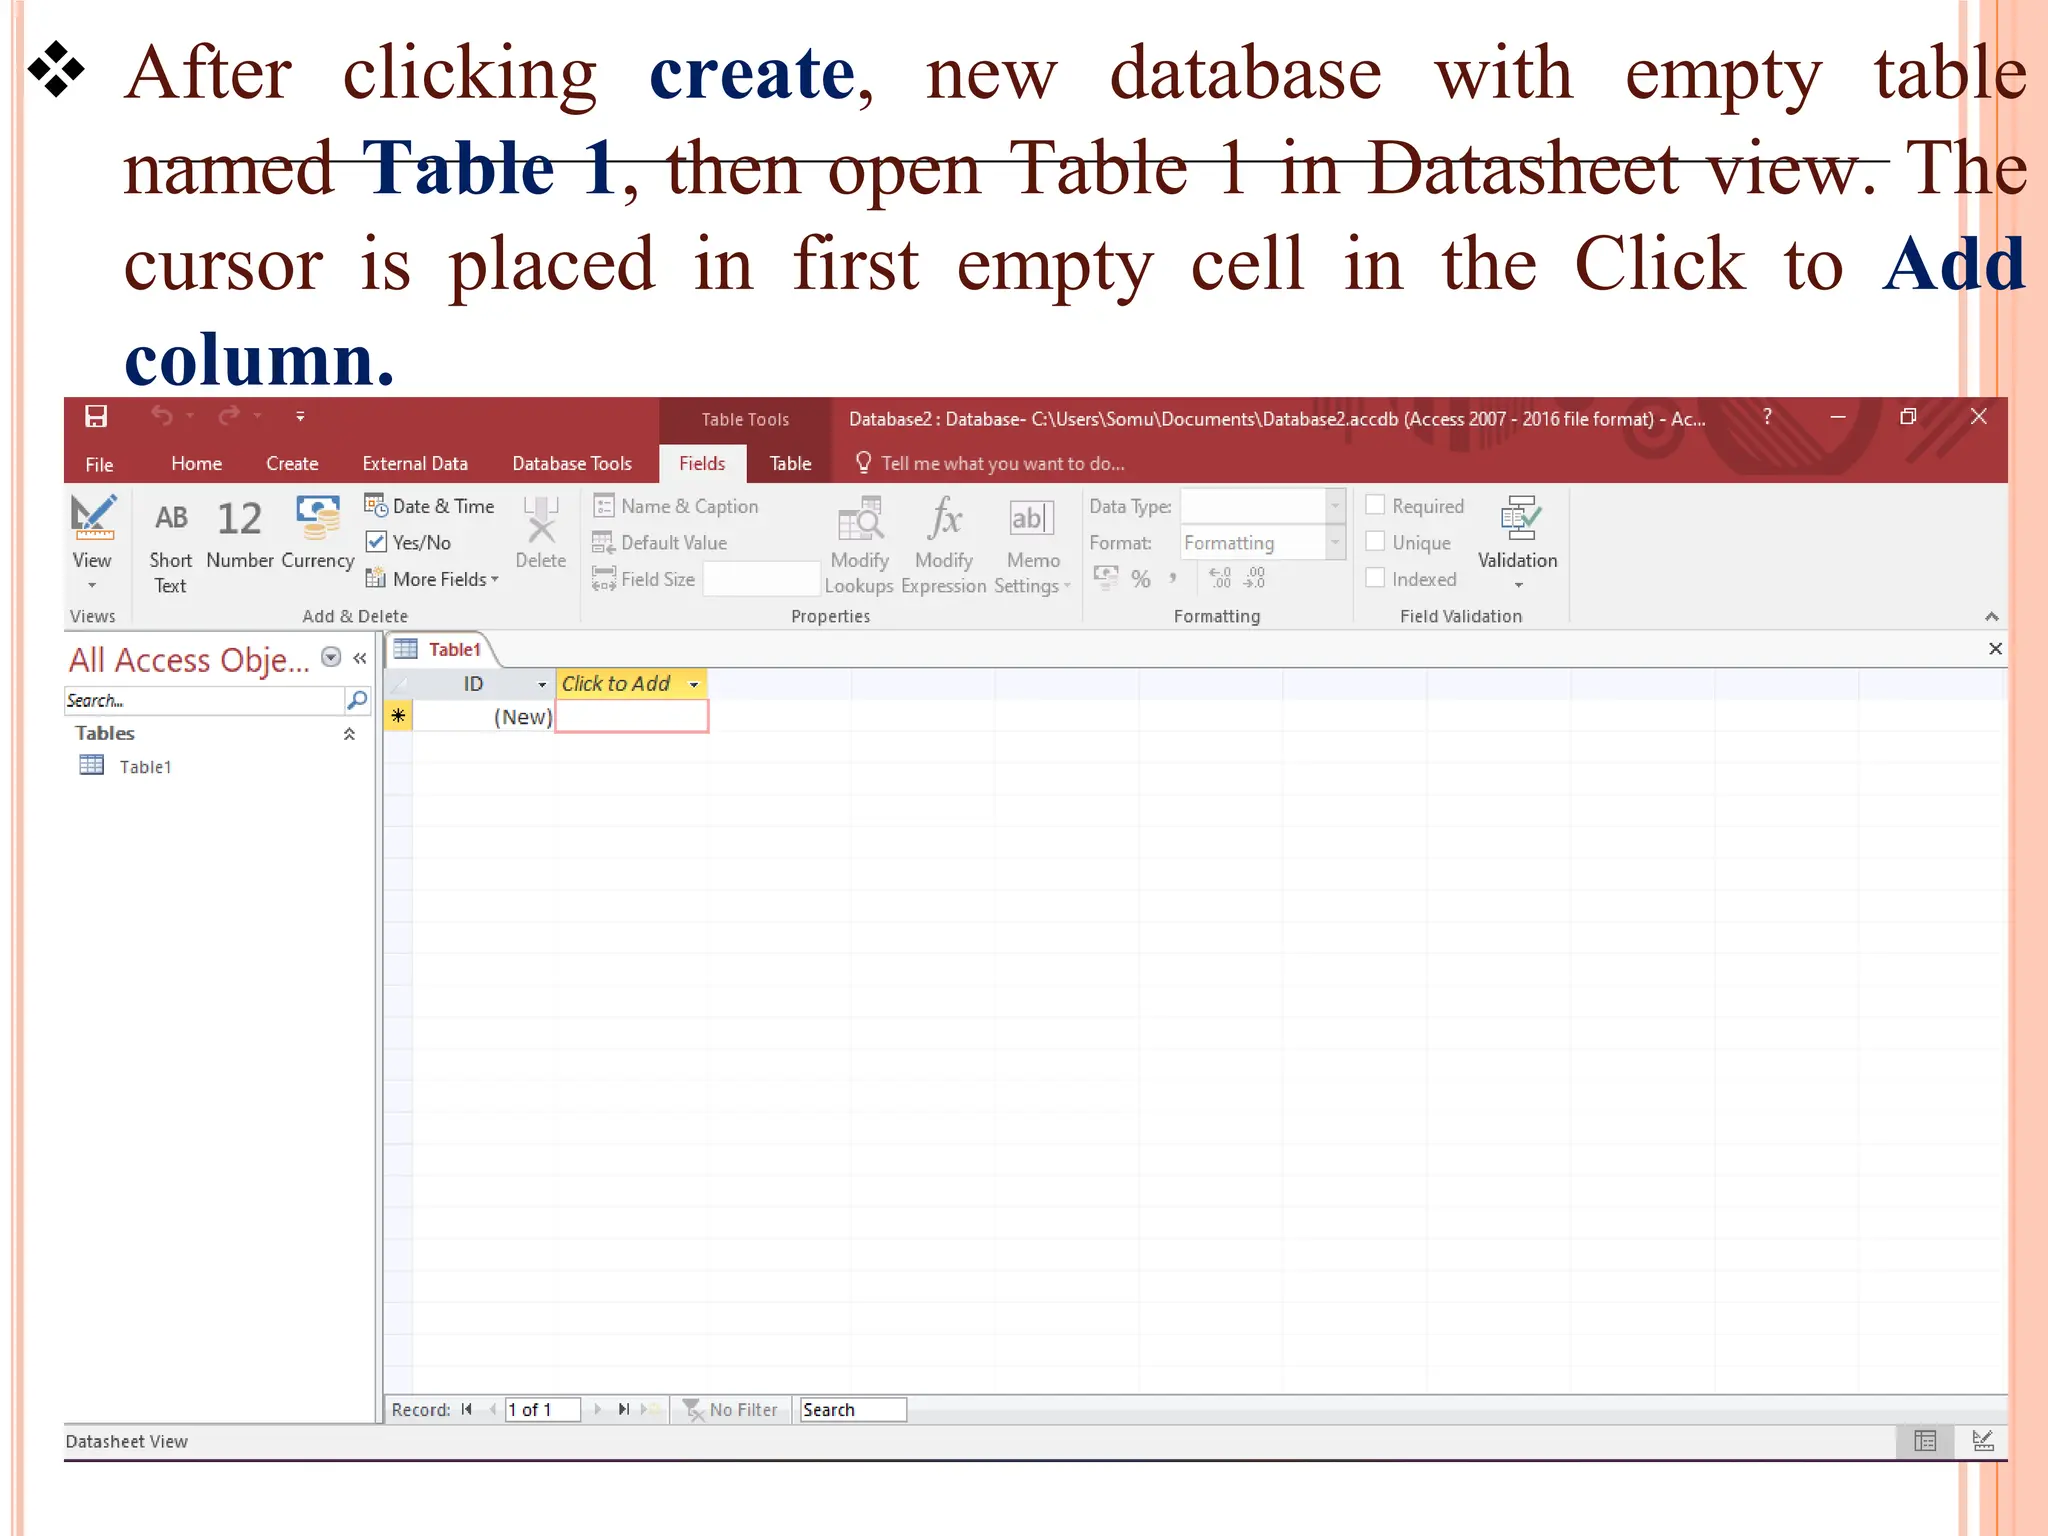
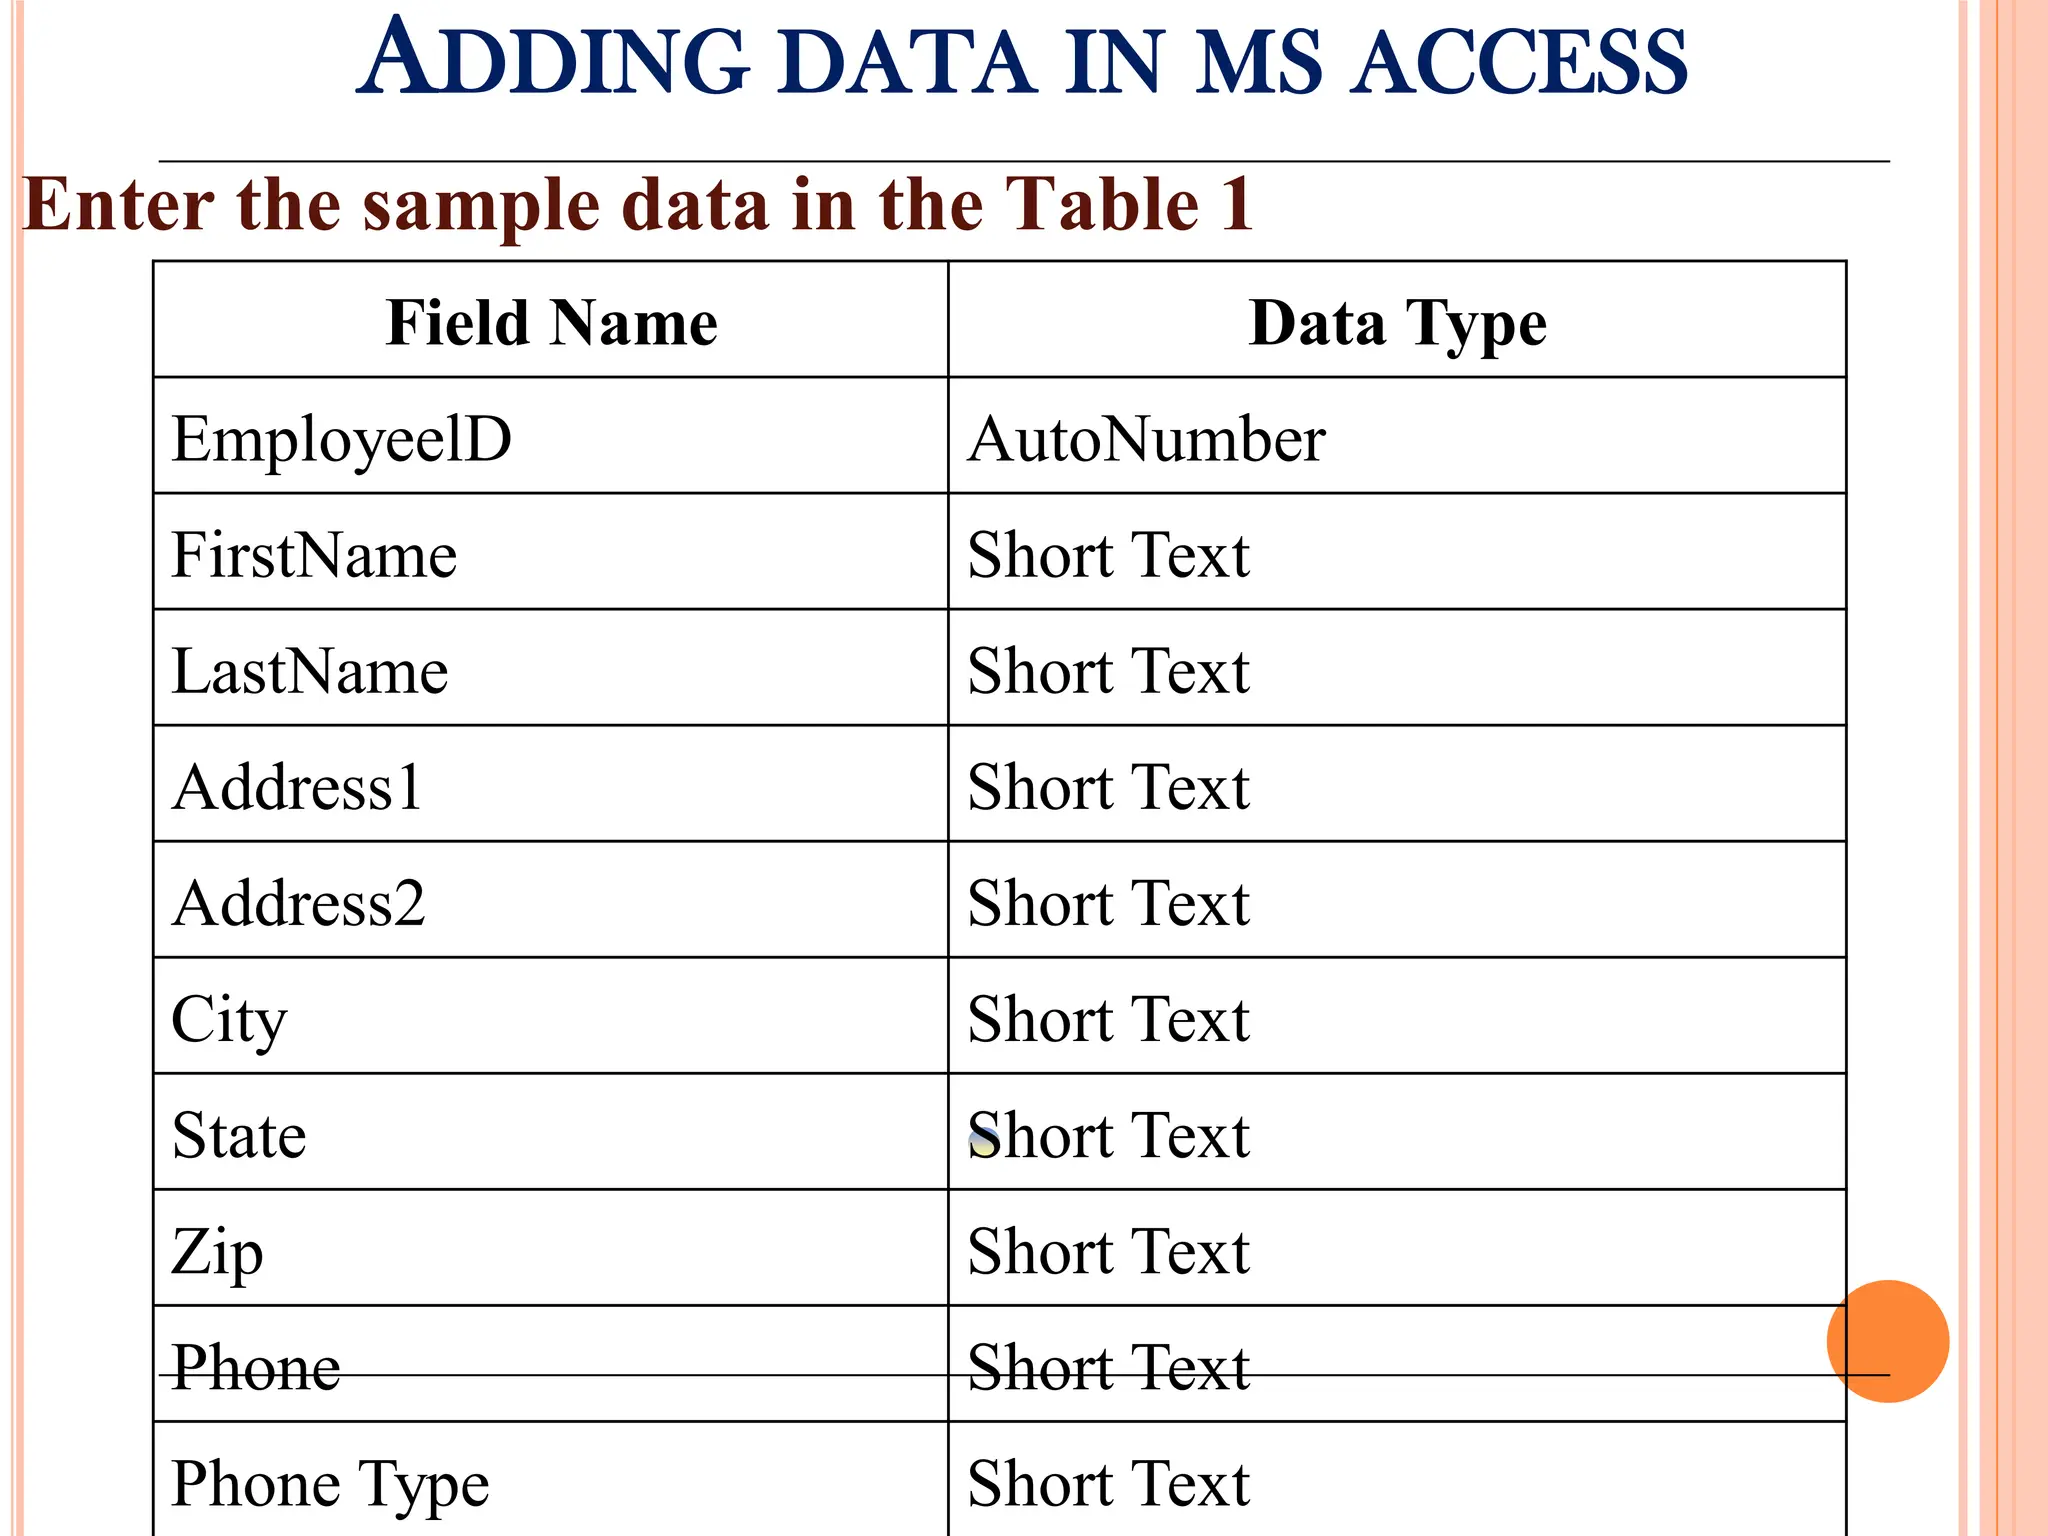
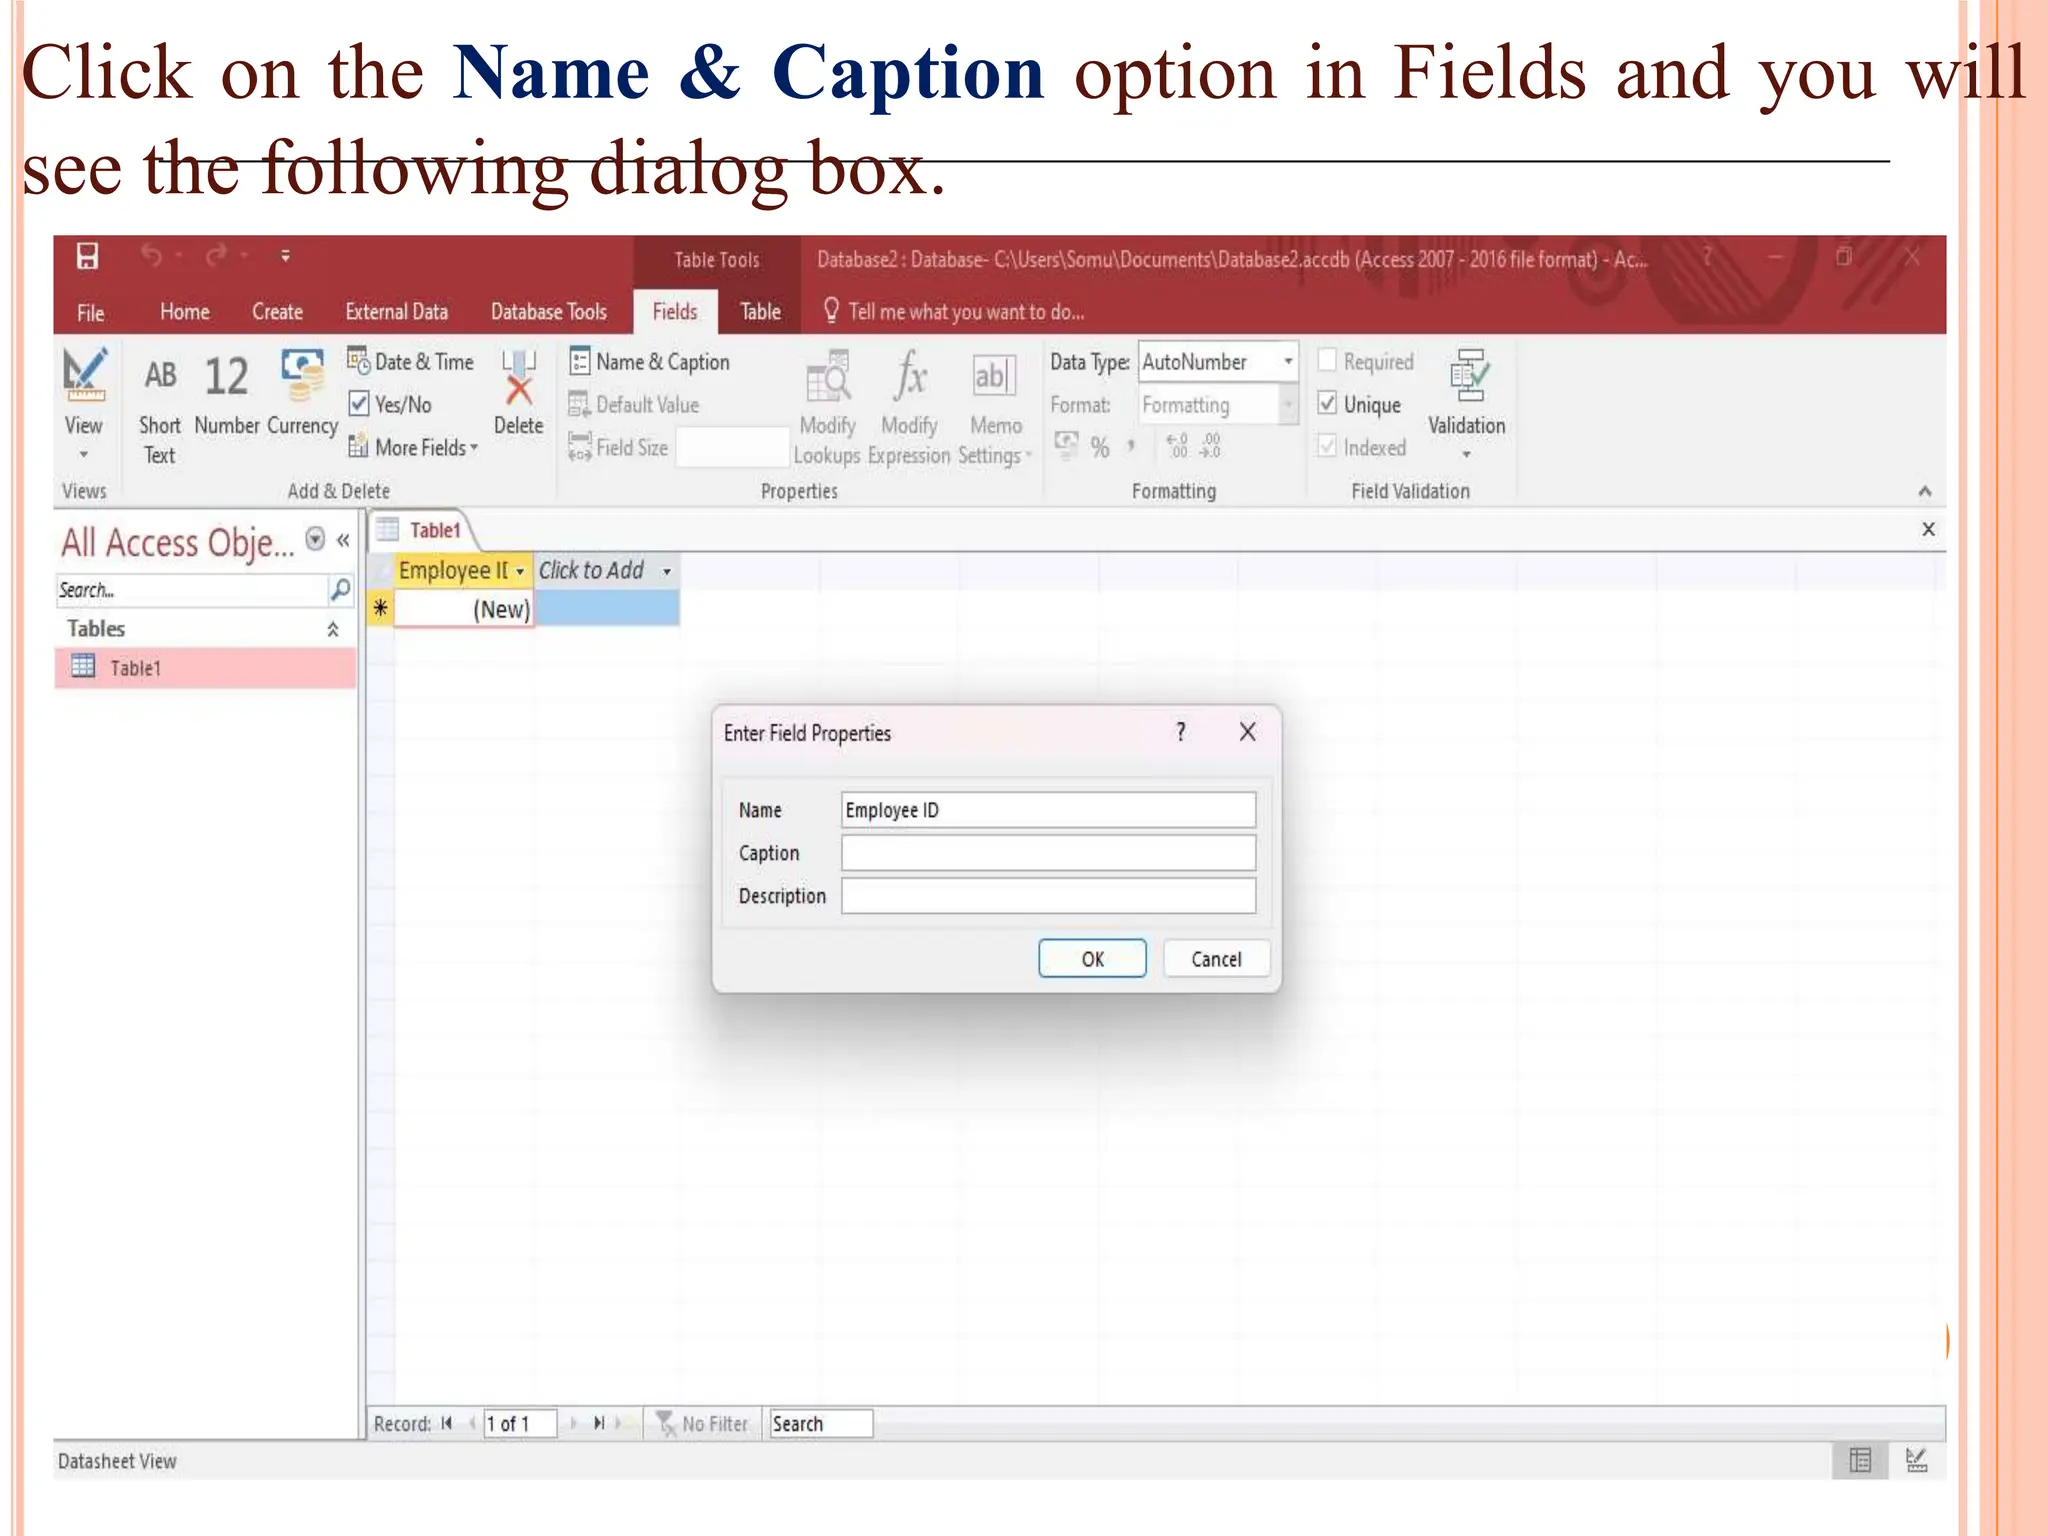
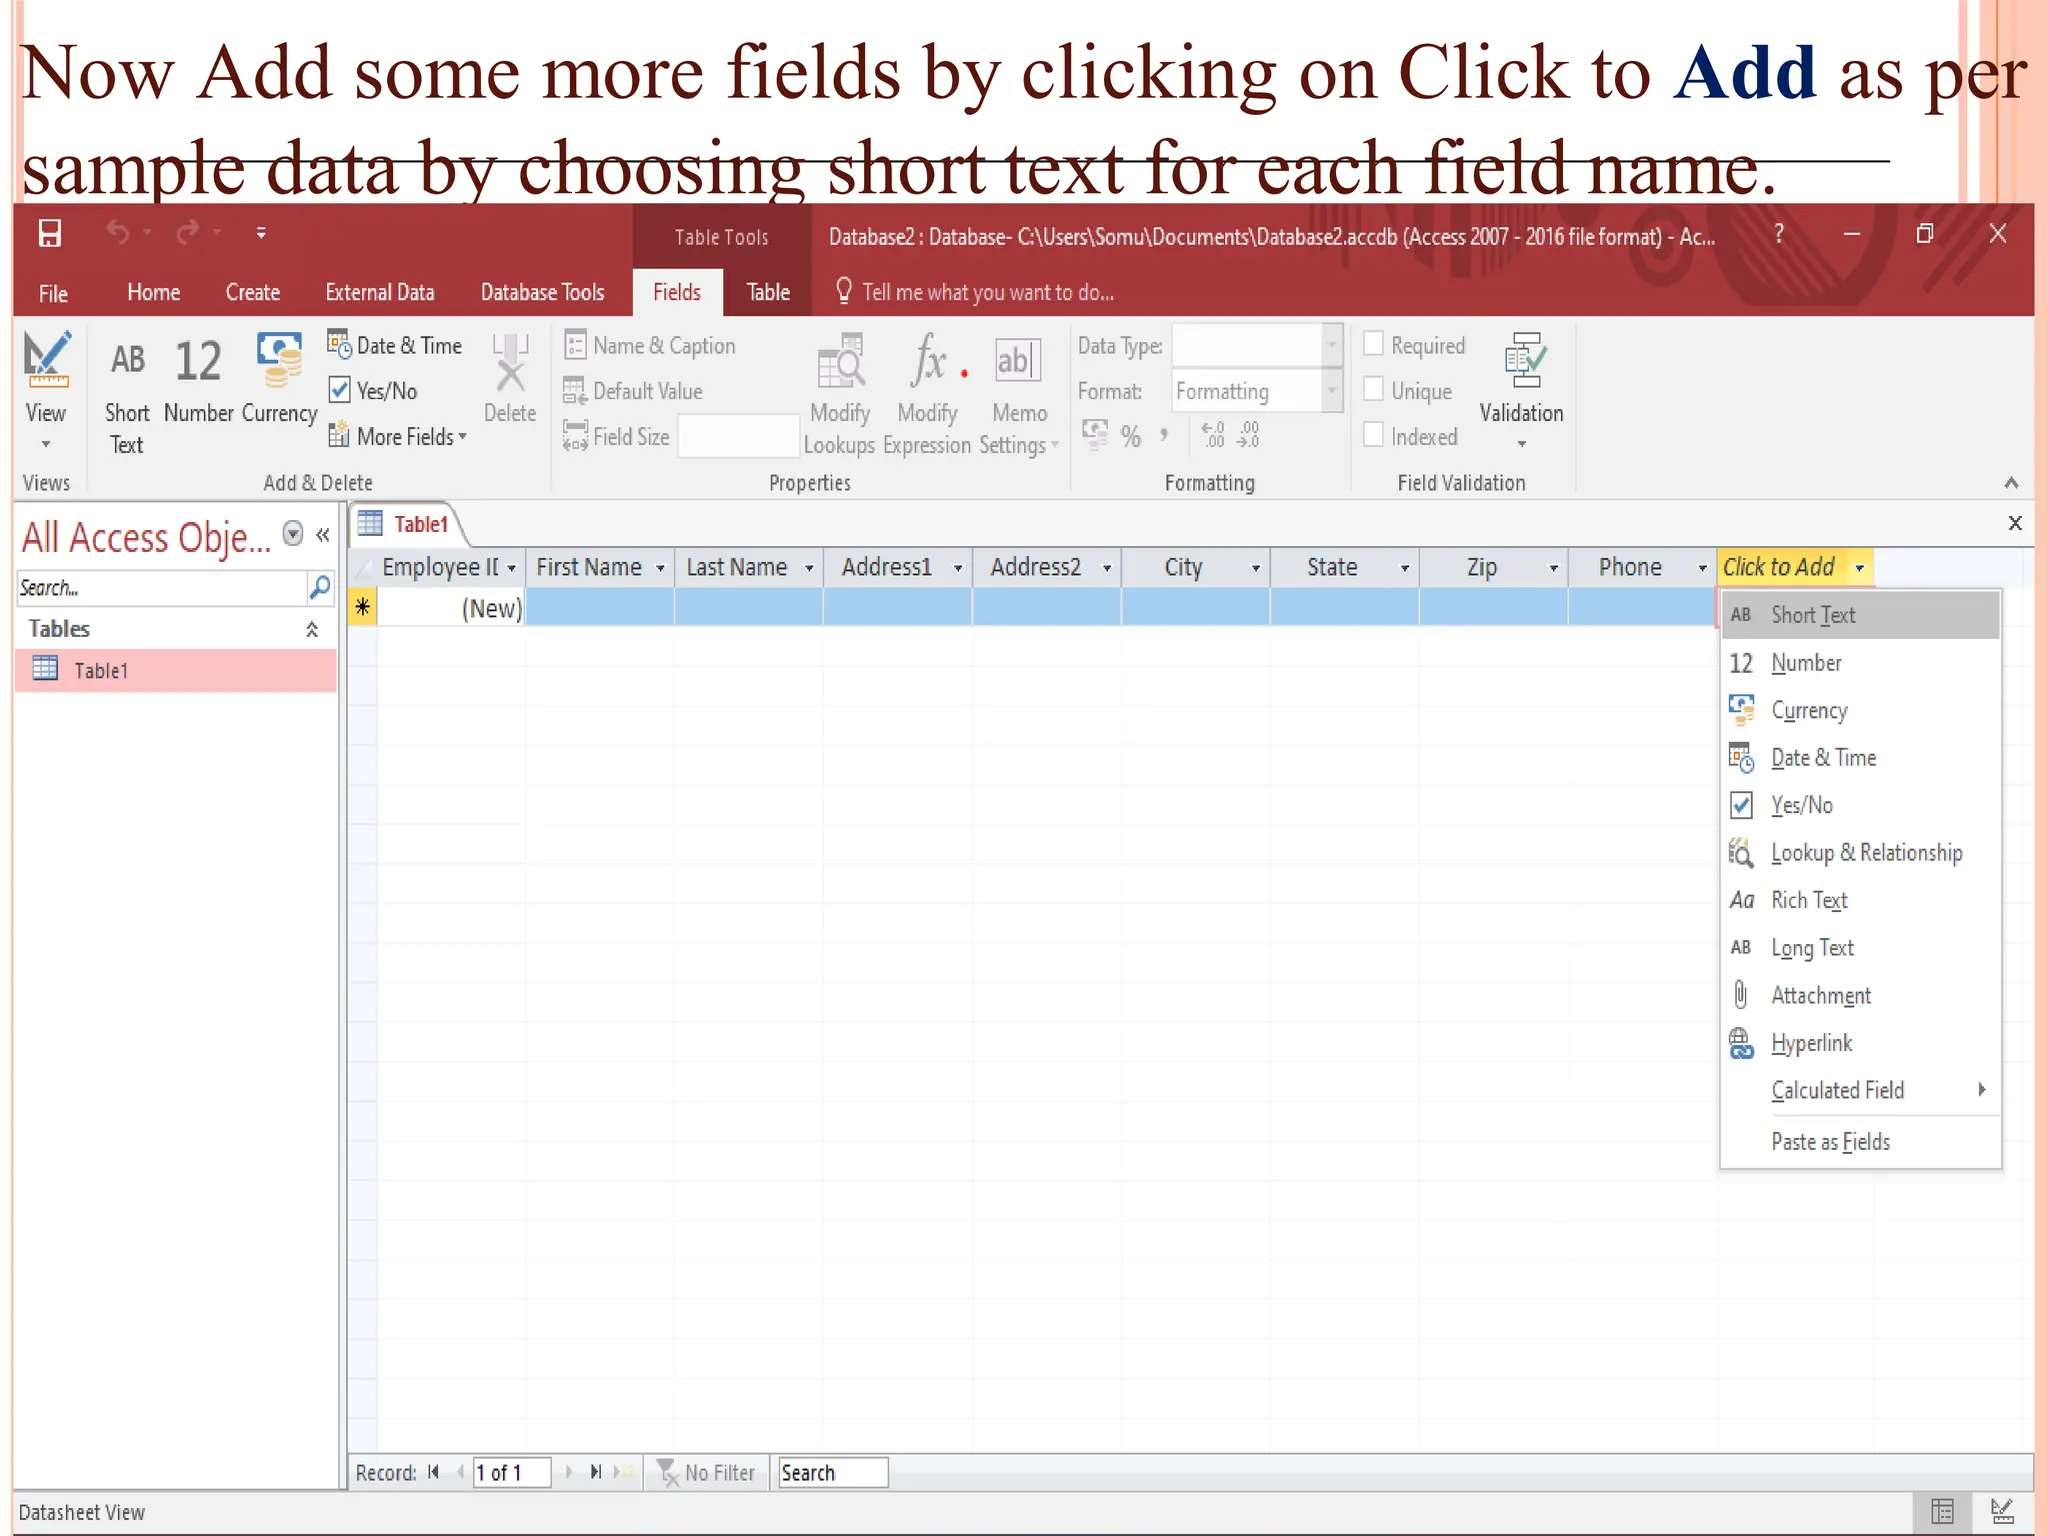
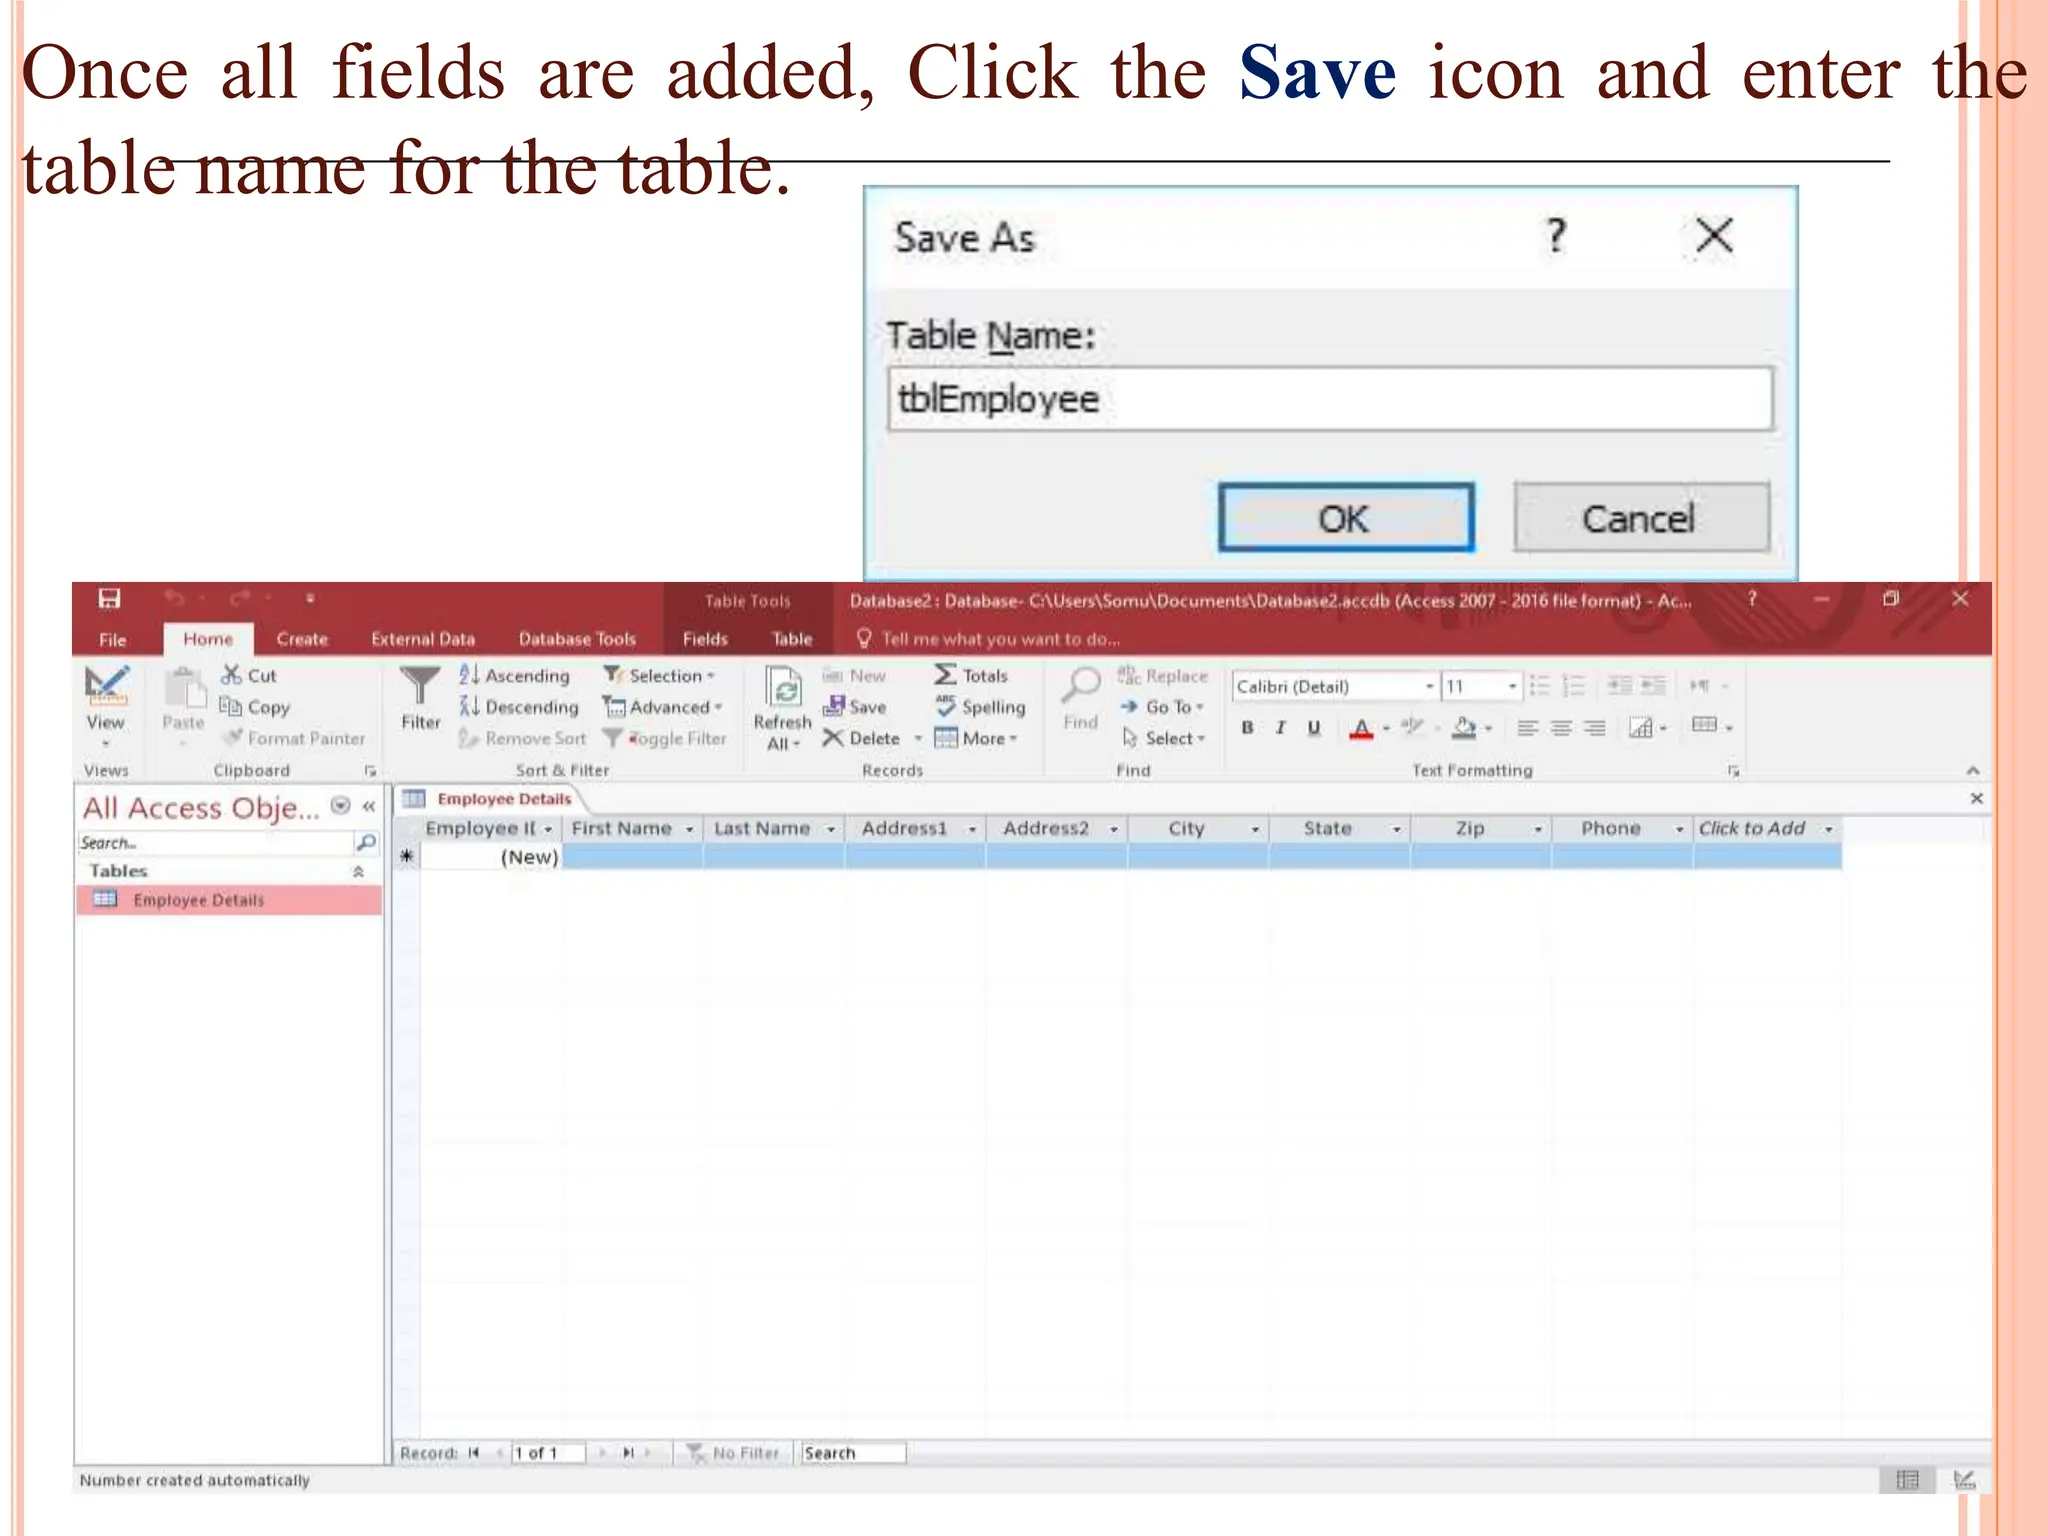
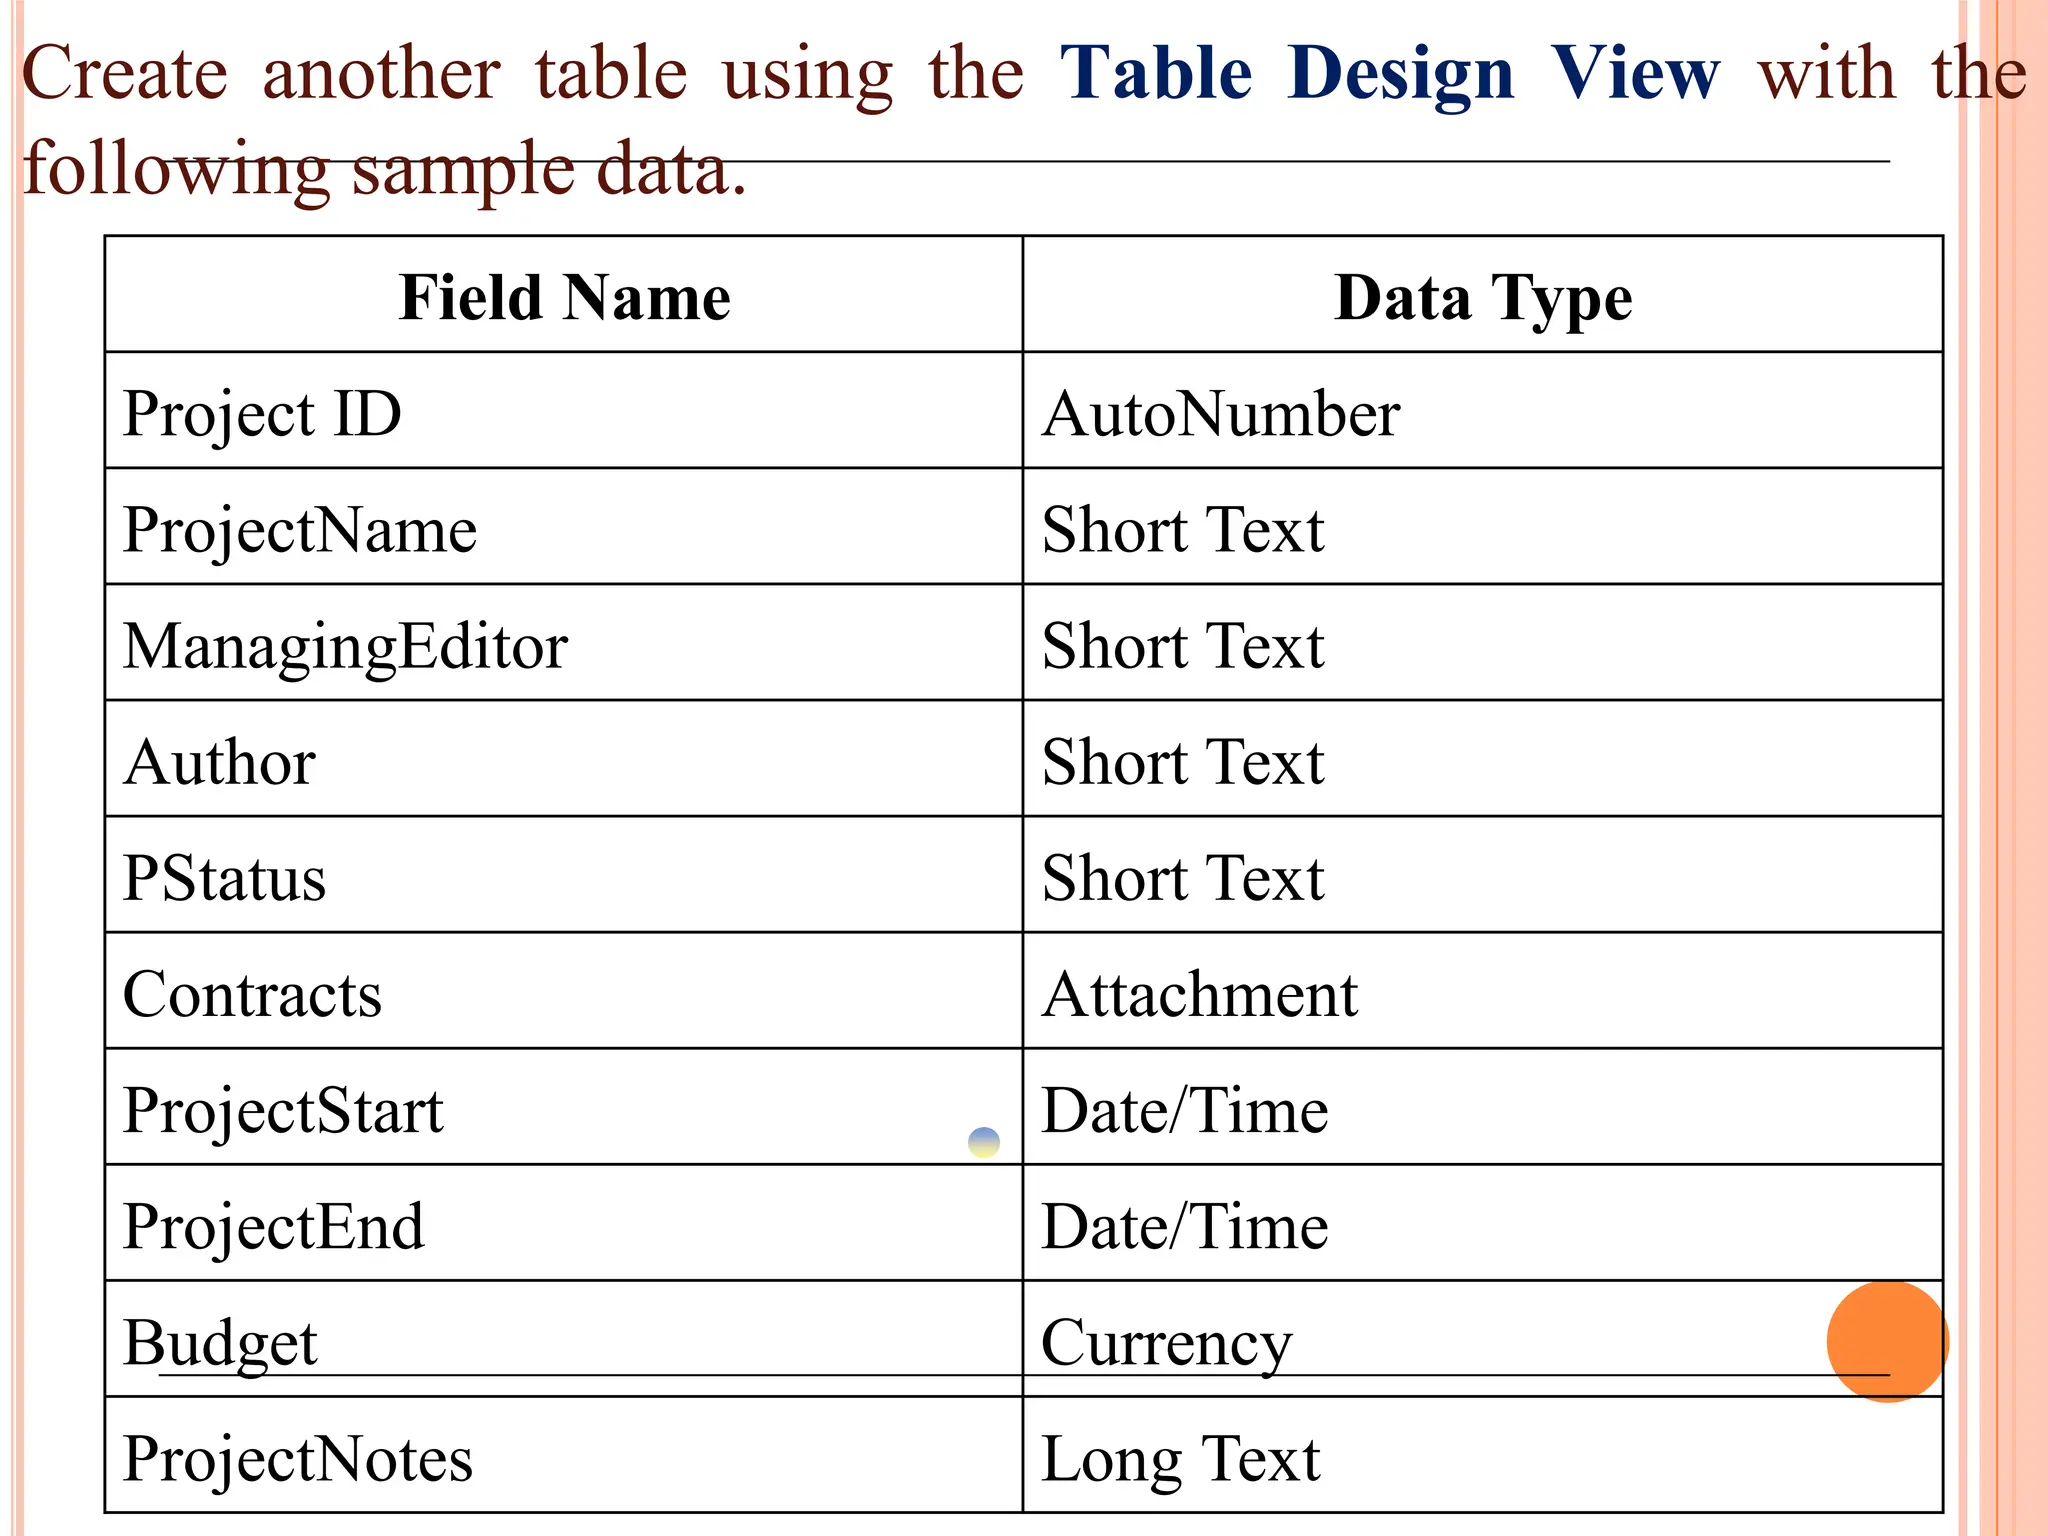
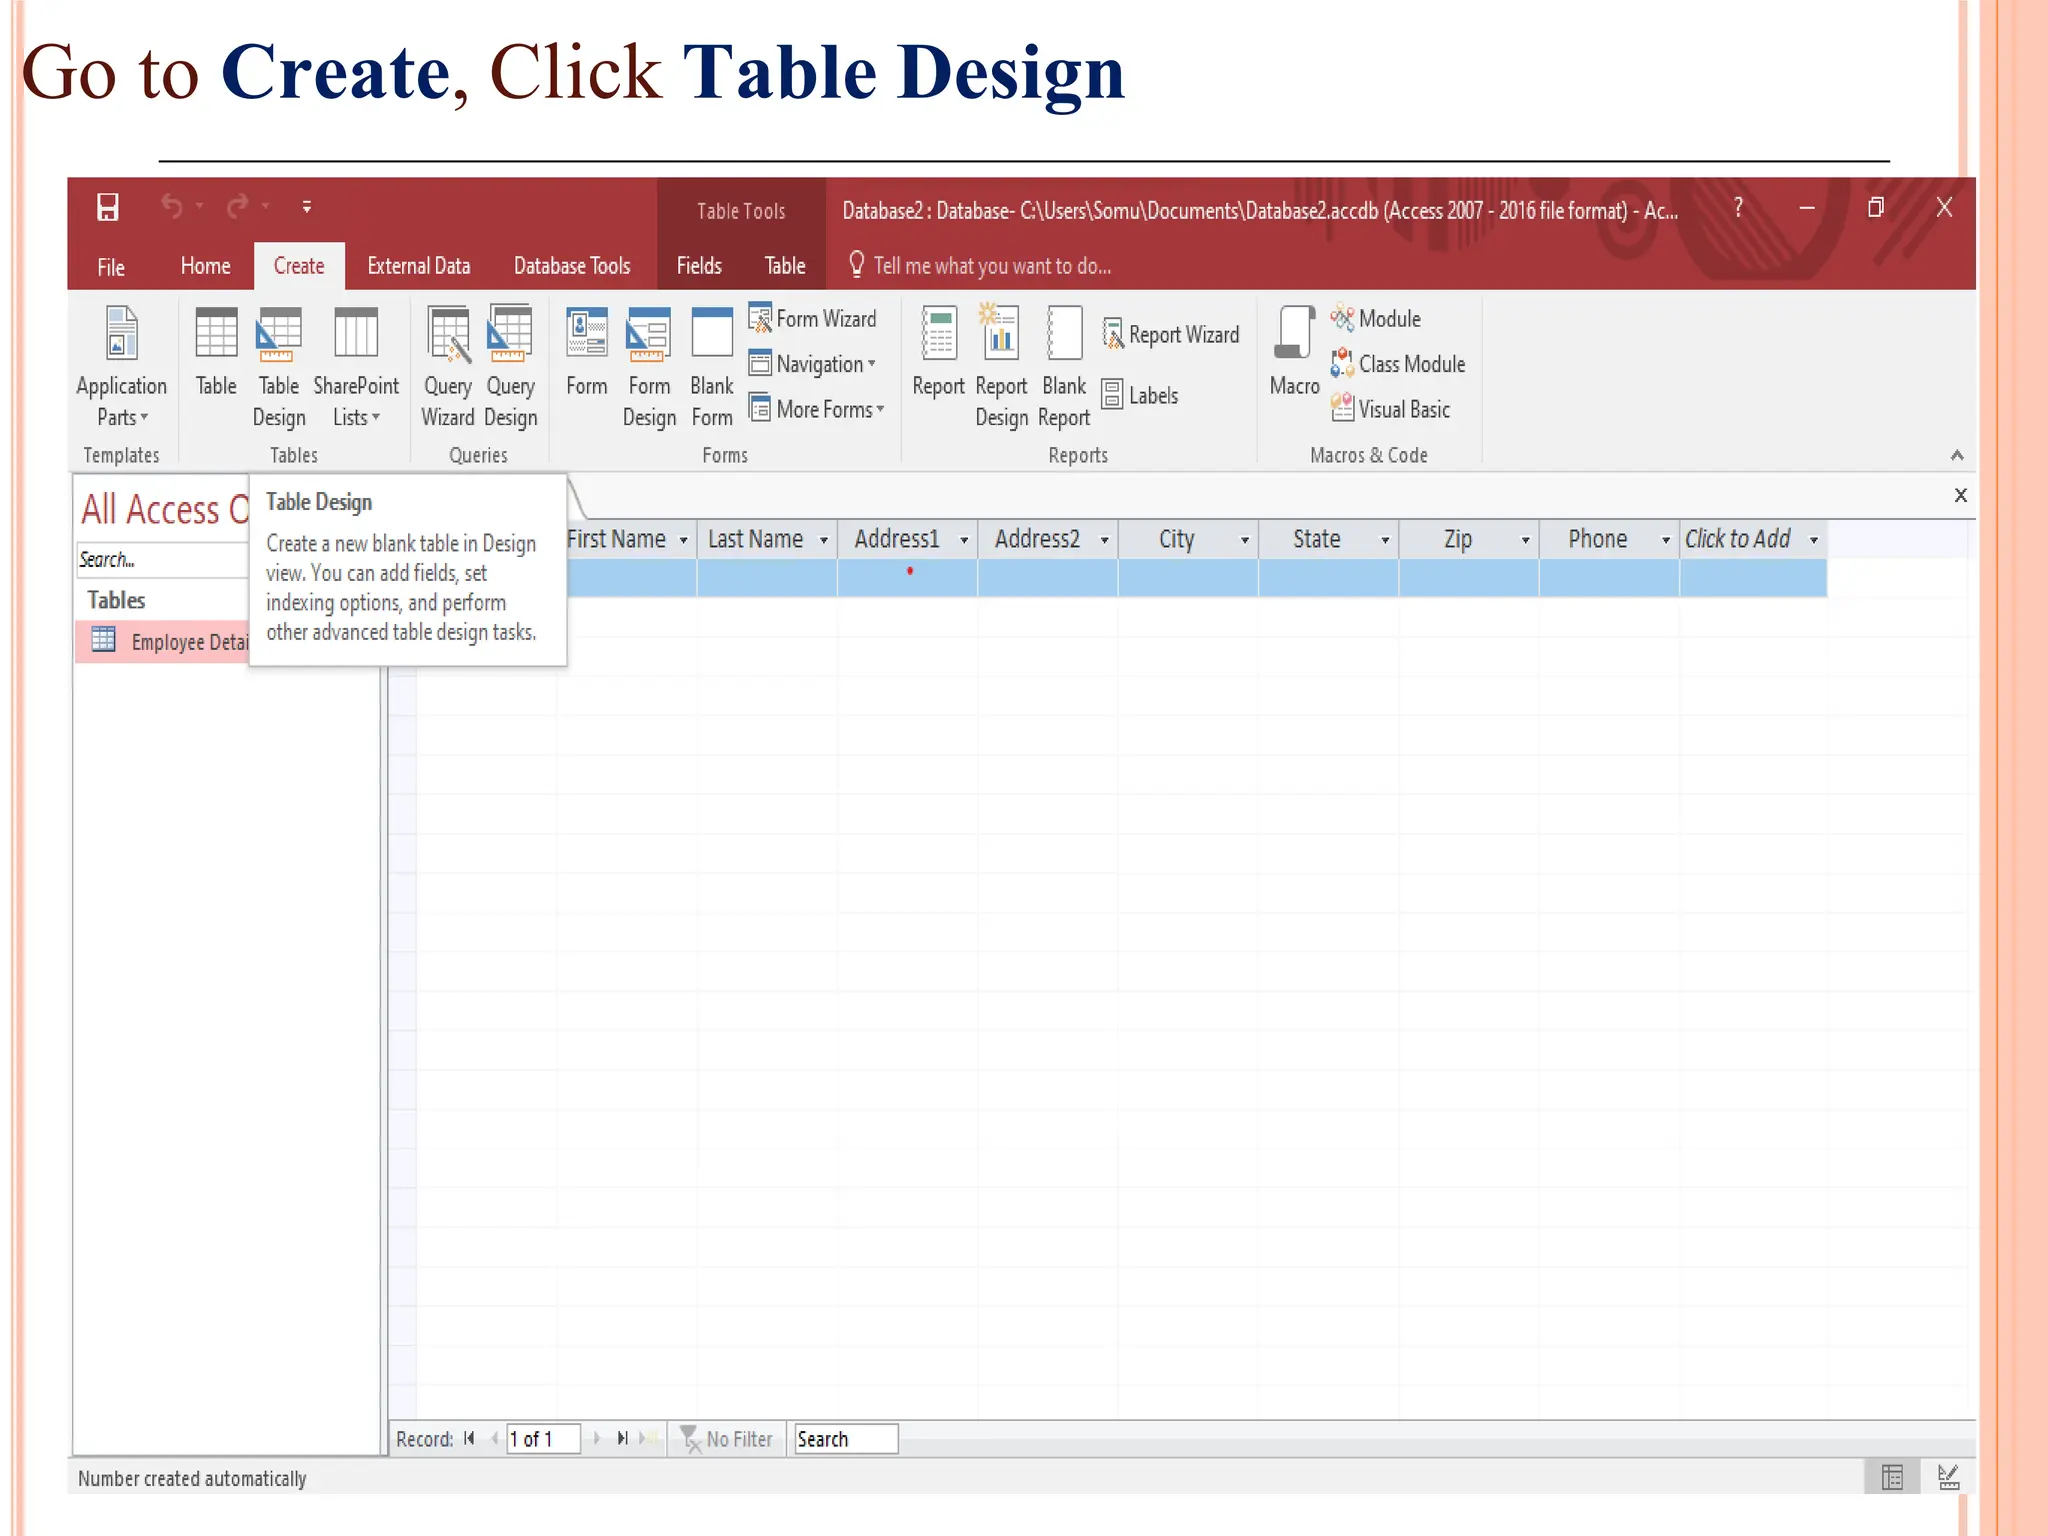
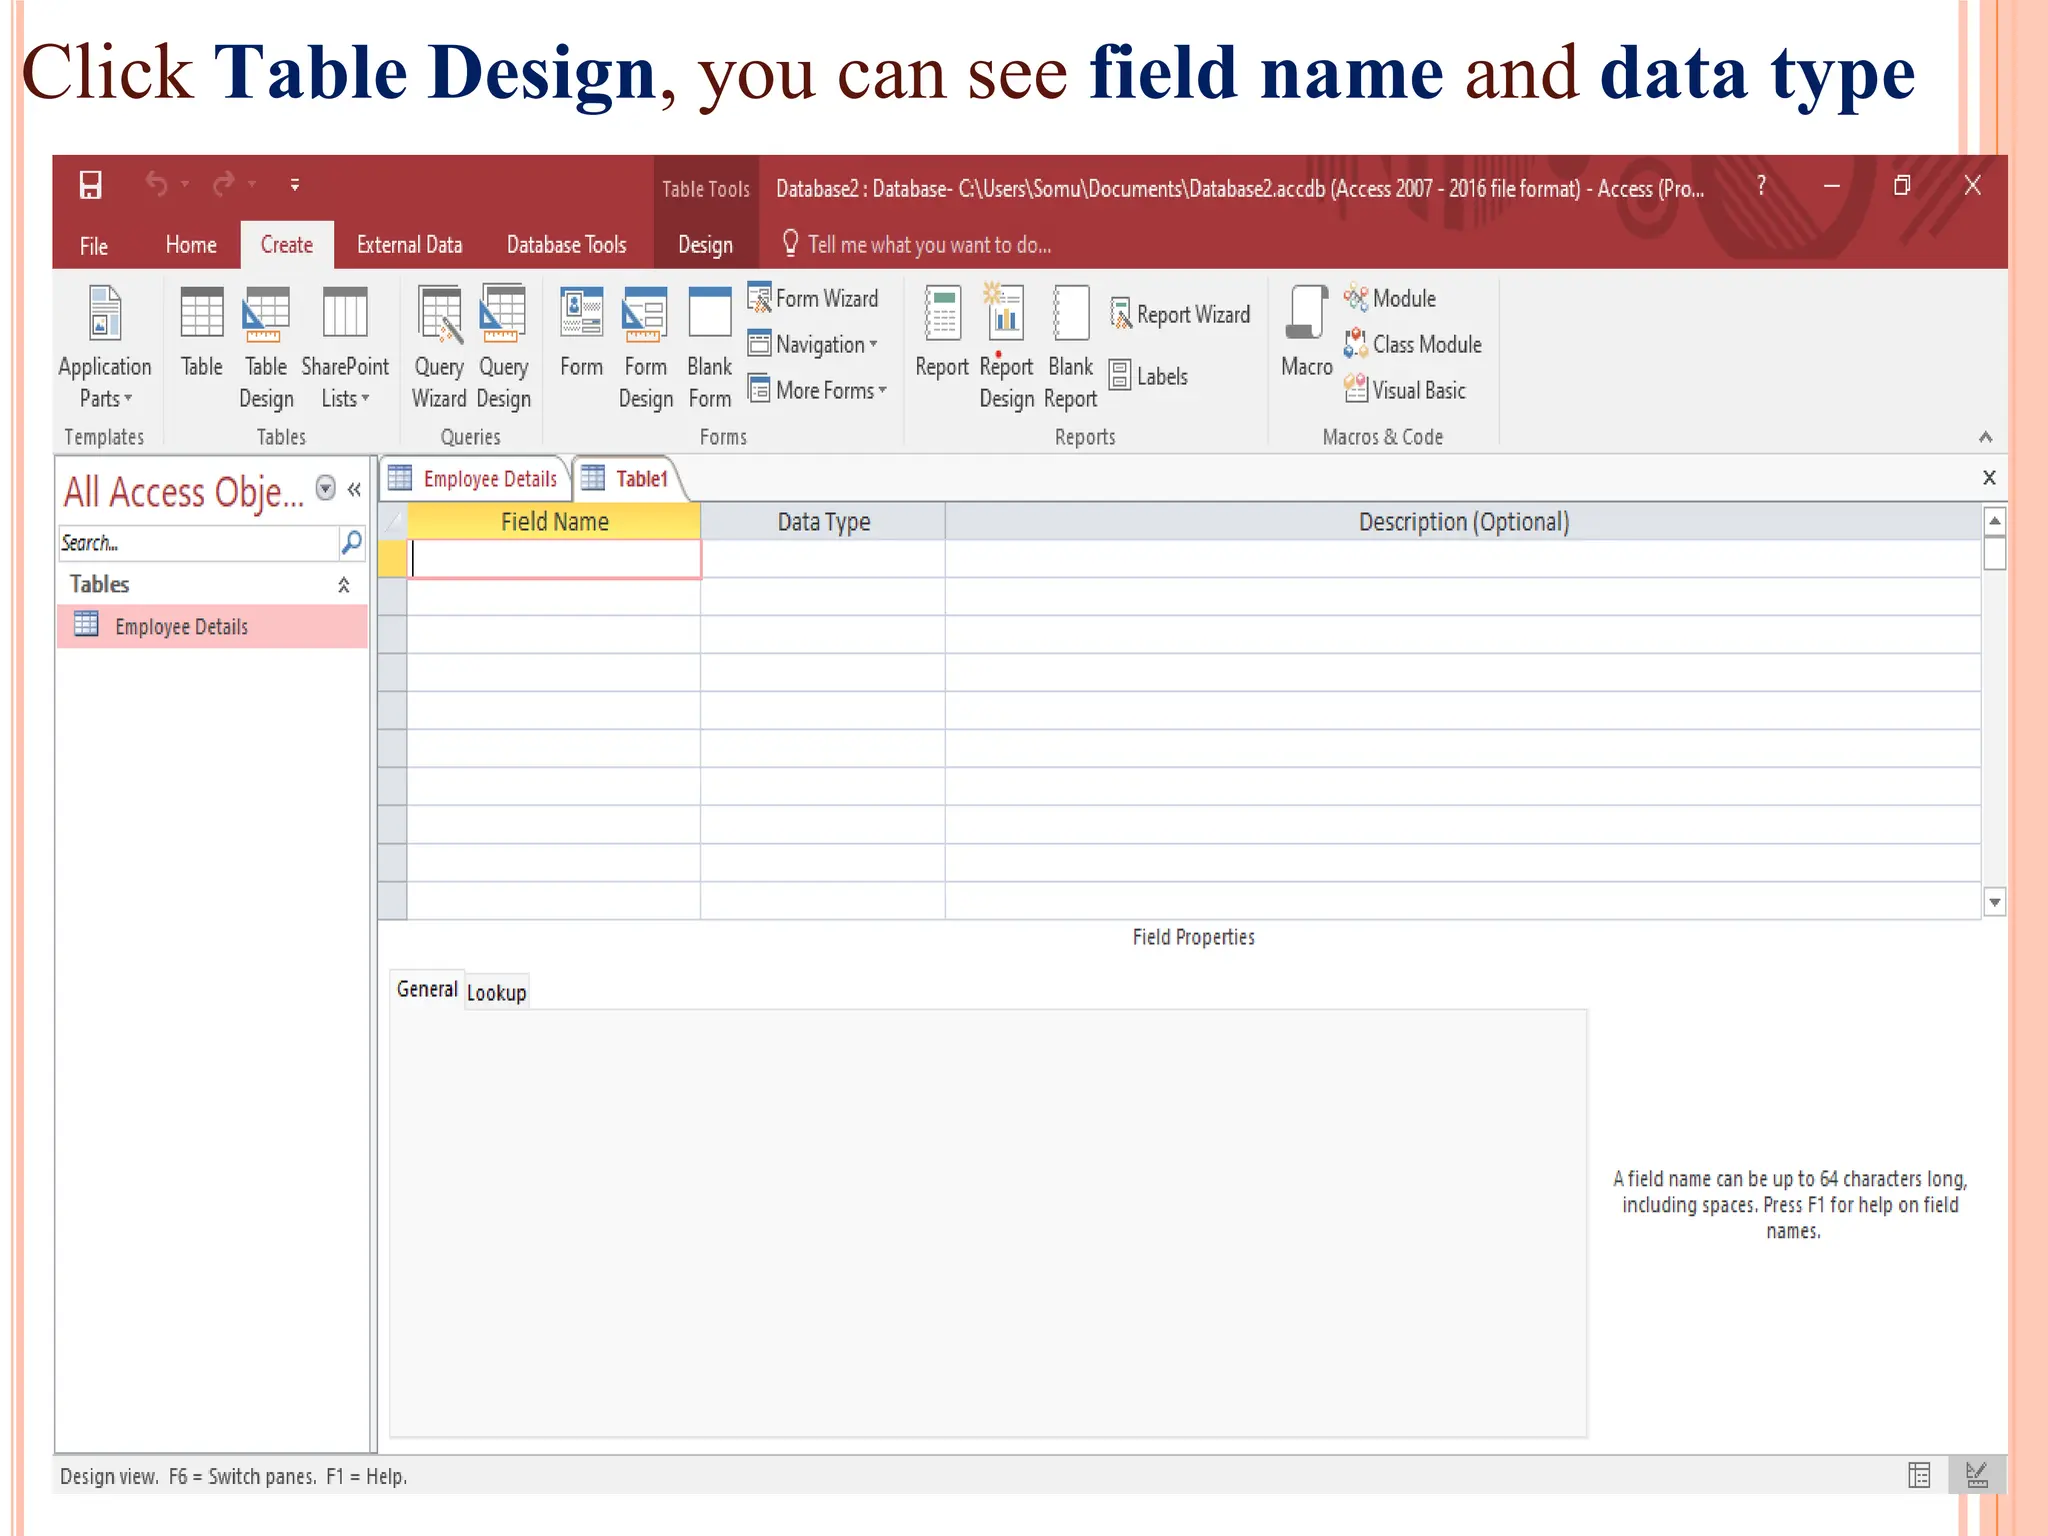
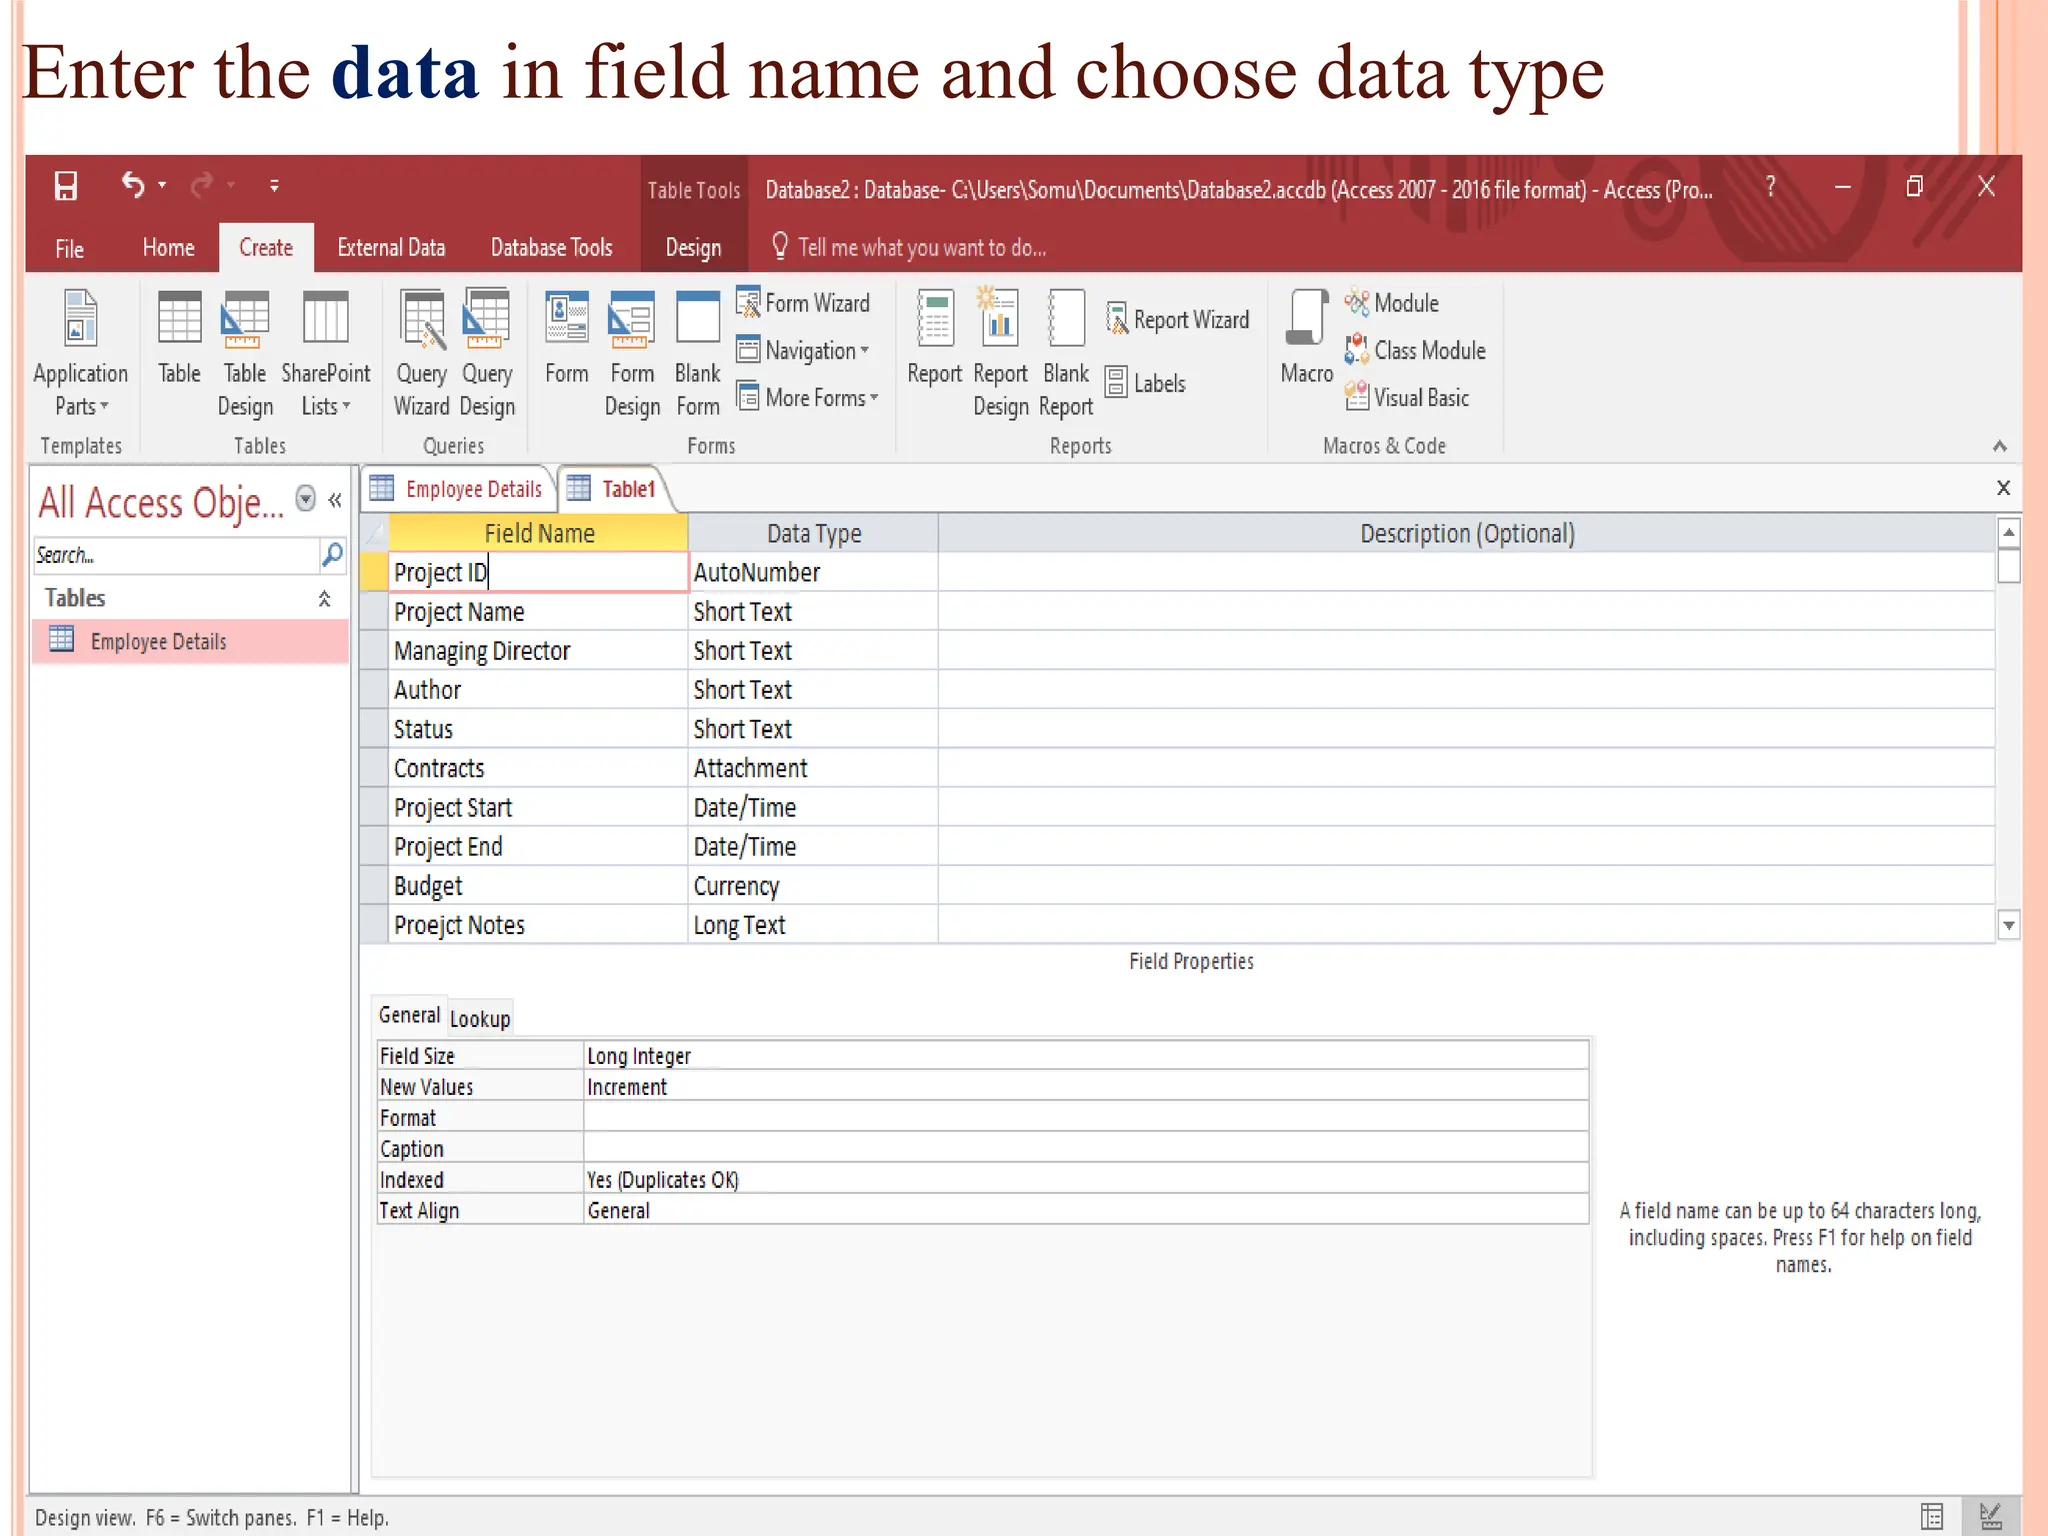
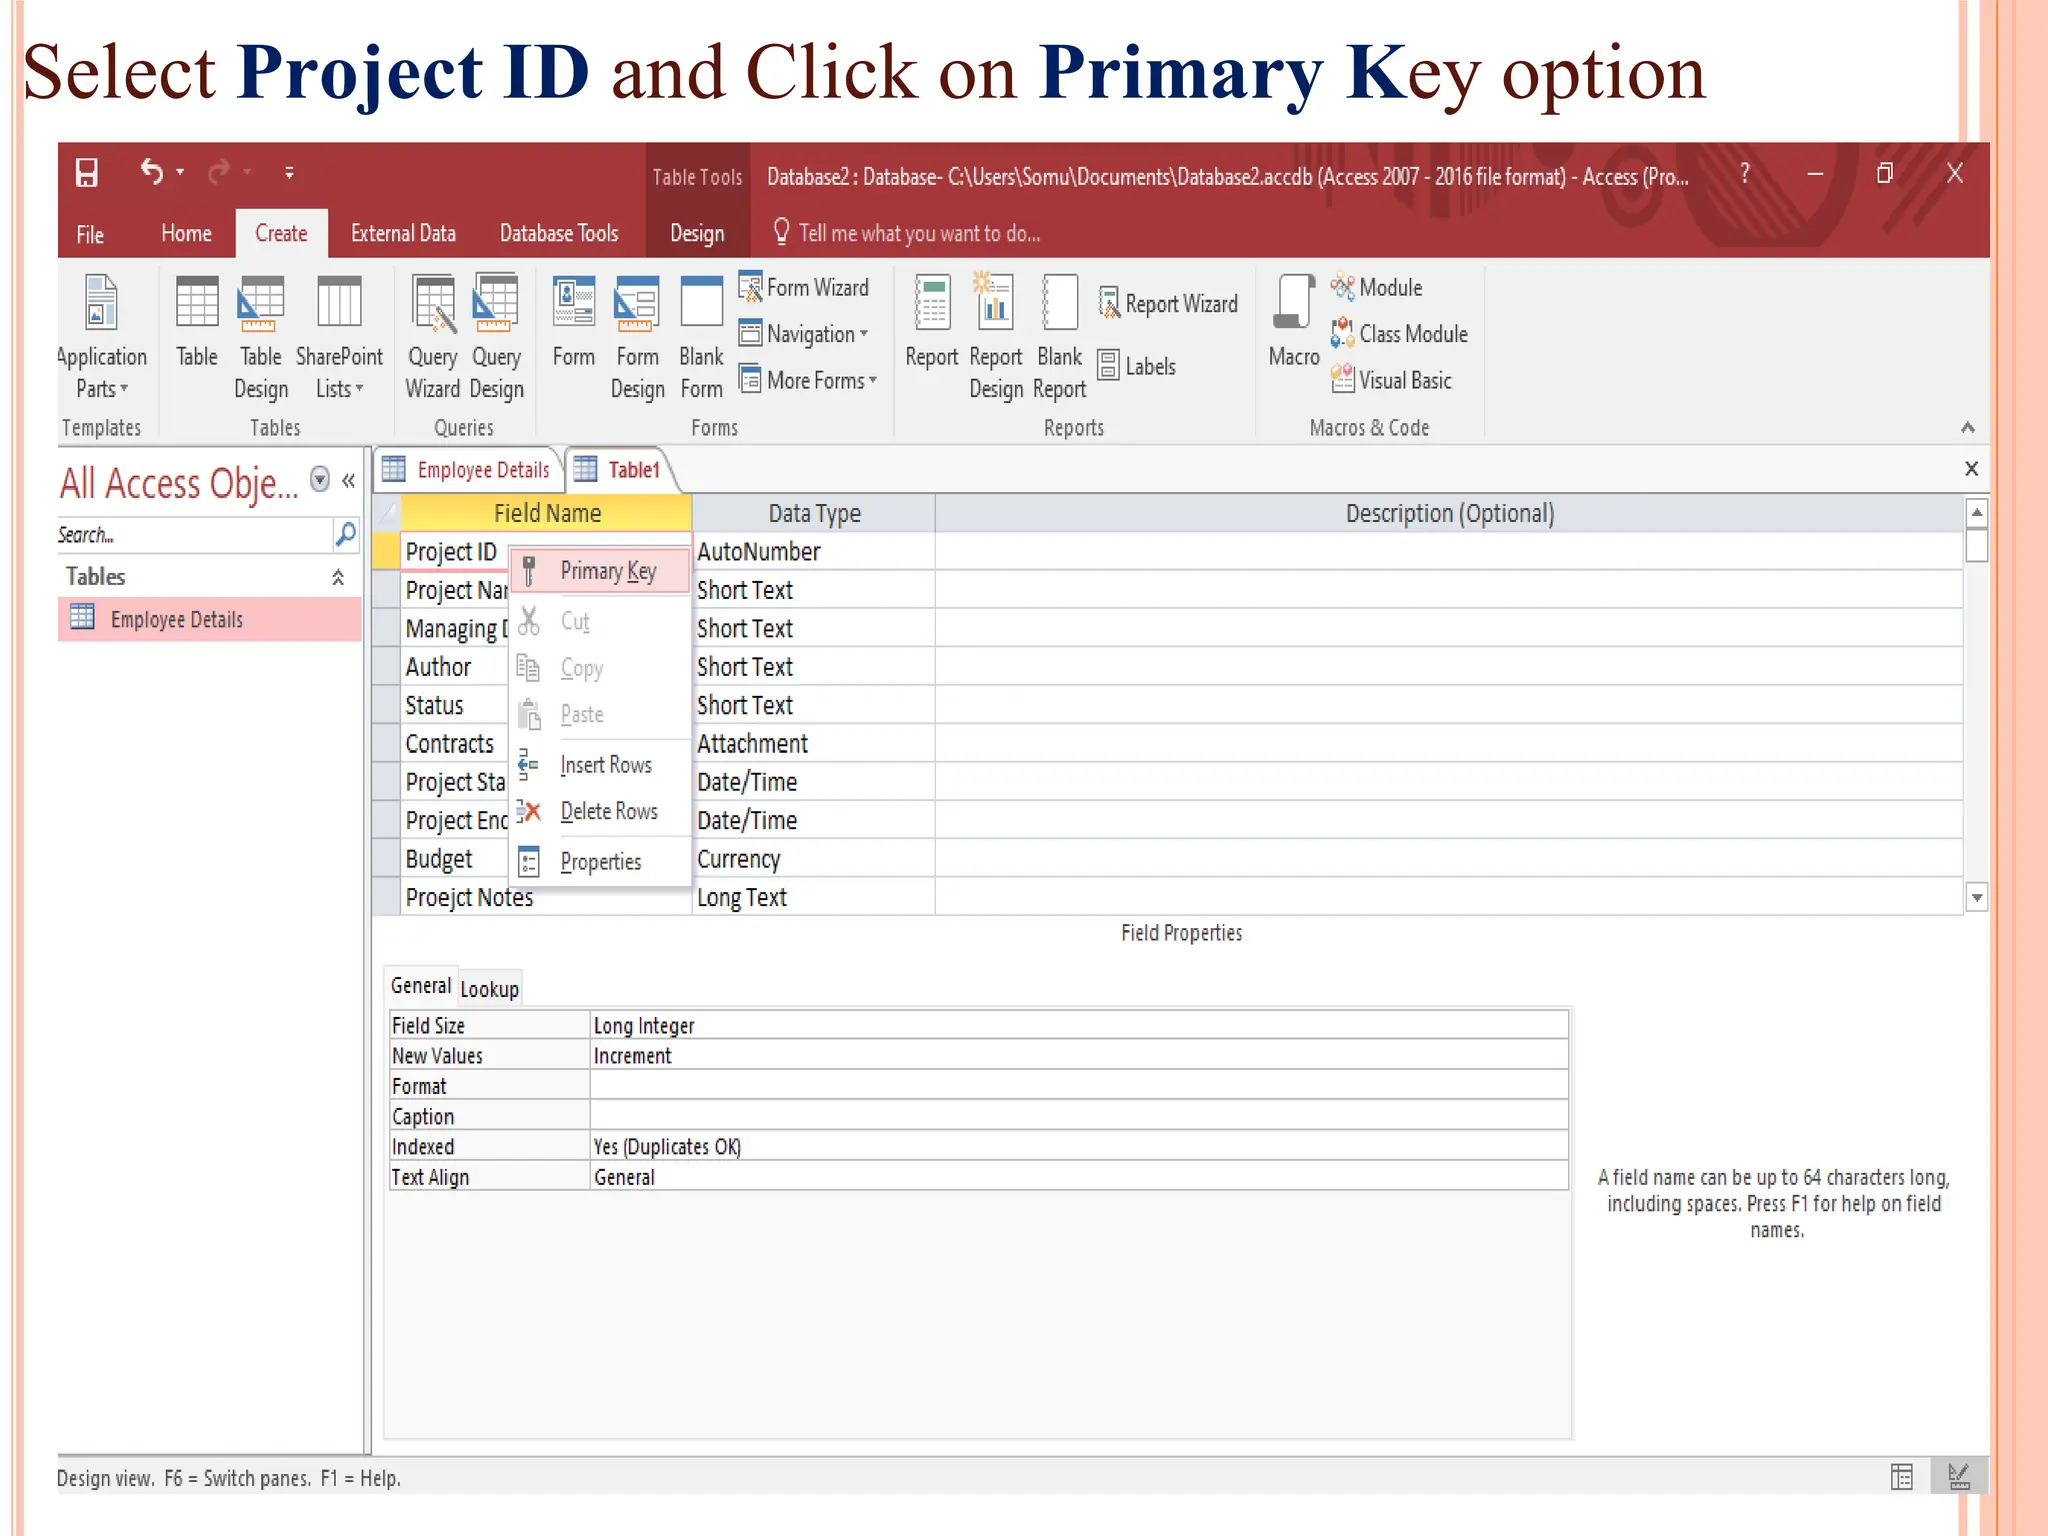
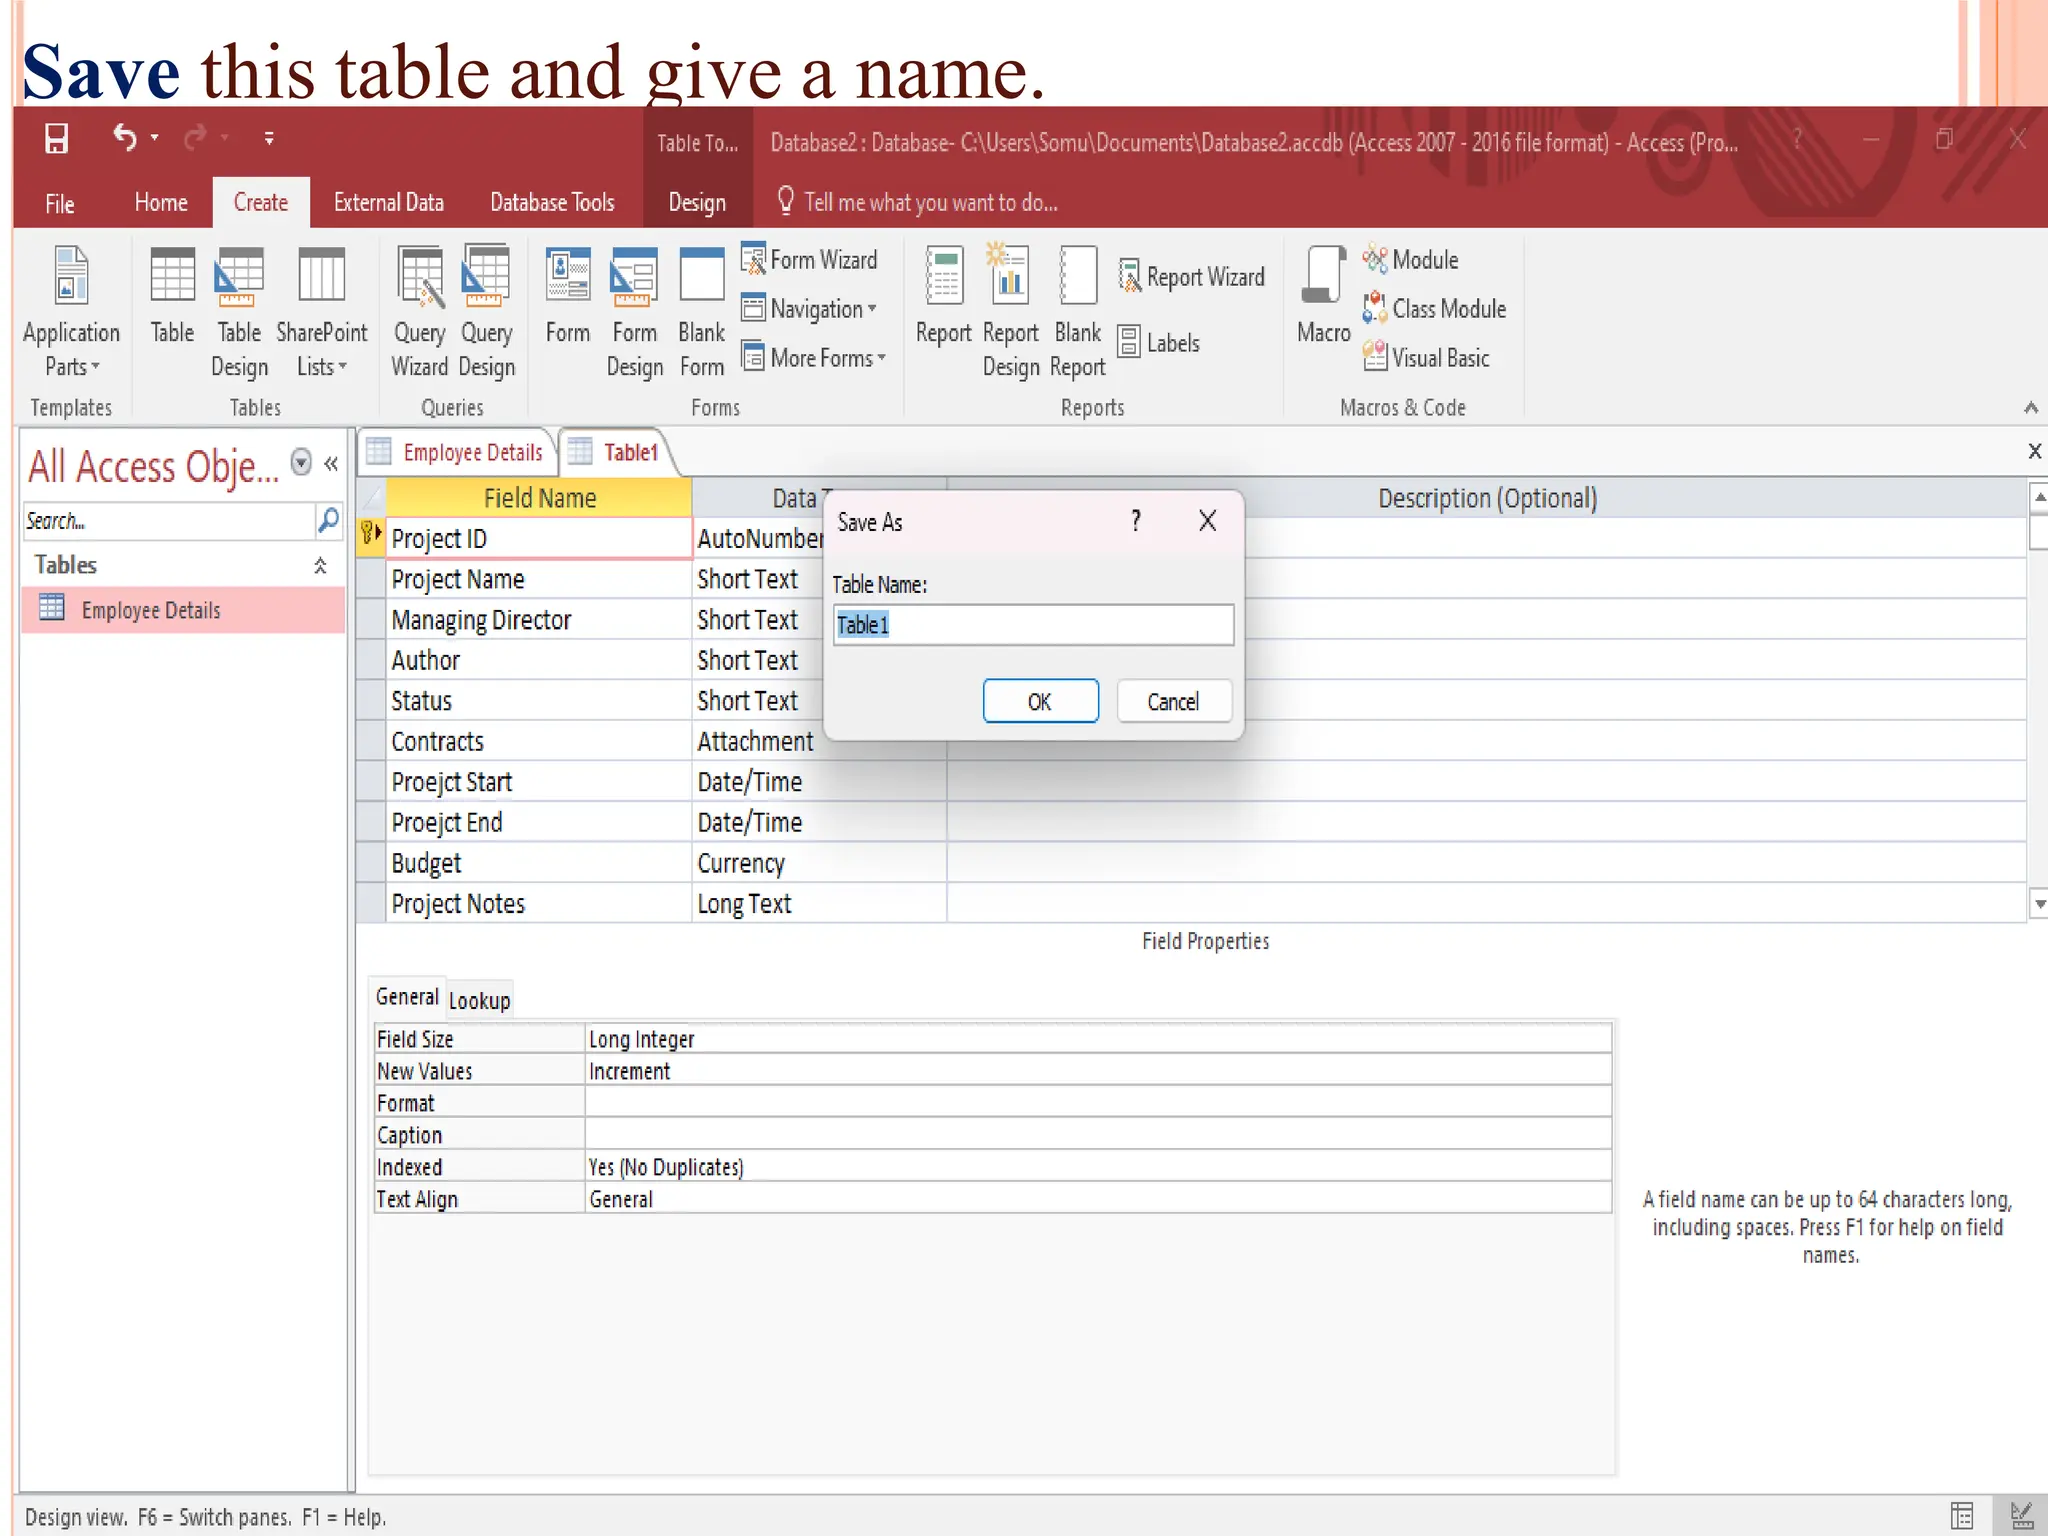
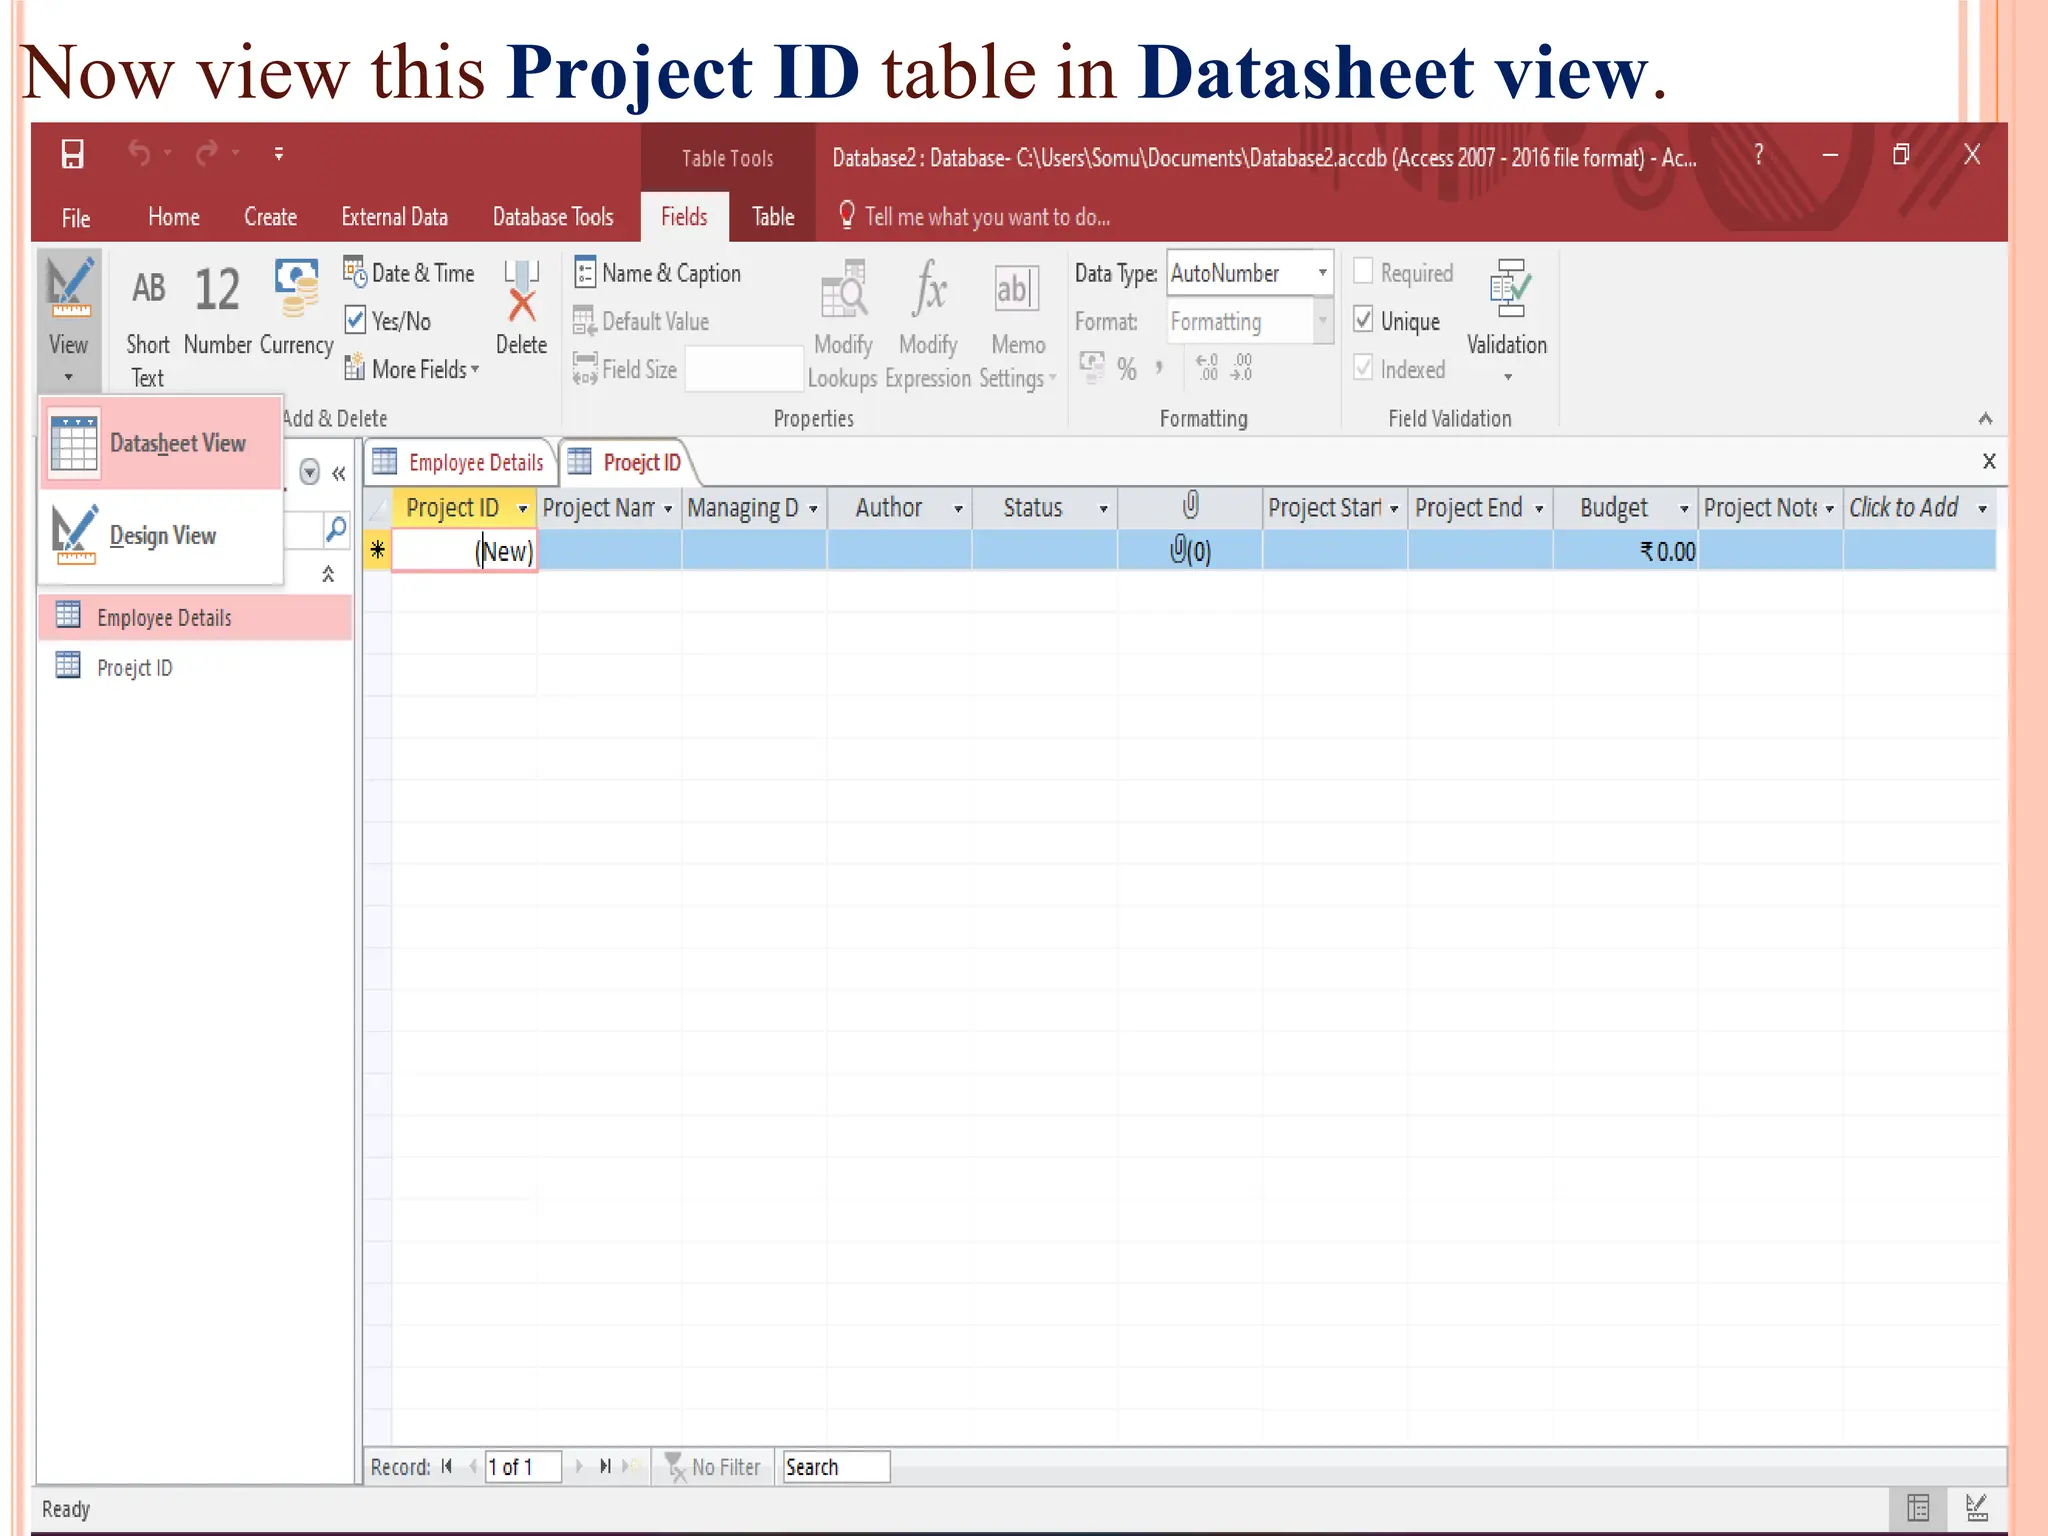
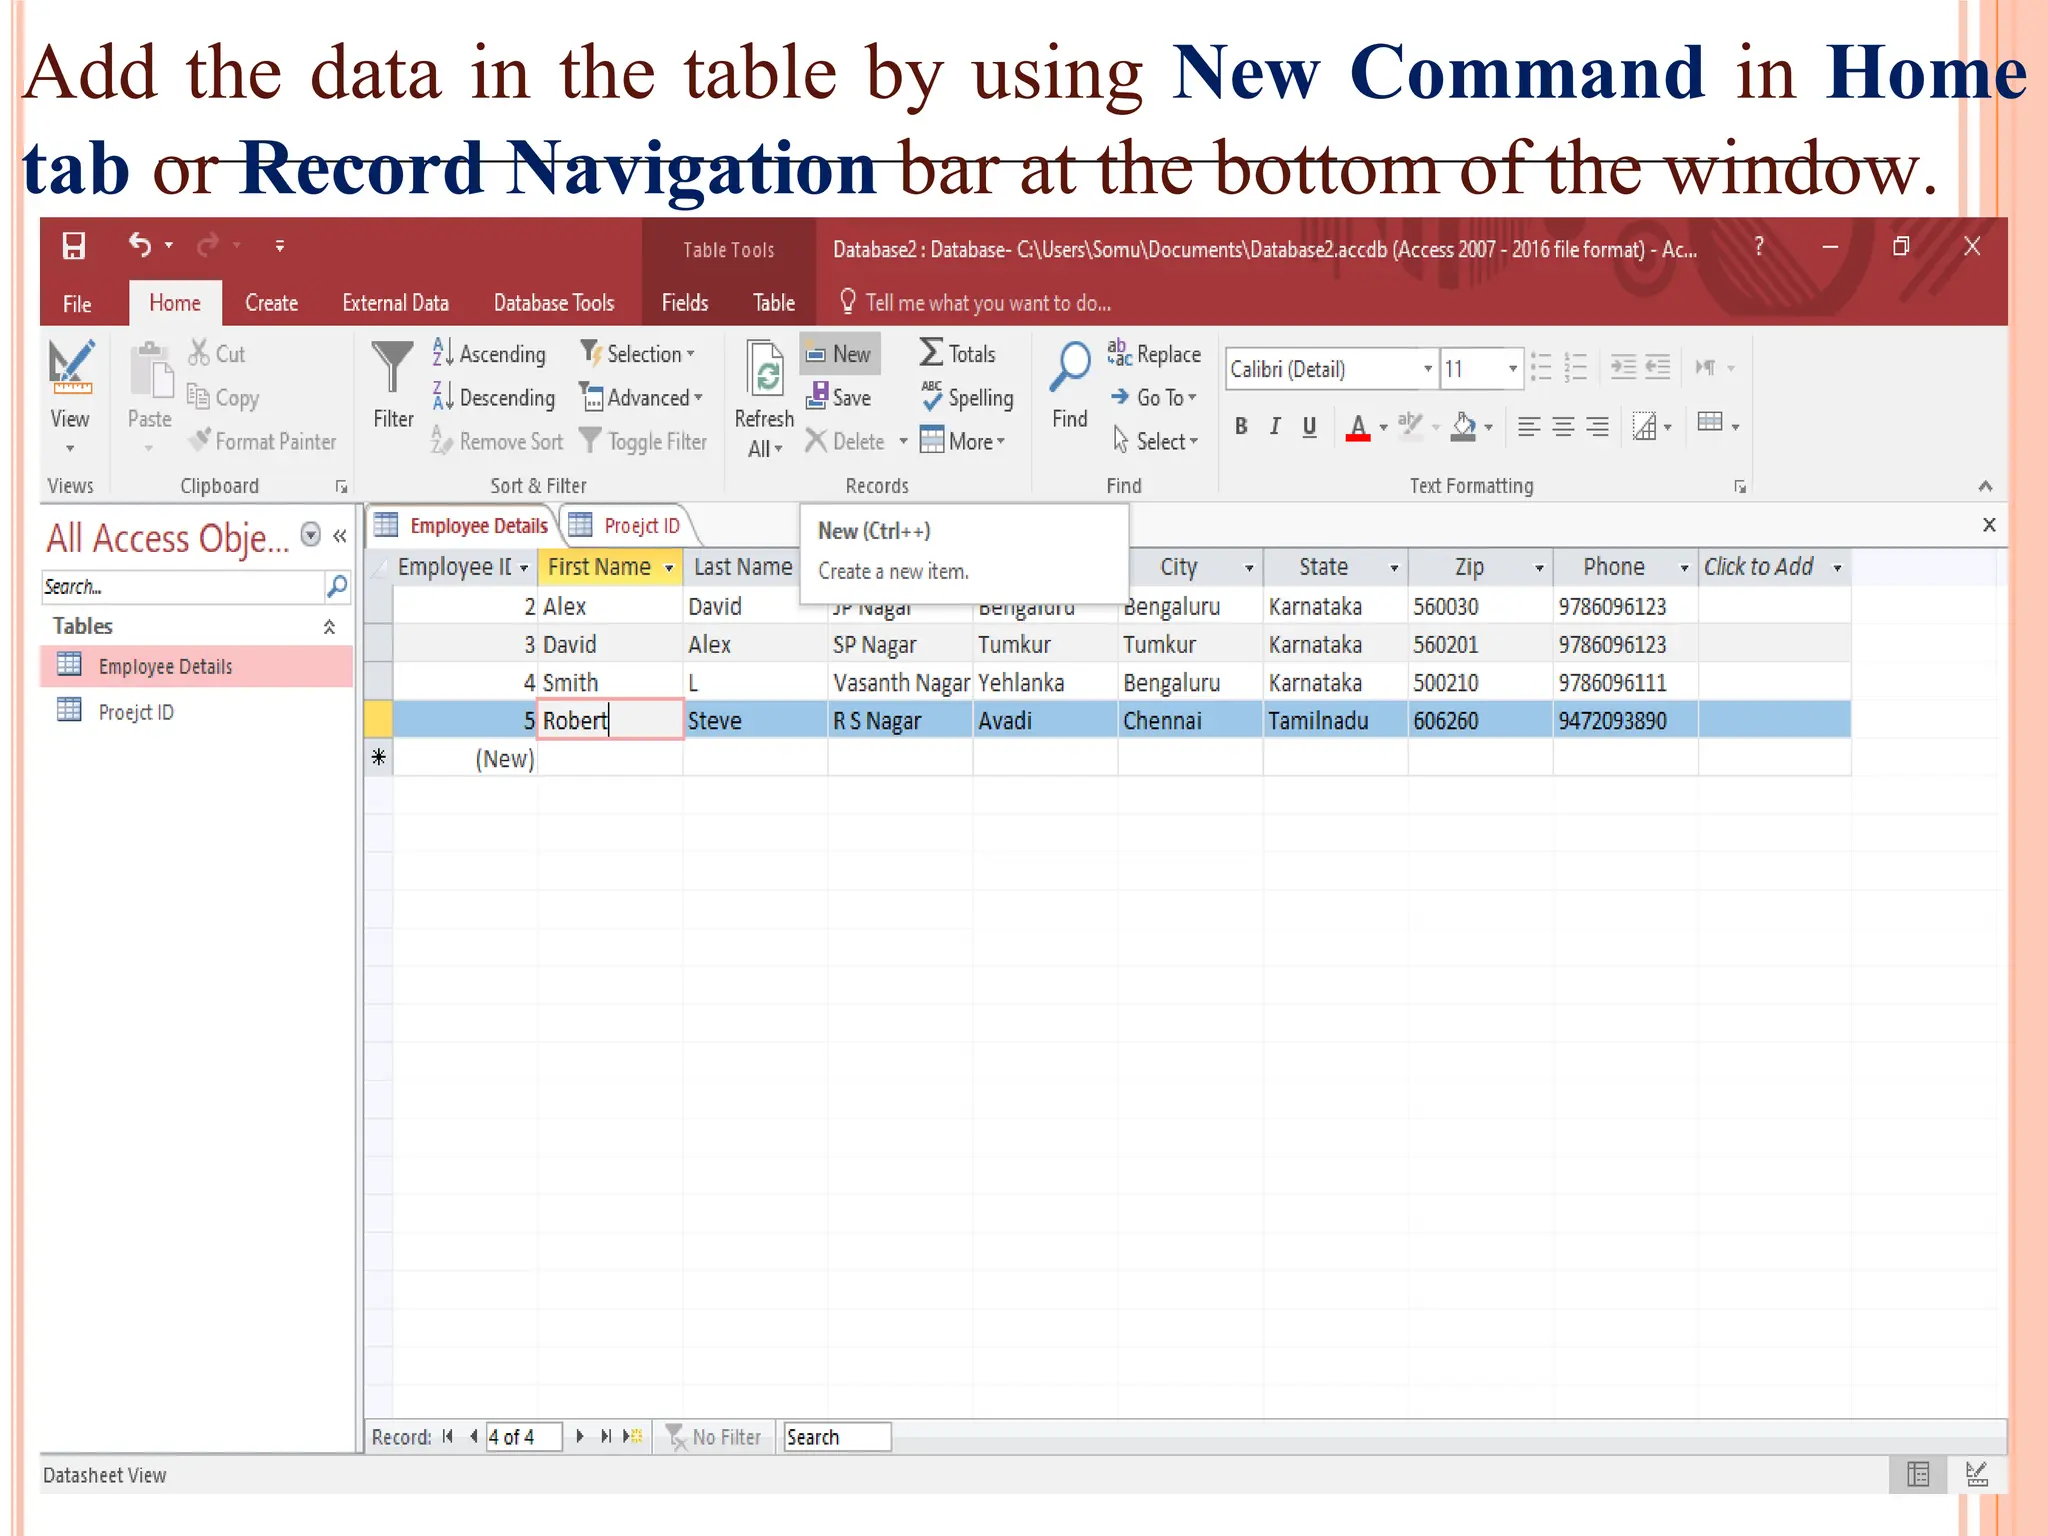
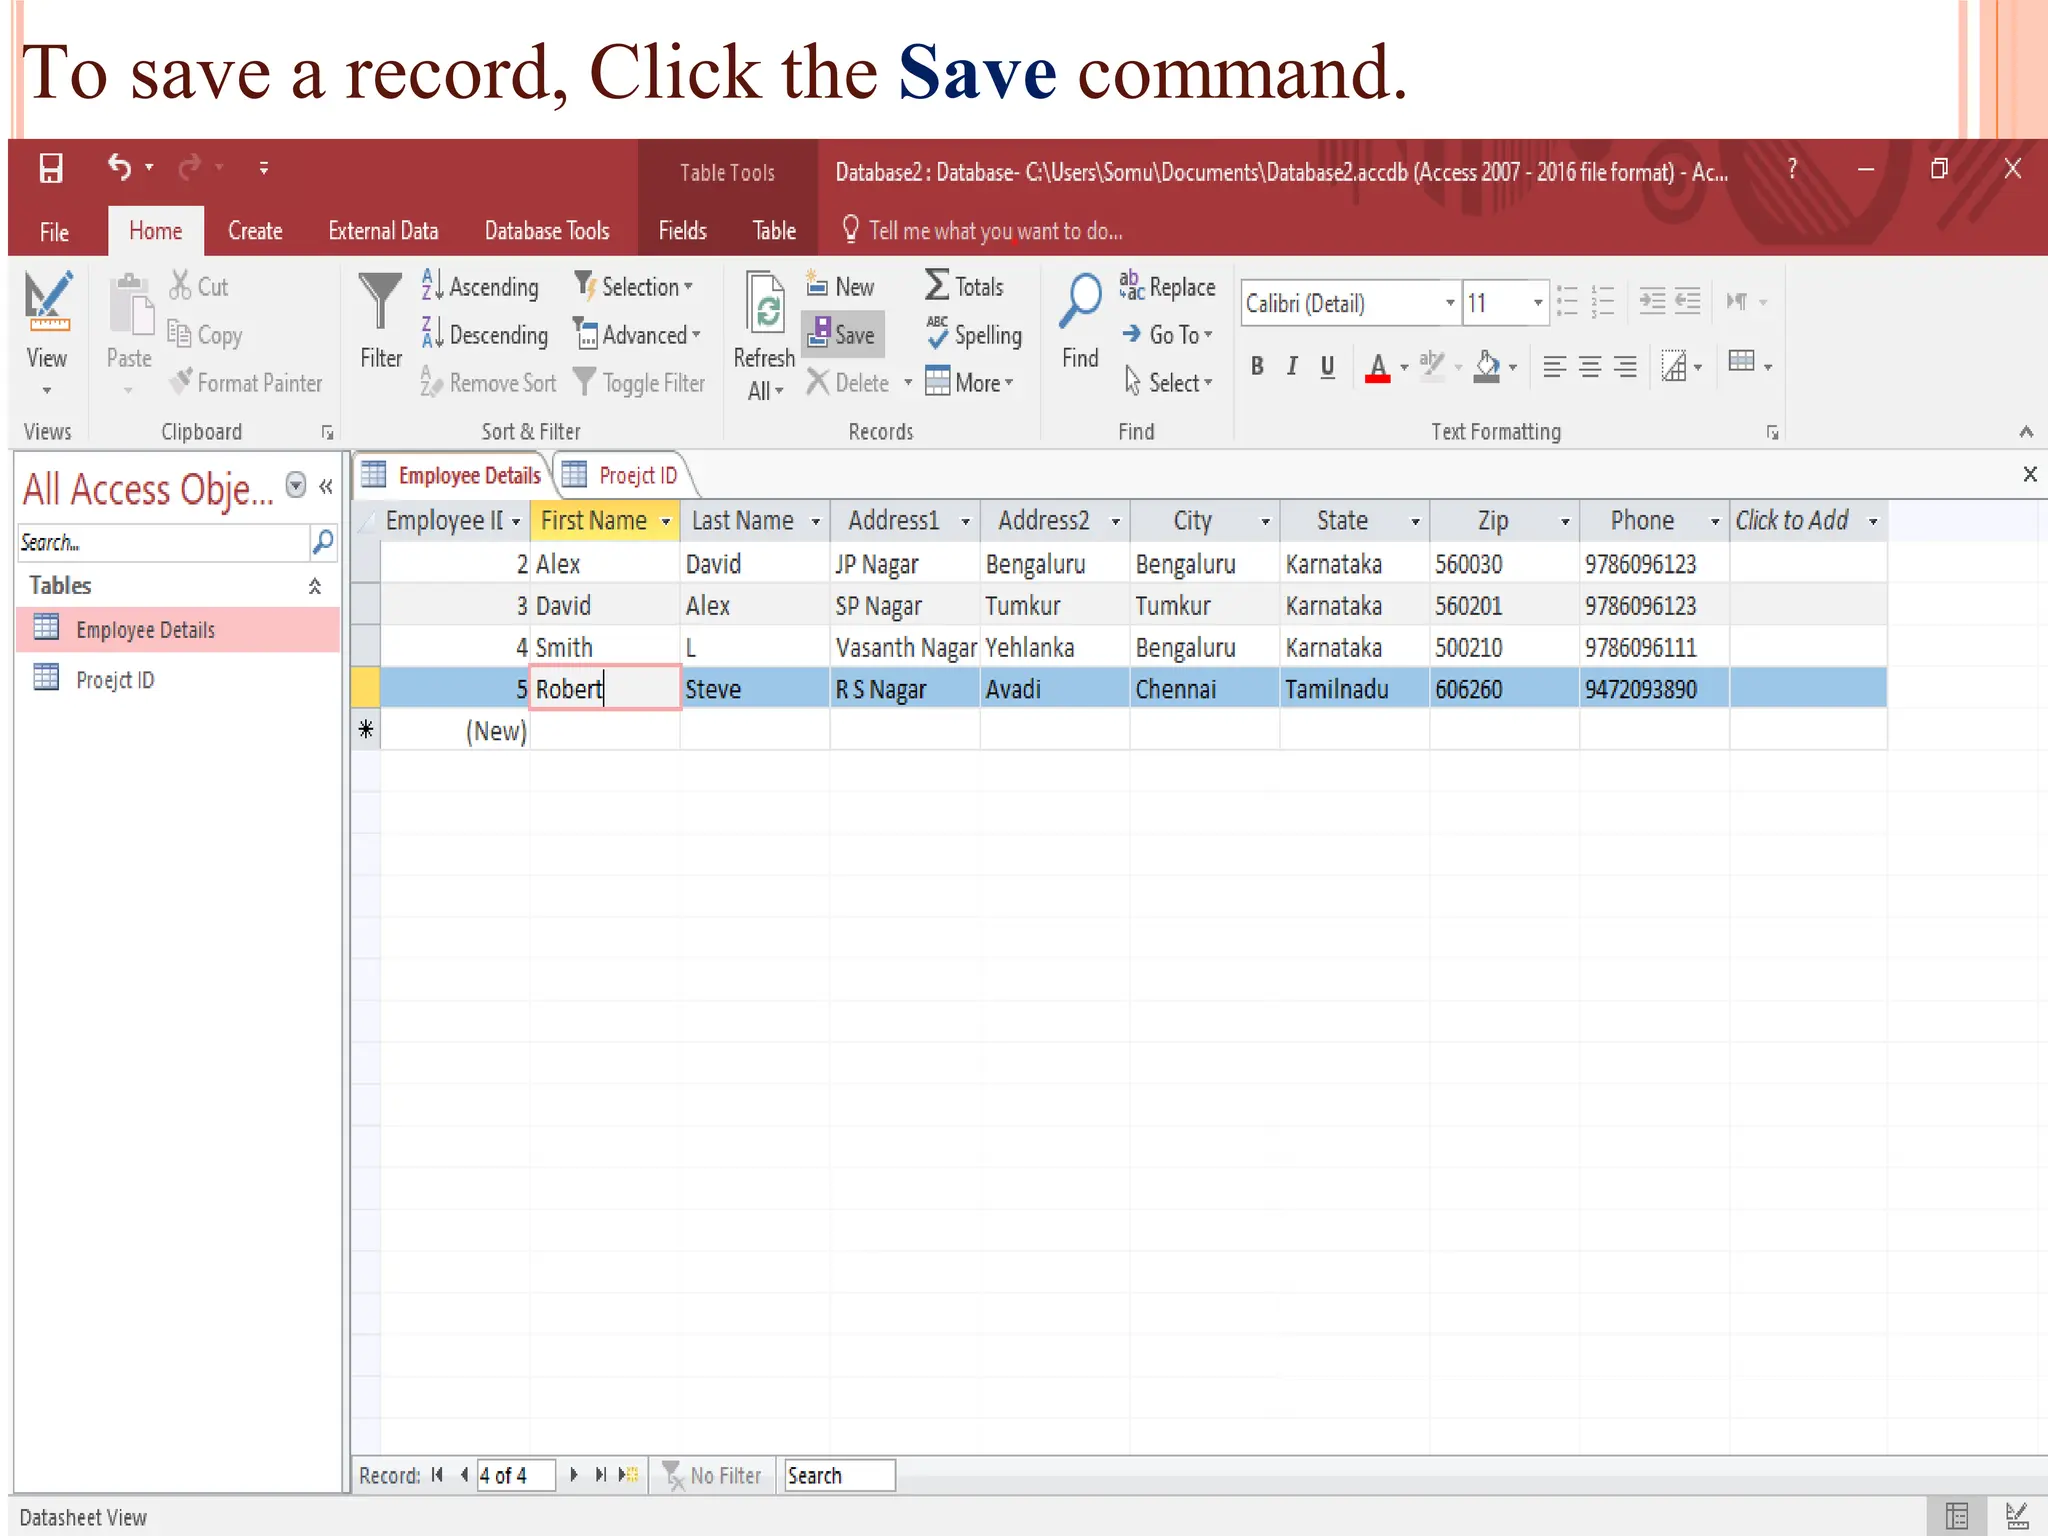
Detailed steps to create, edit, and organize tables and data within MS Access, including data type specifications.
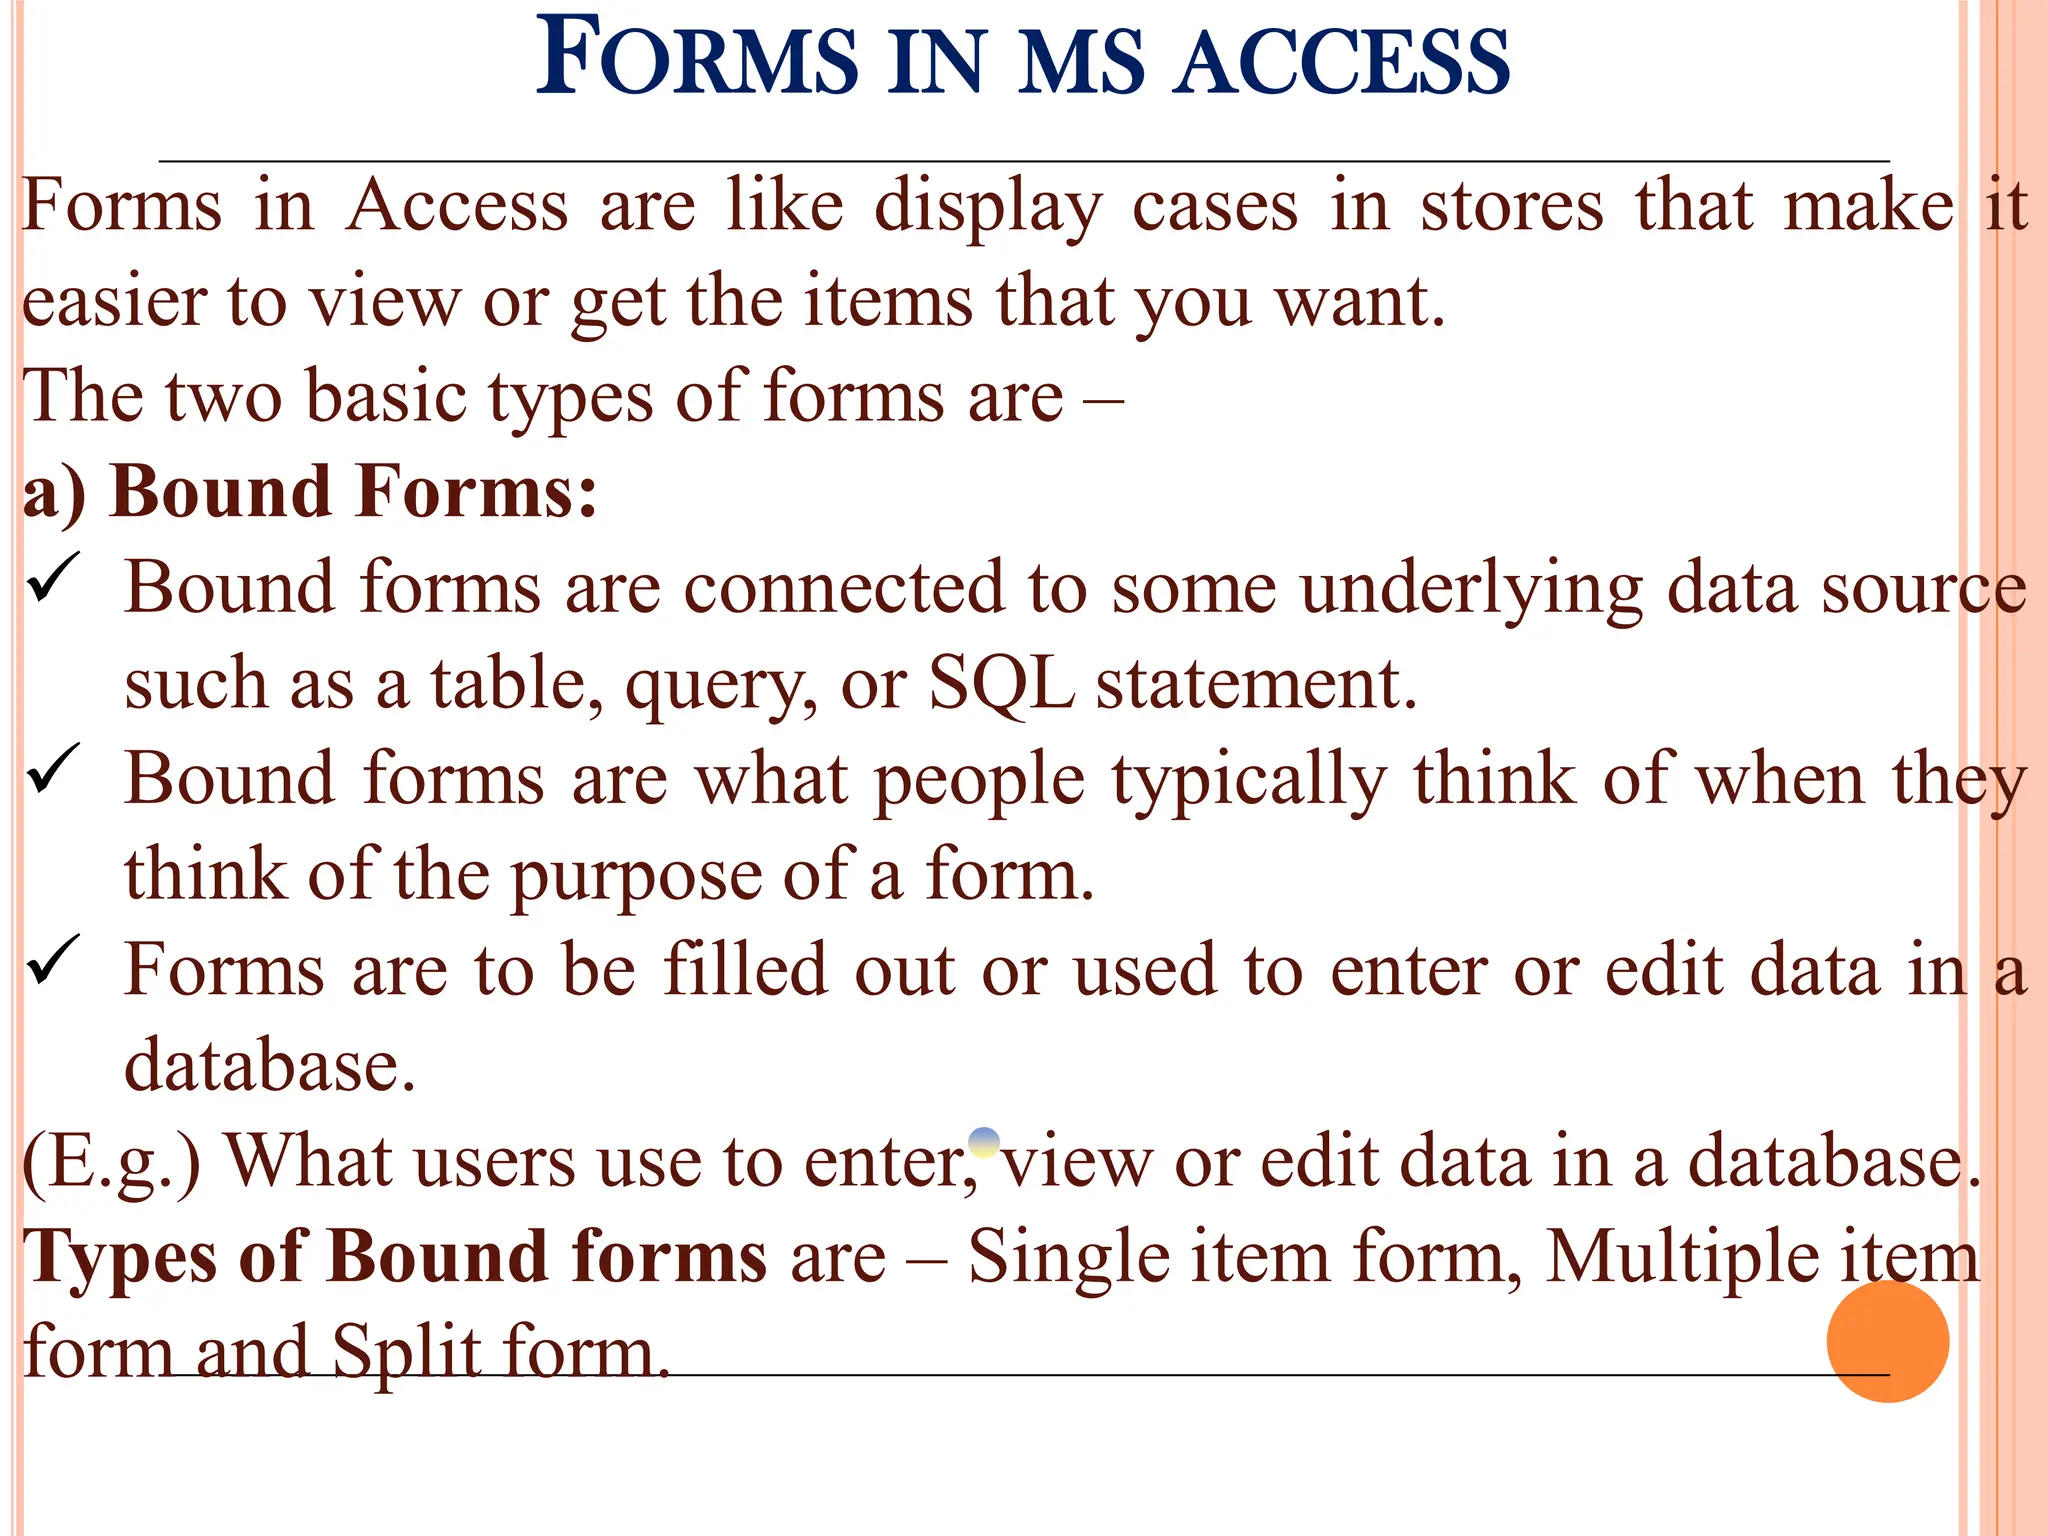
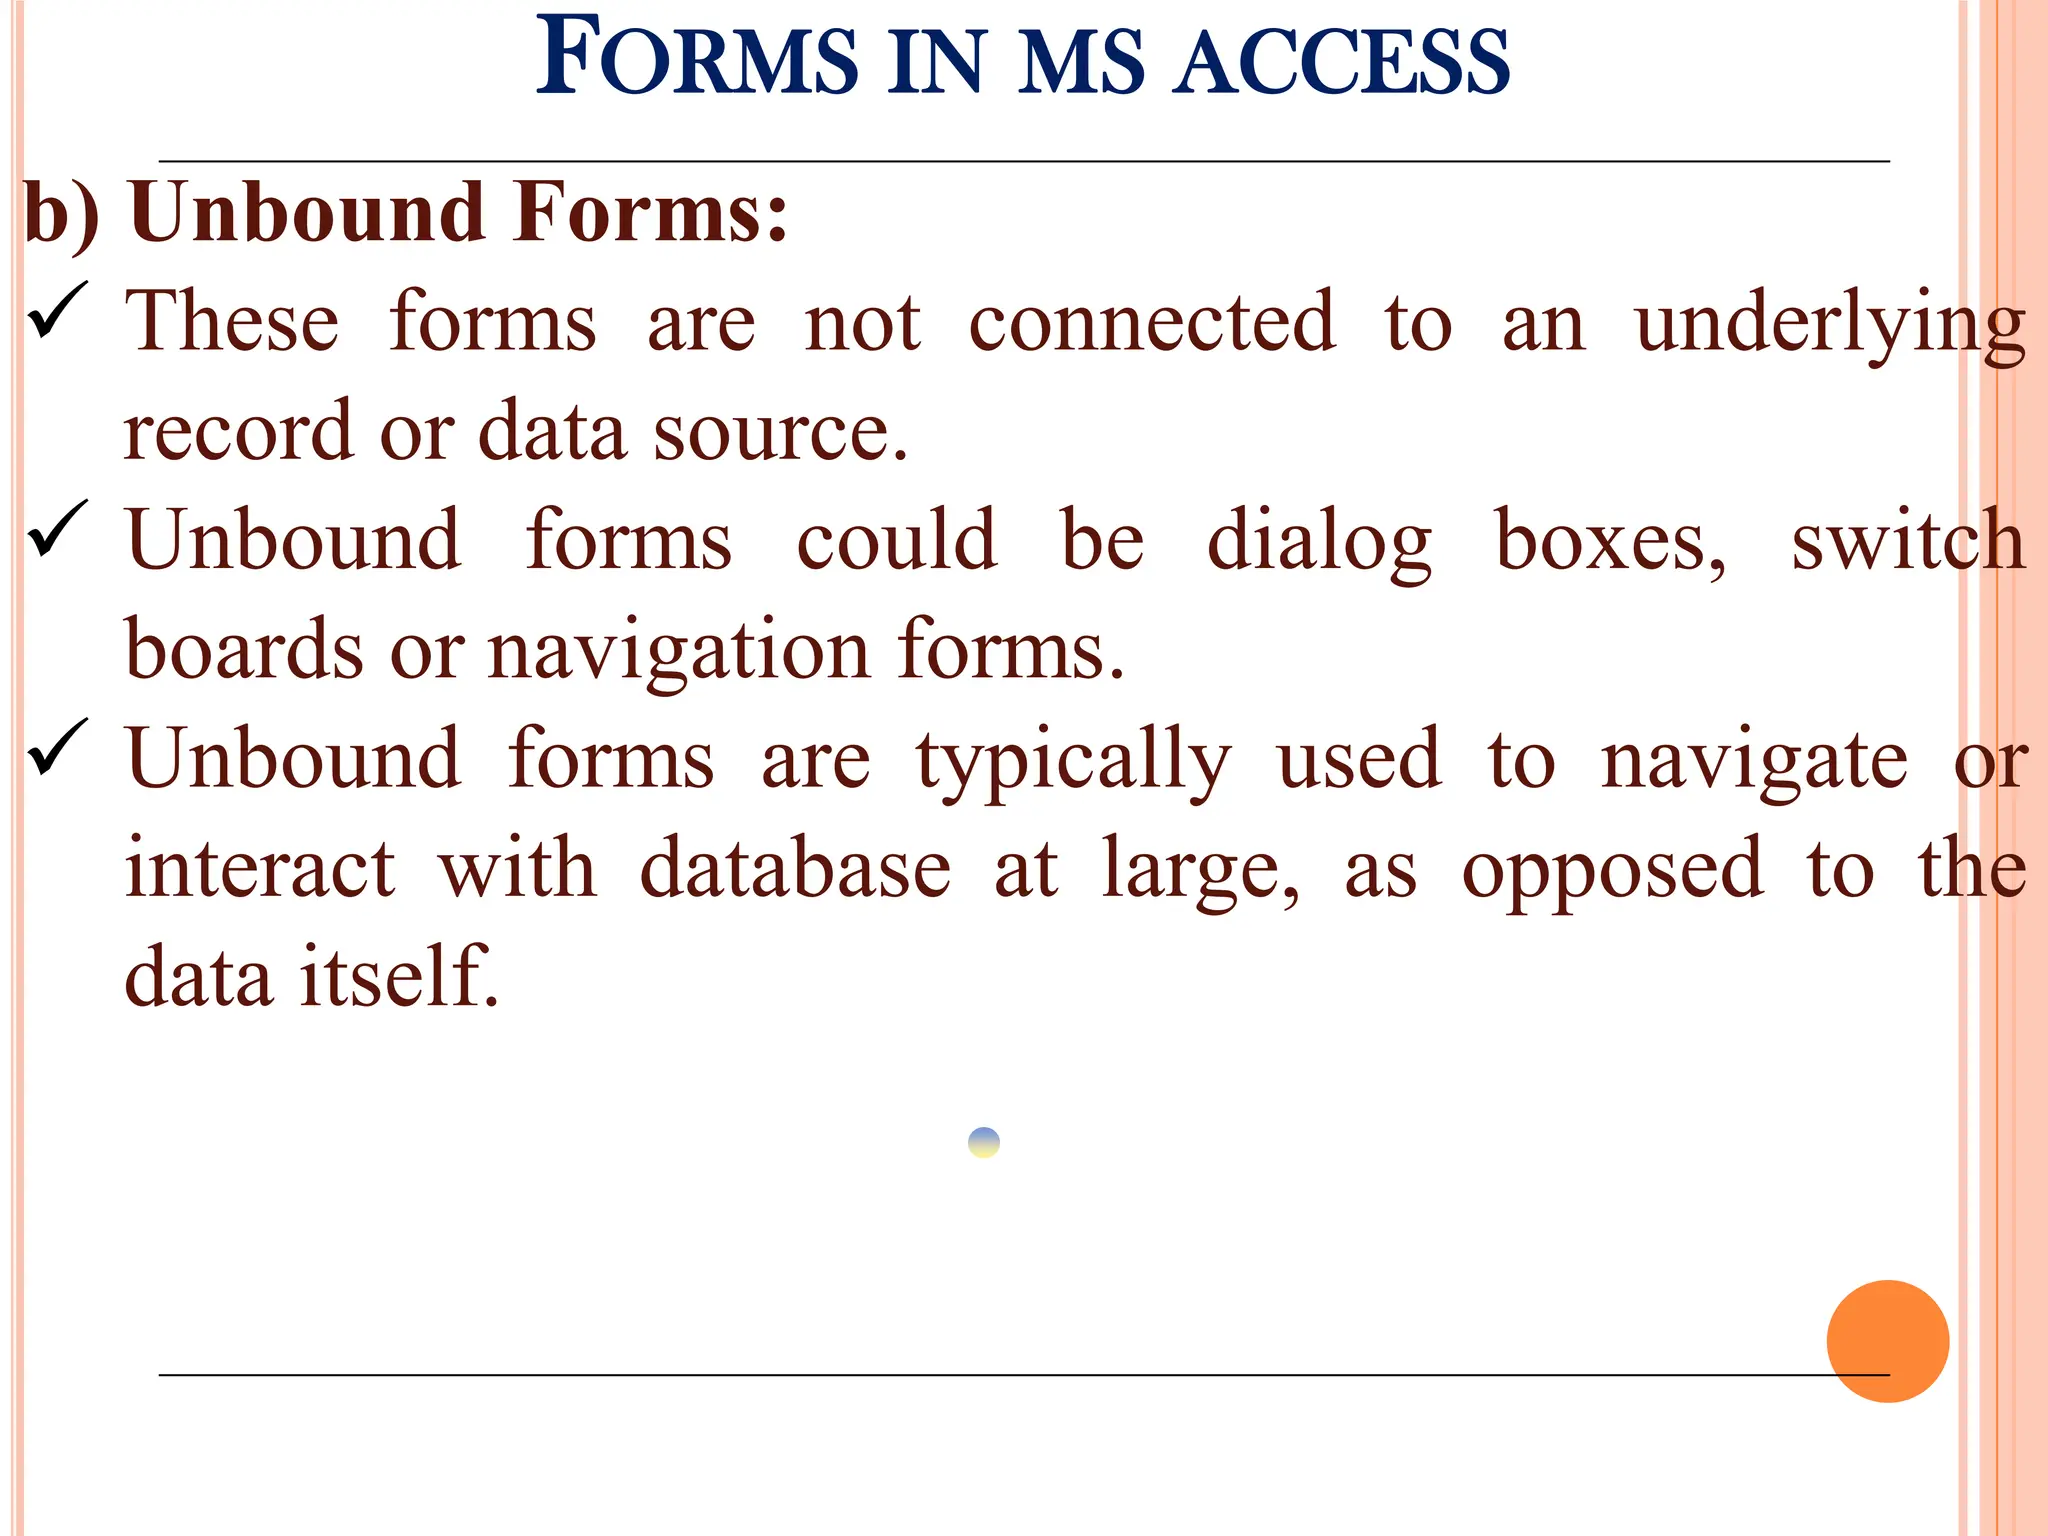
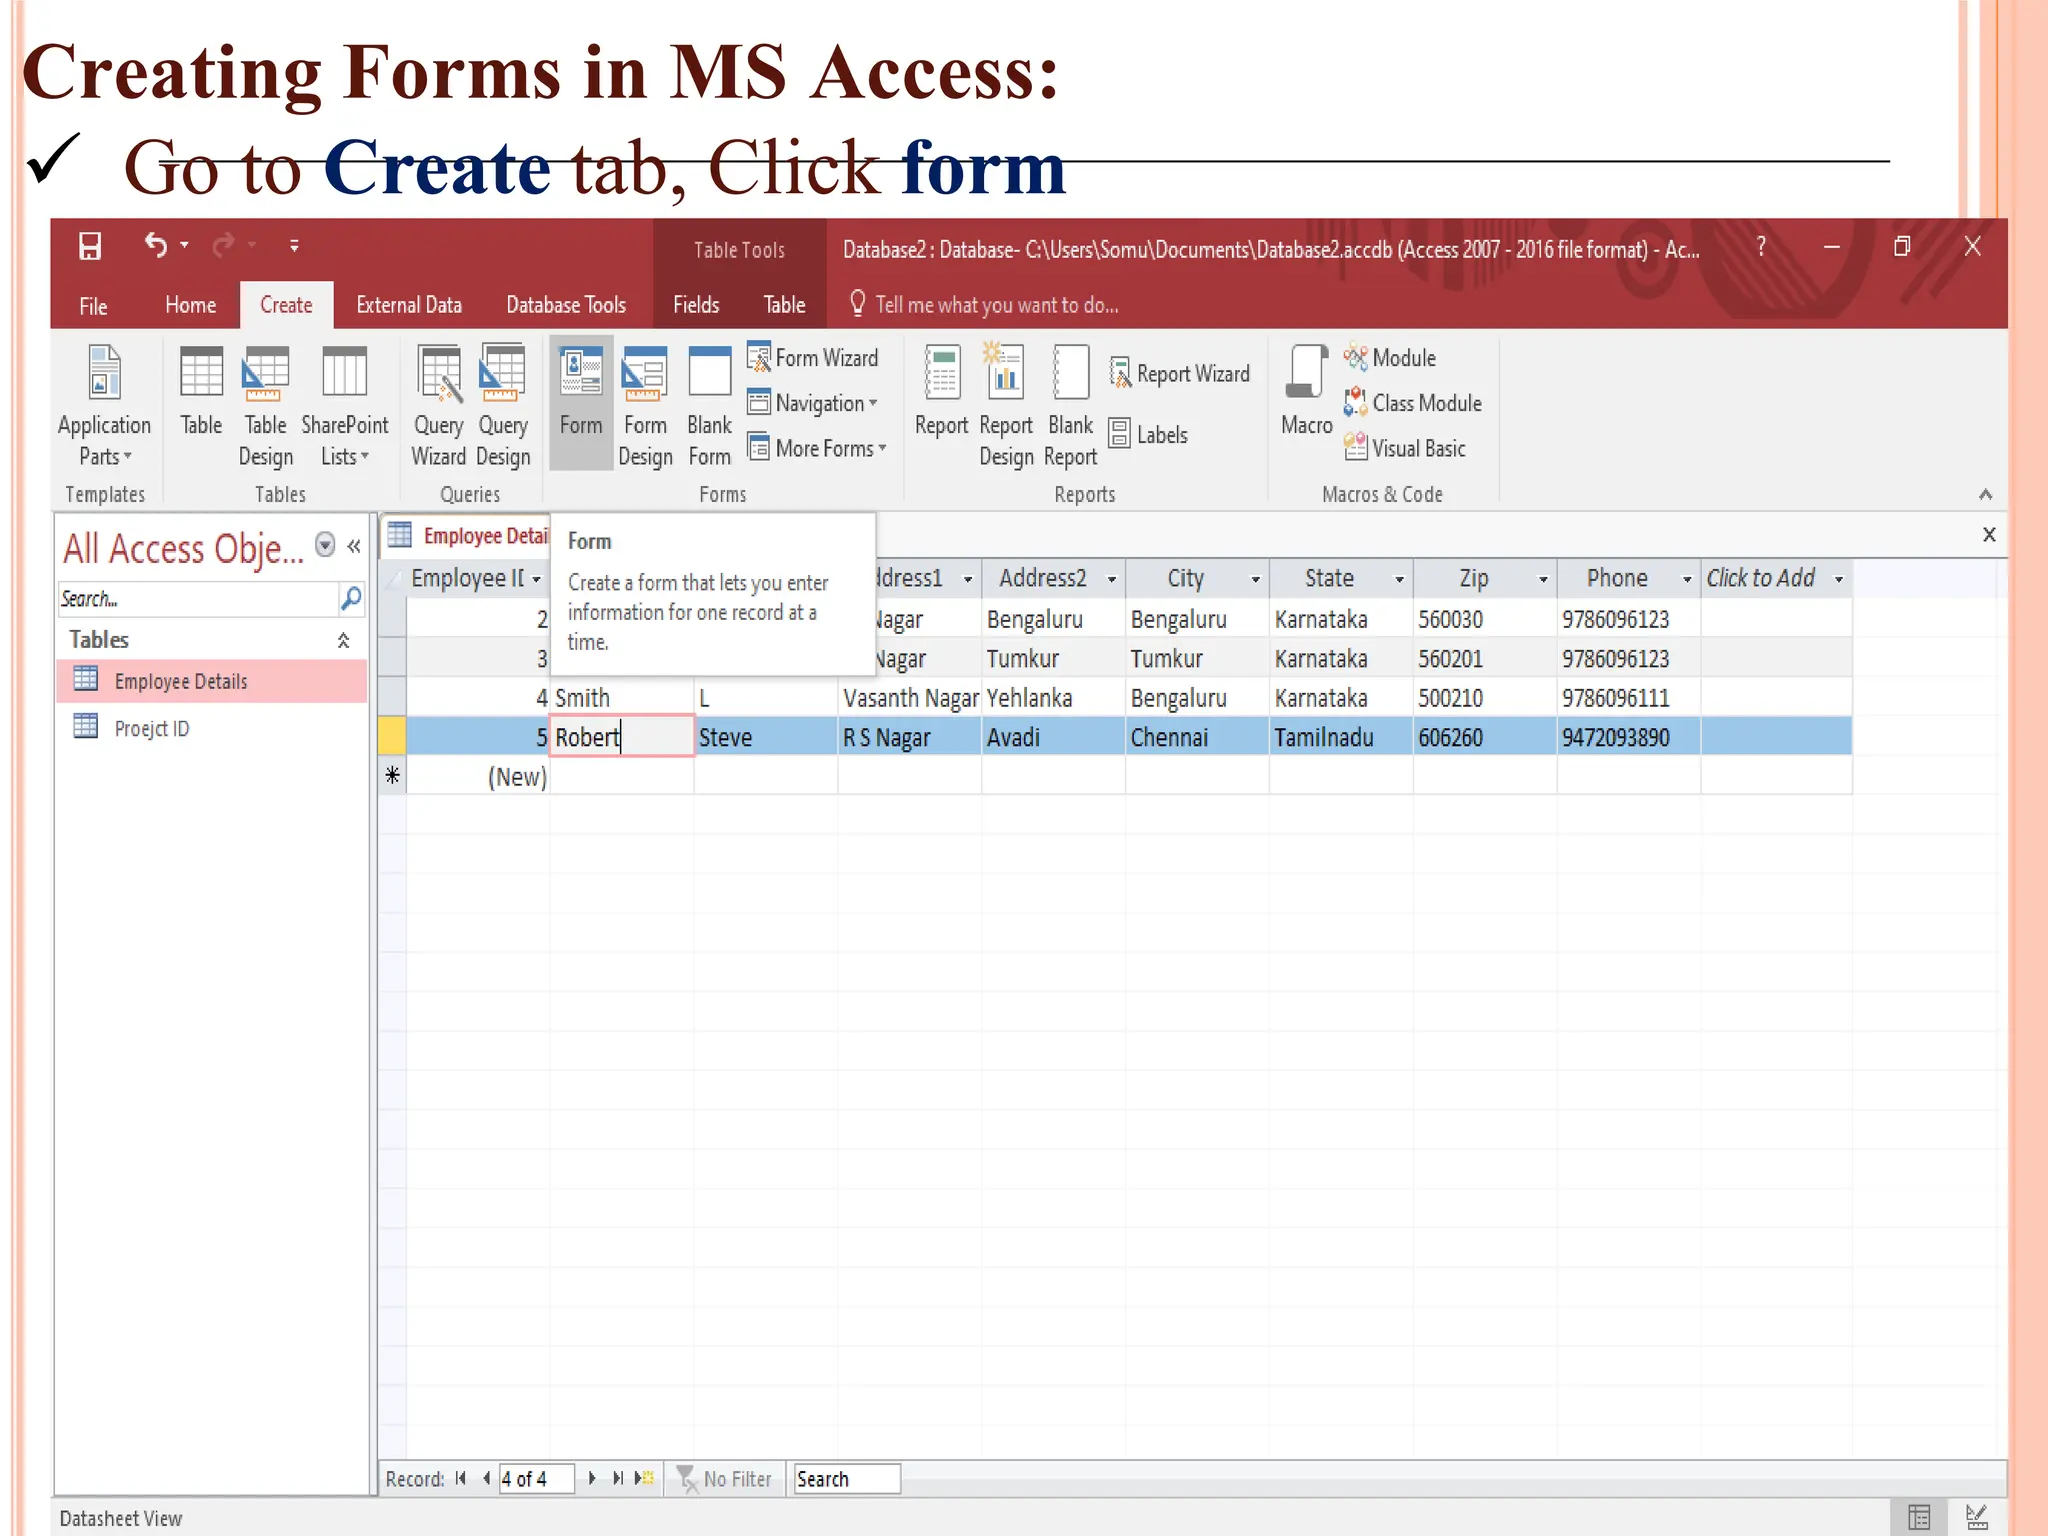
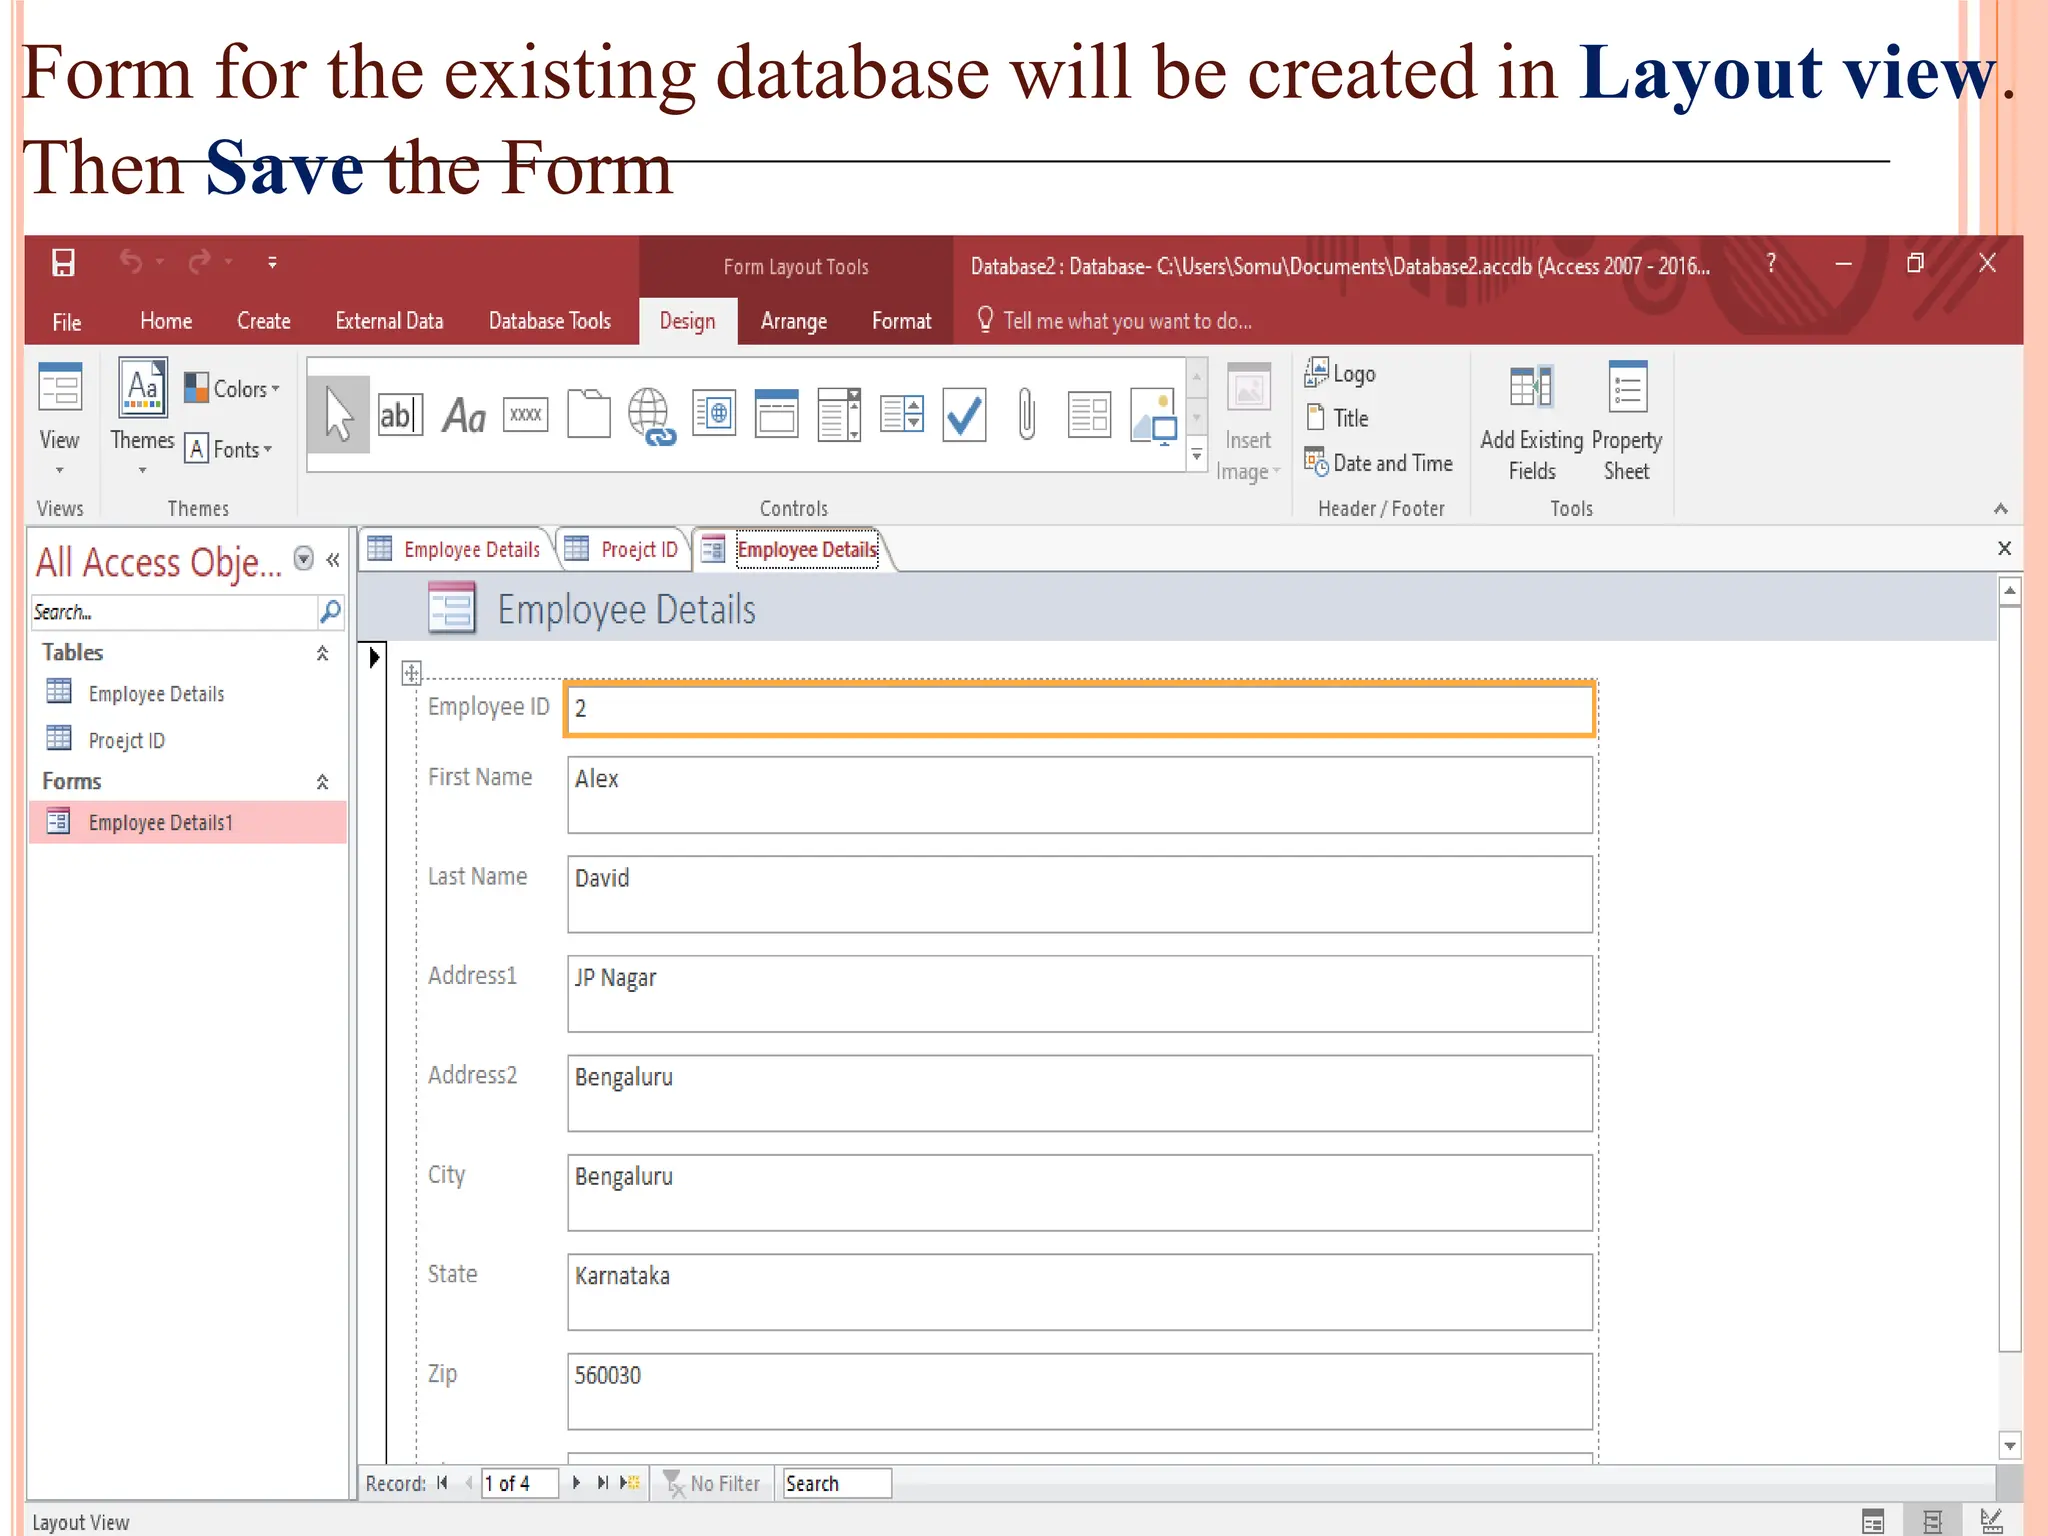
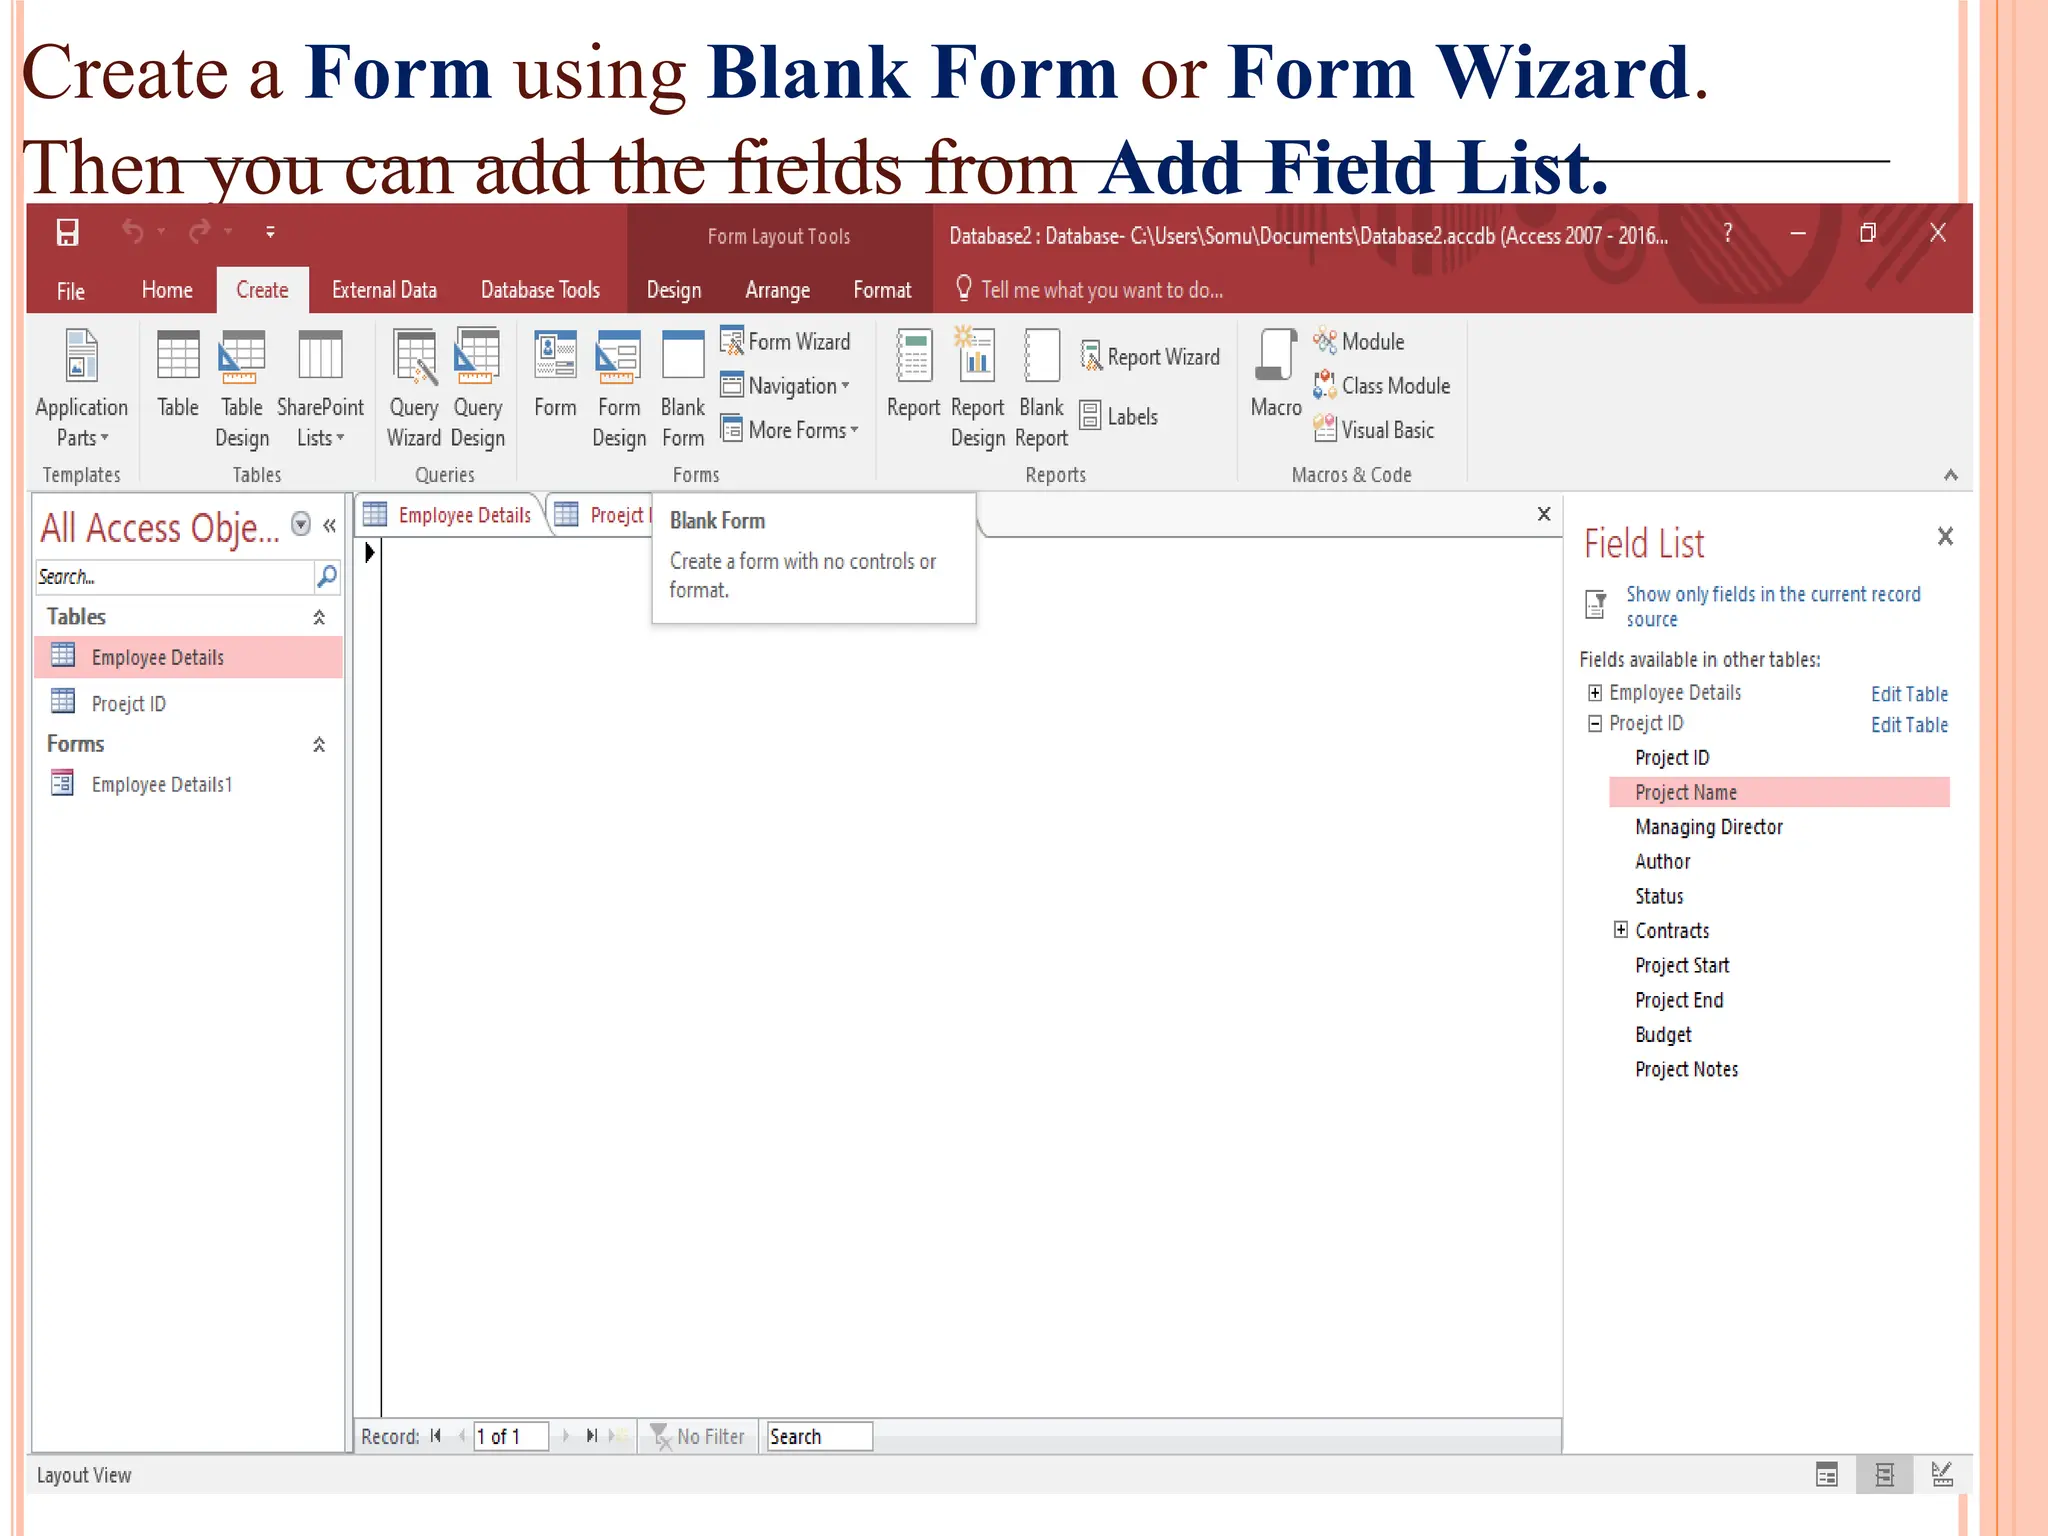
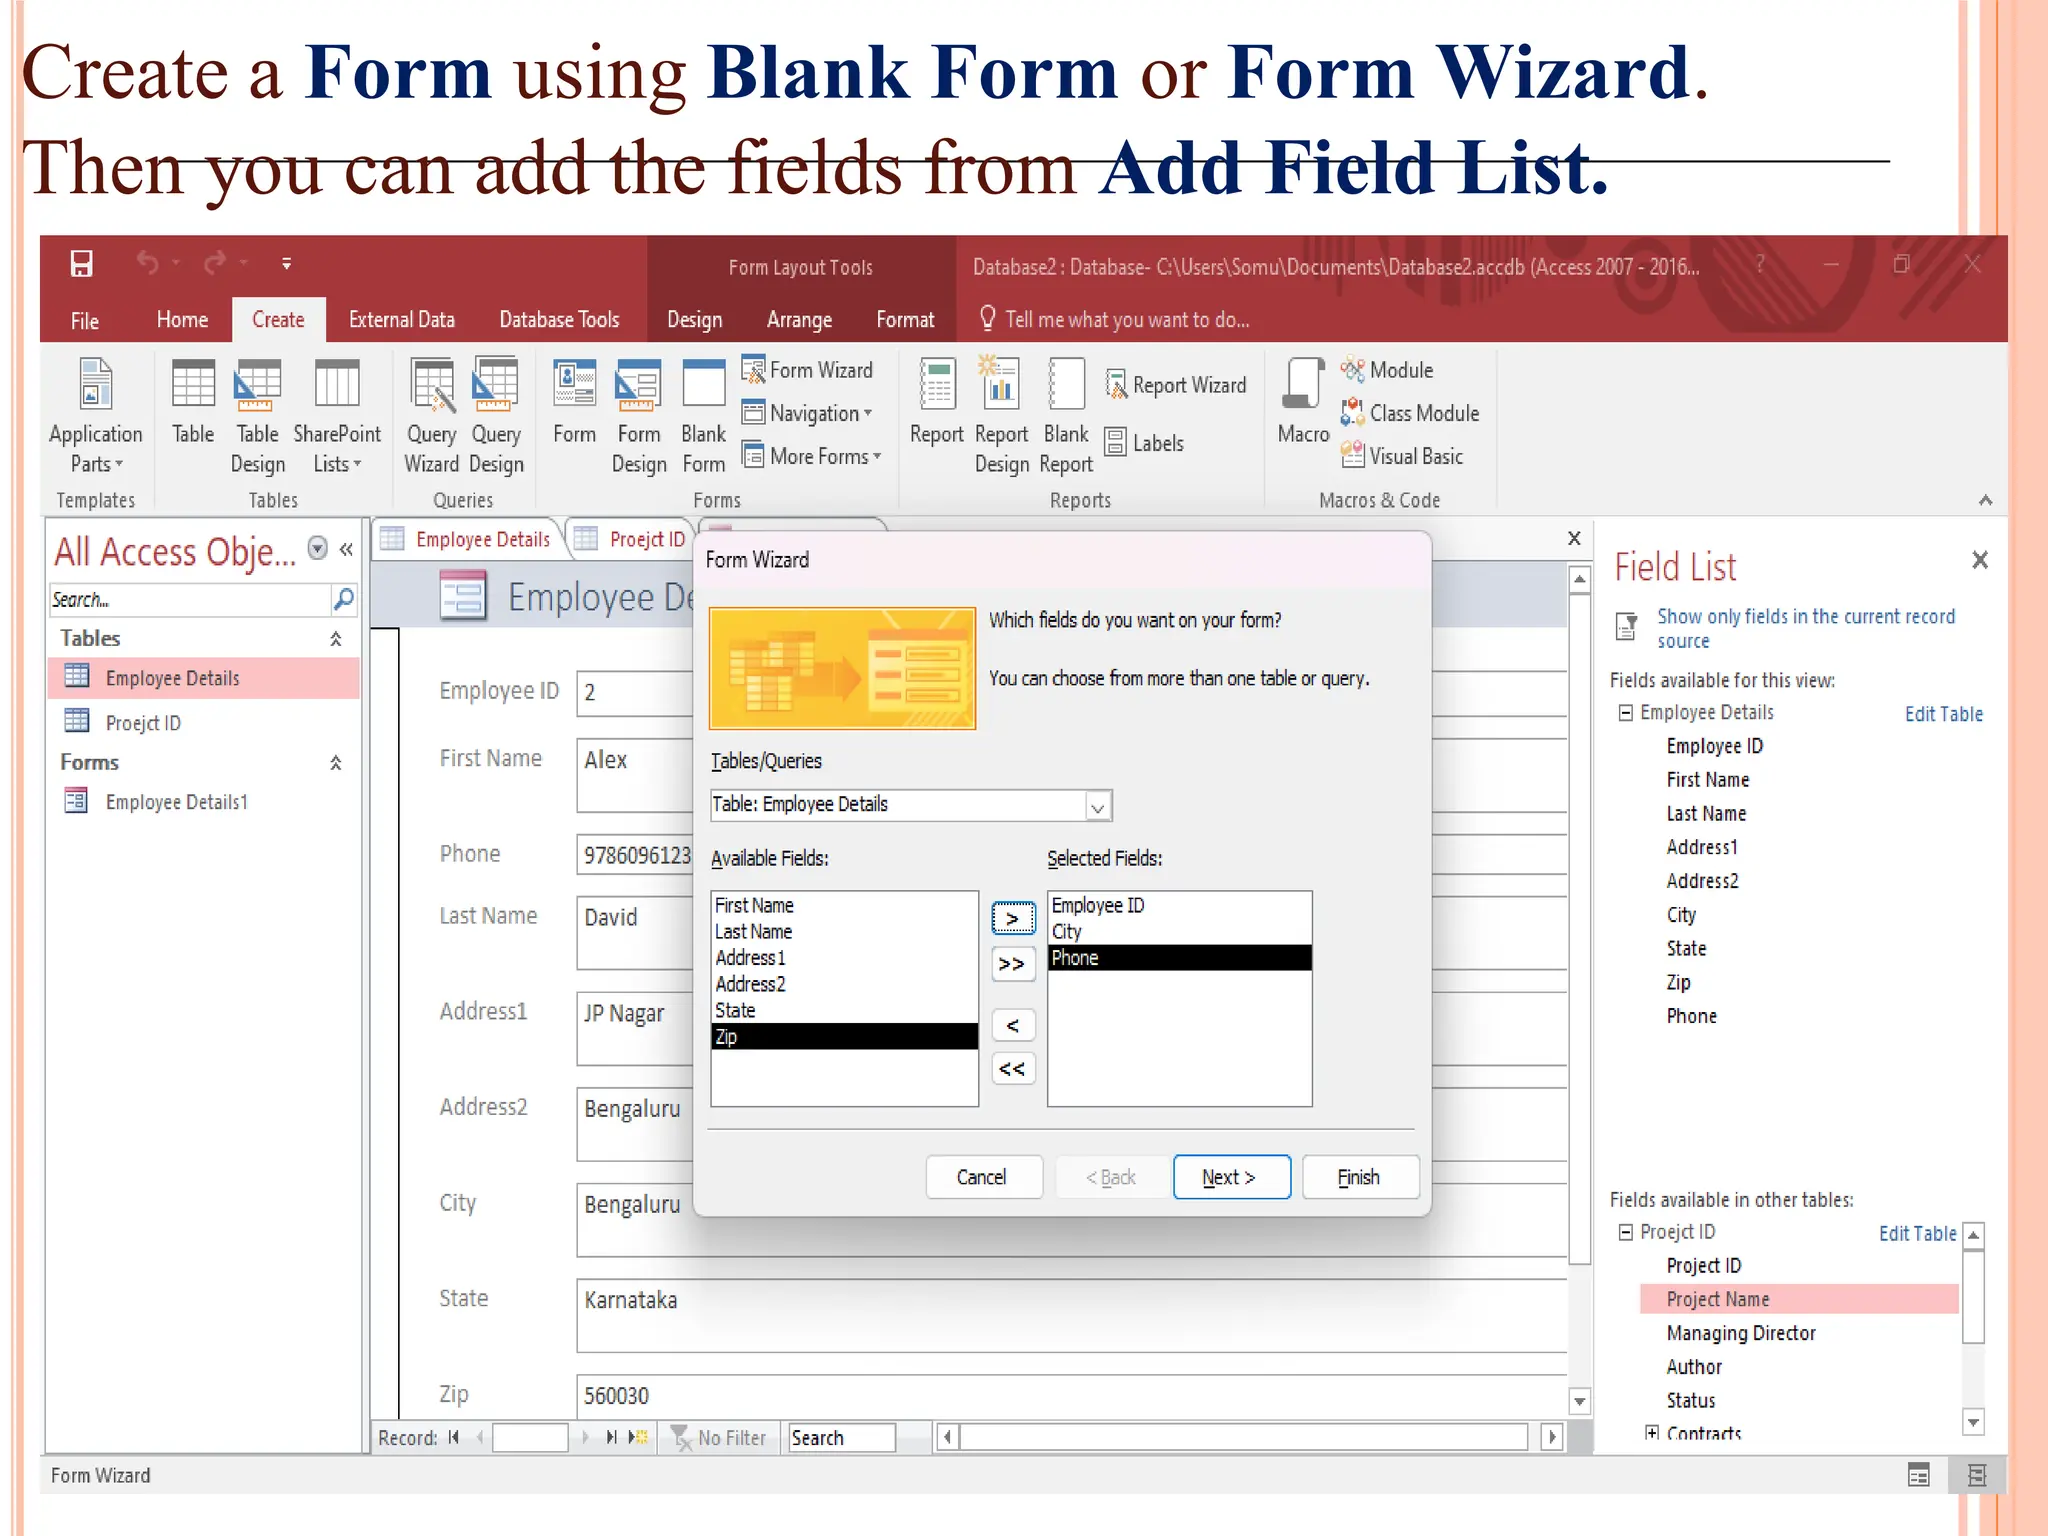
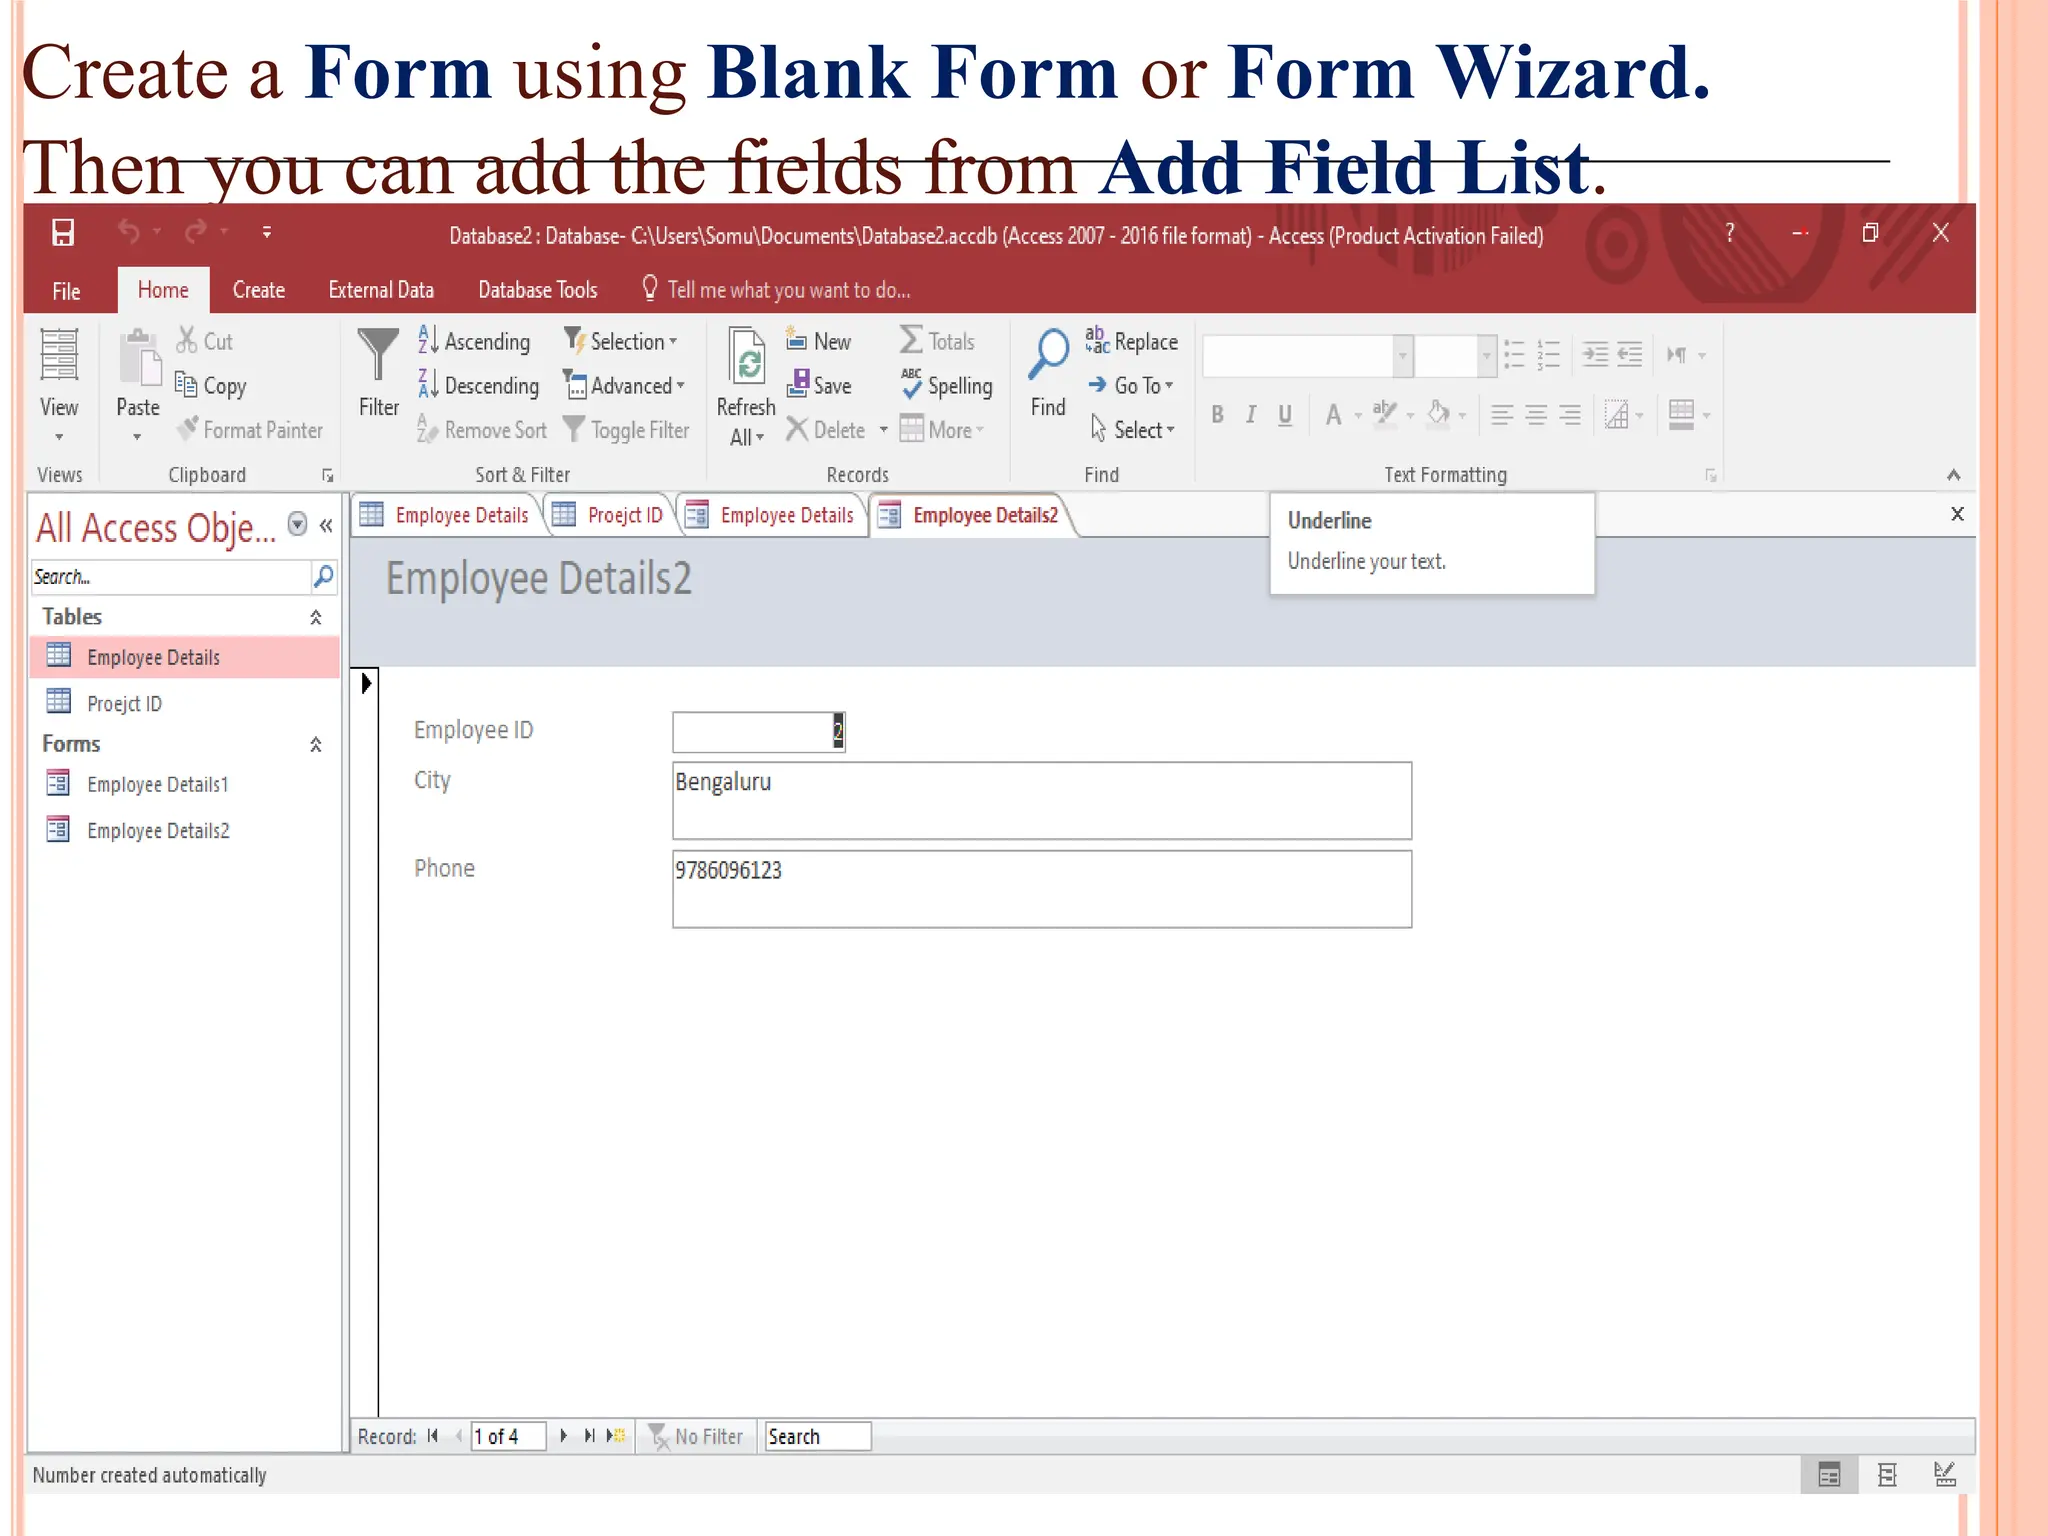
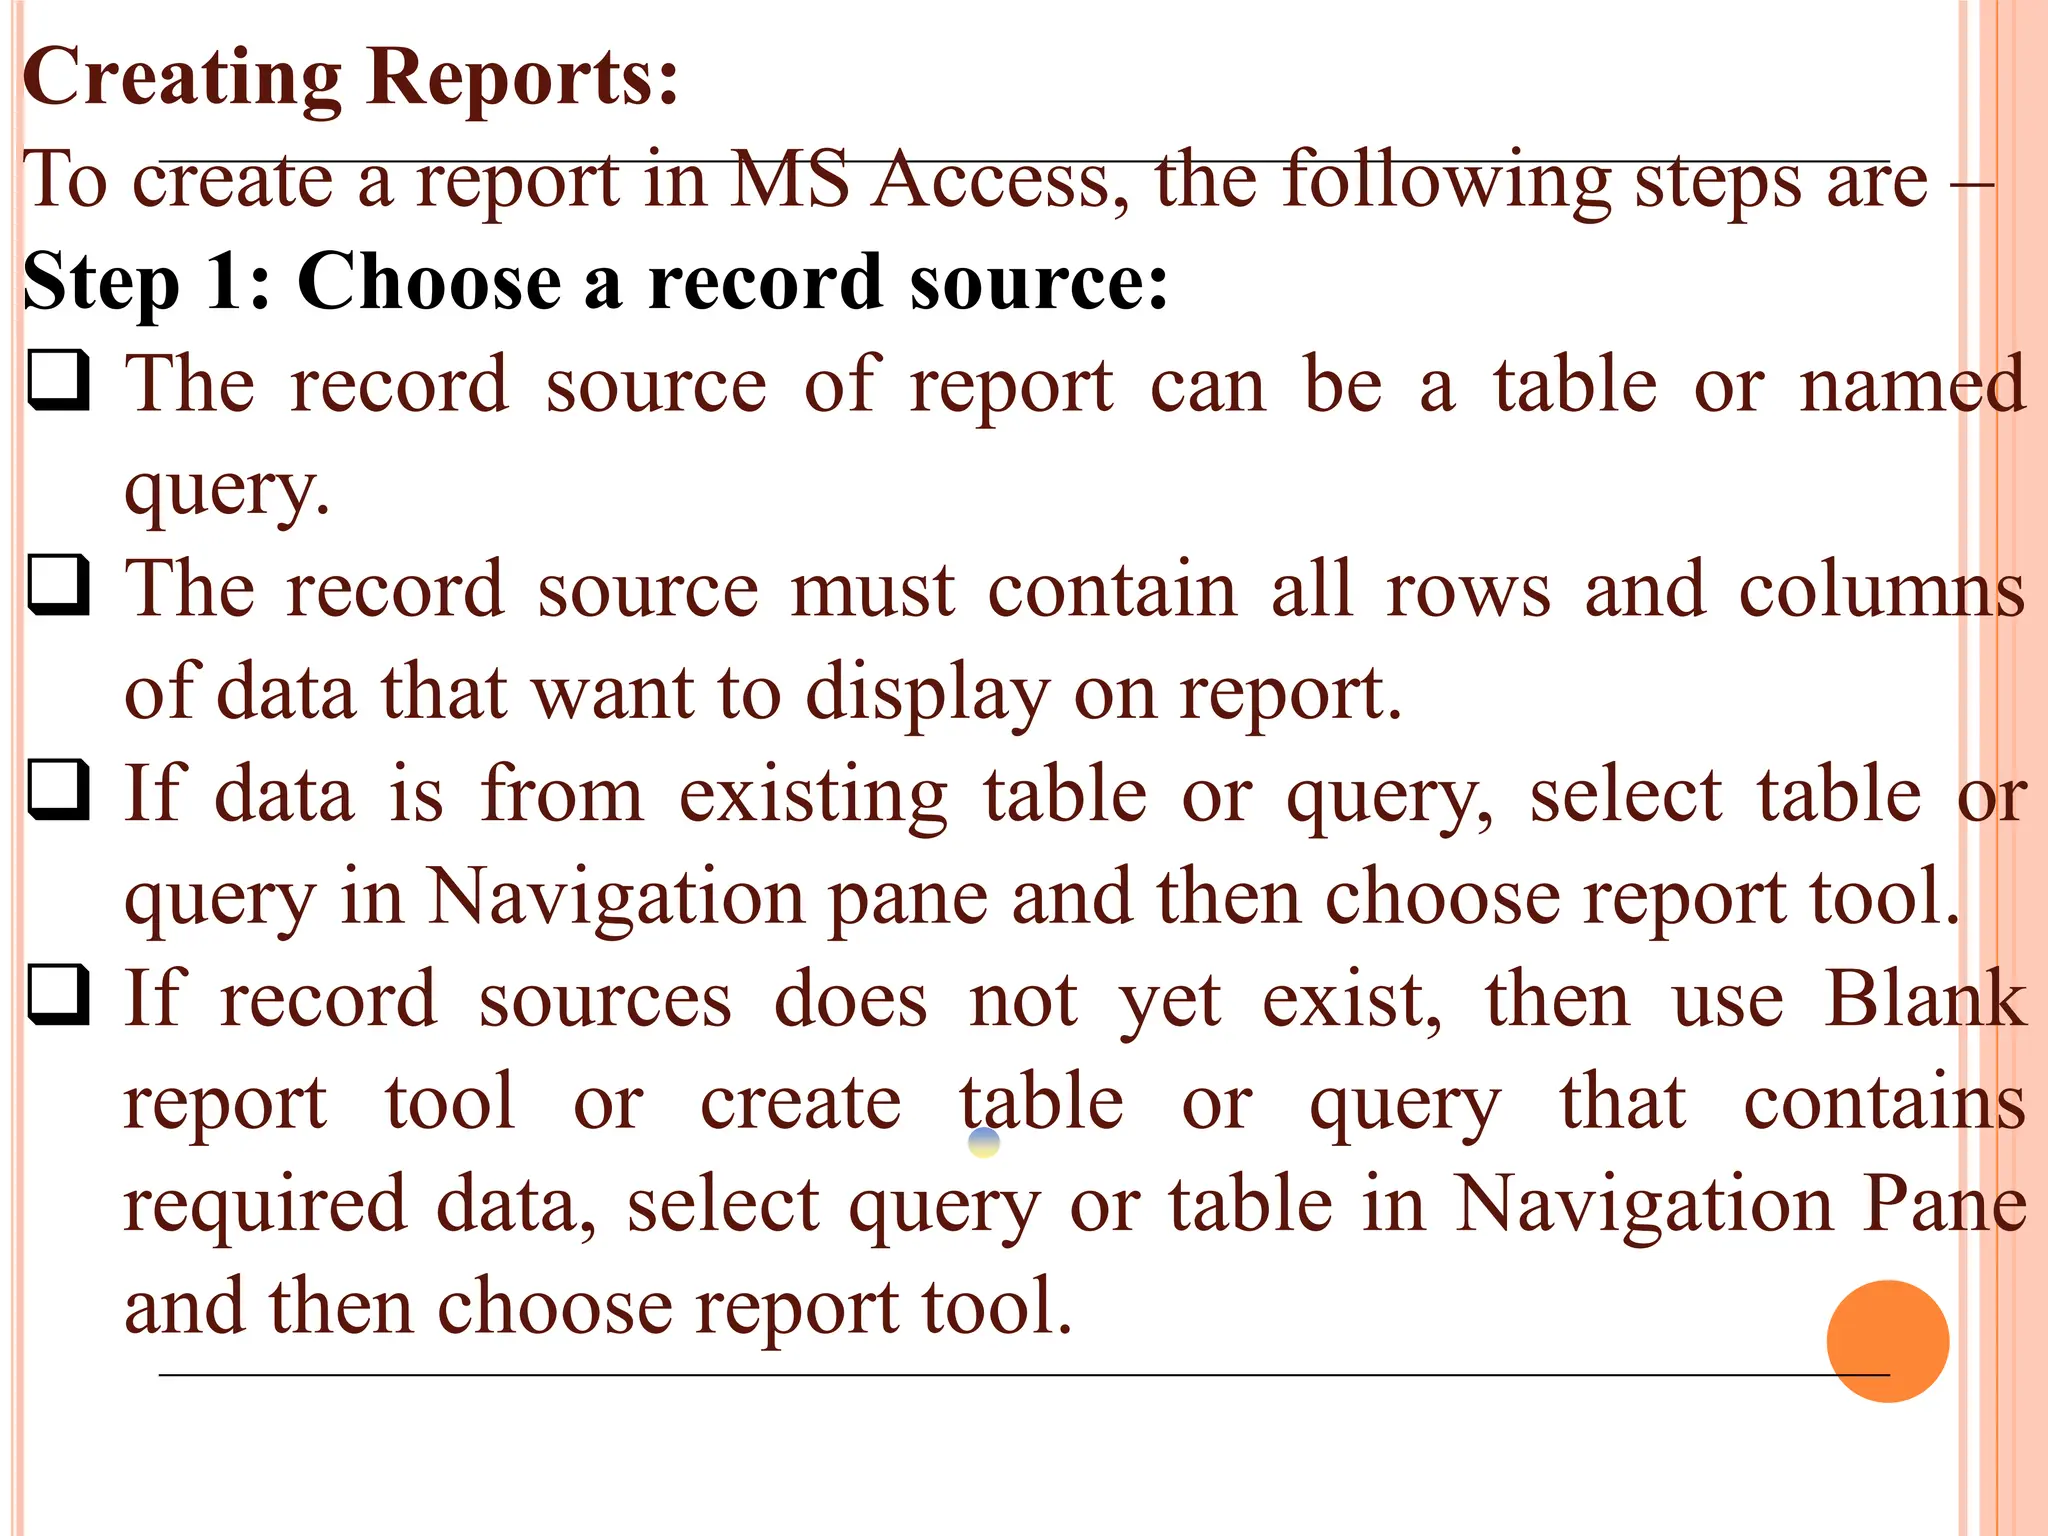
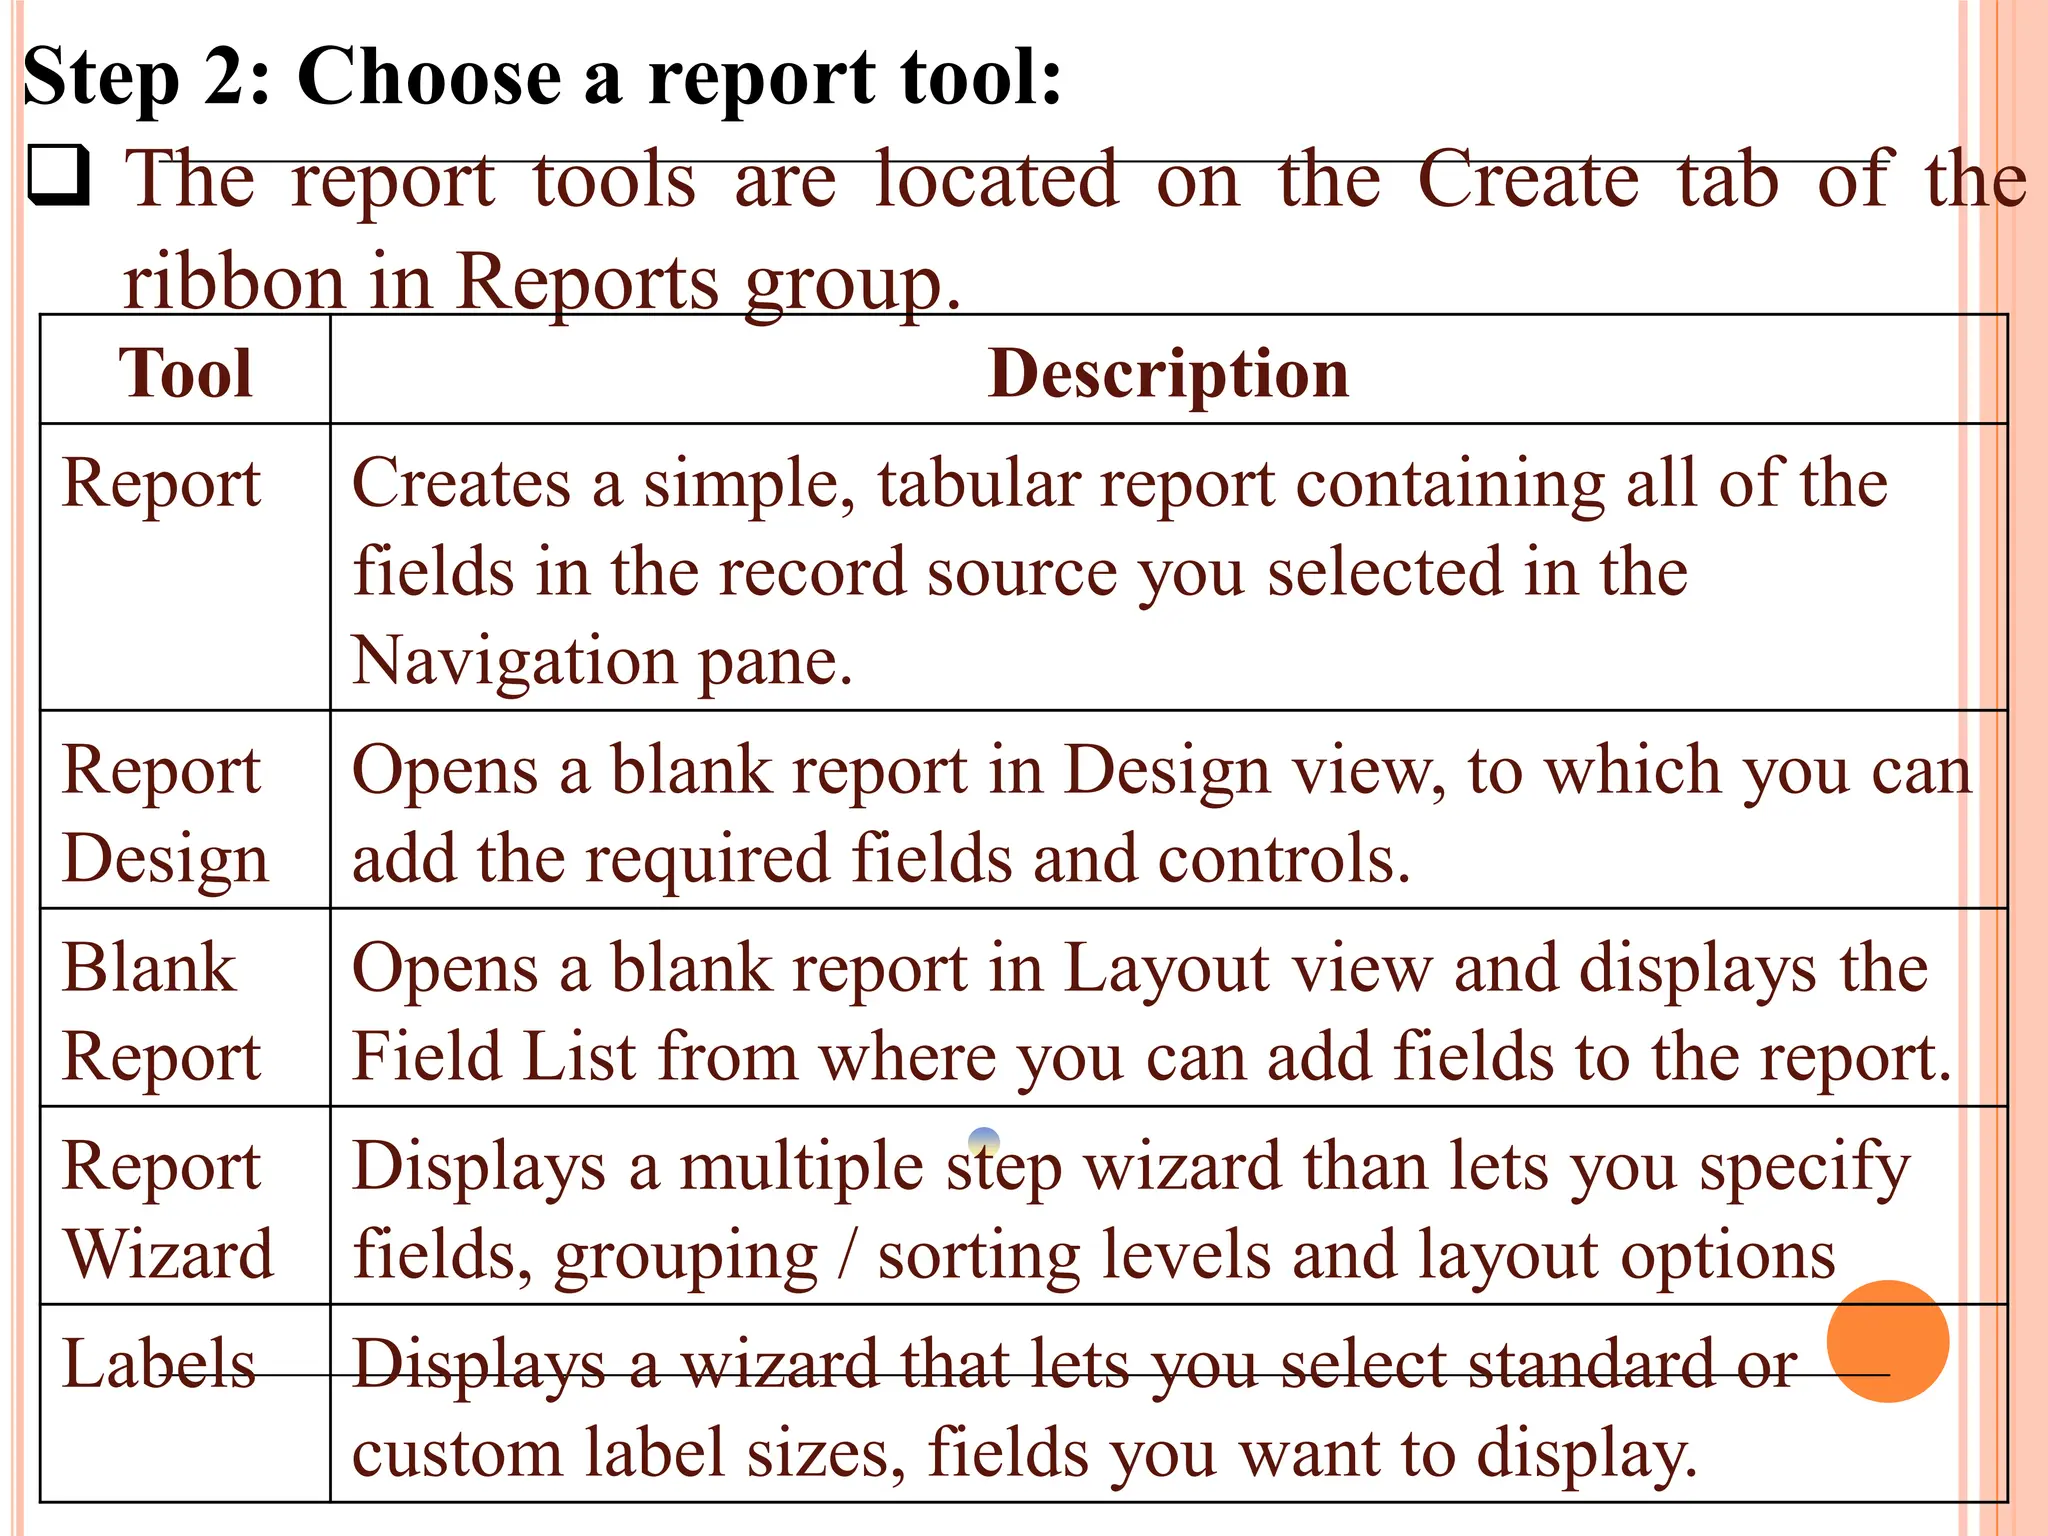
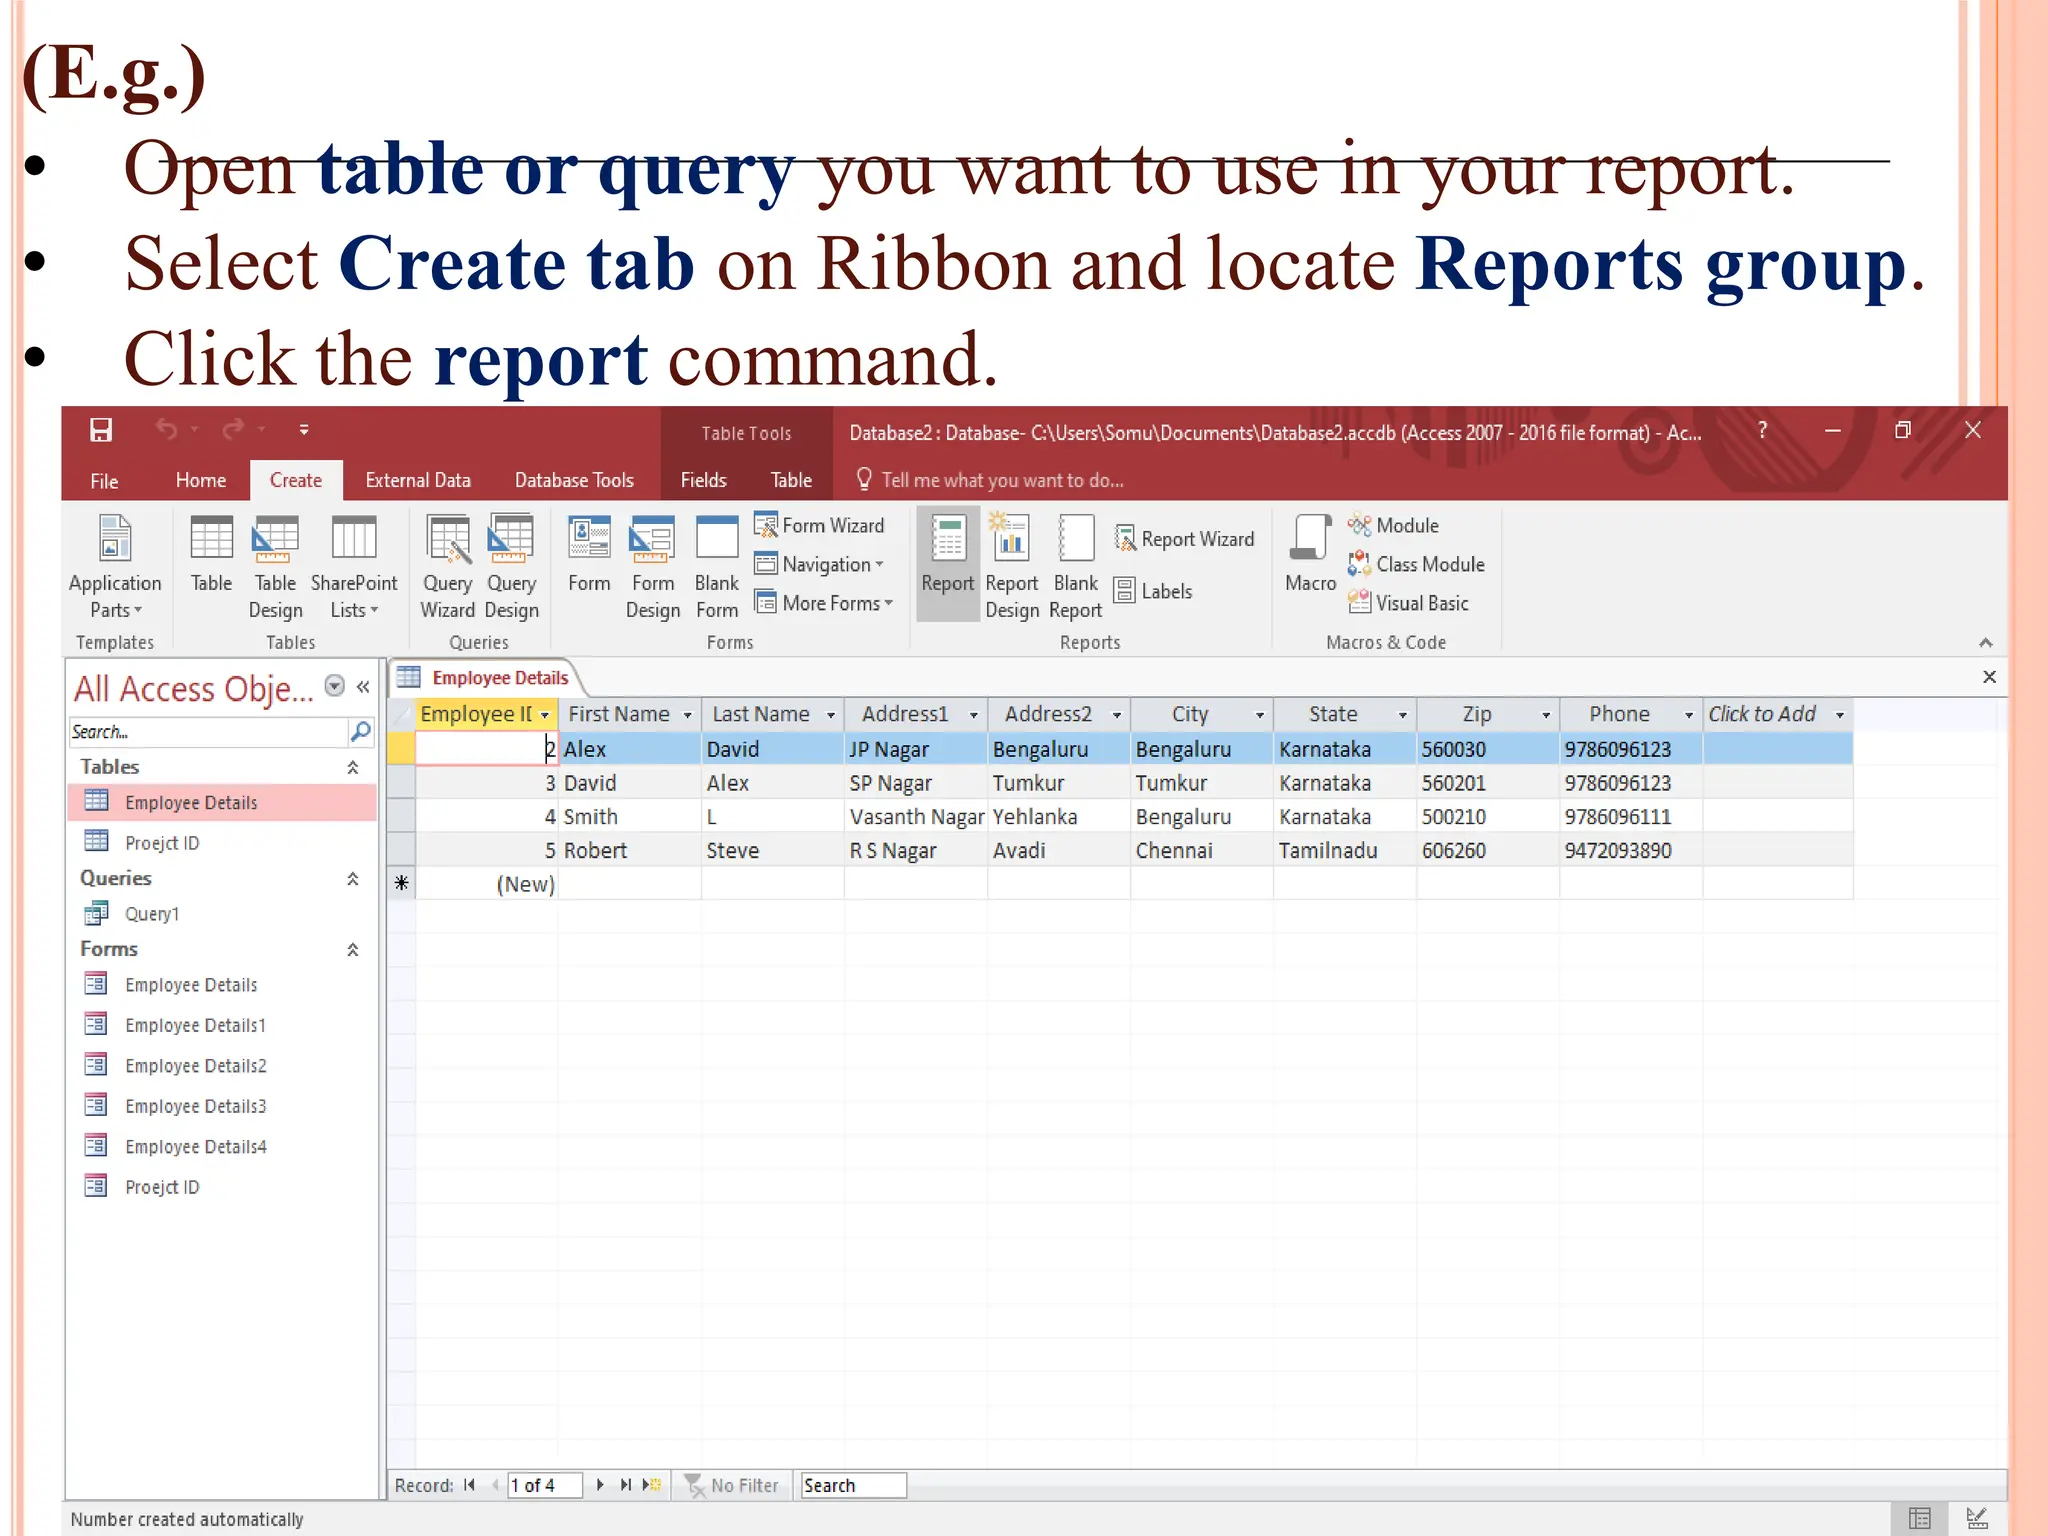
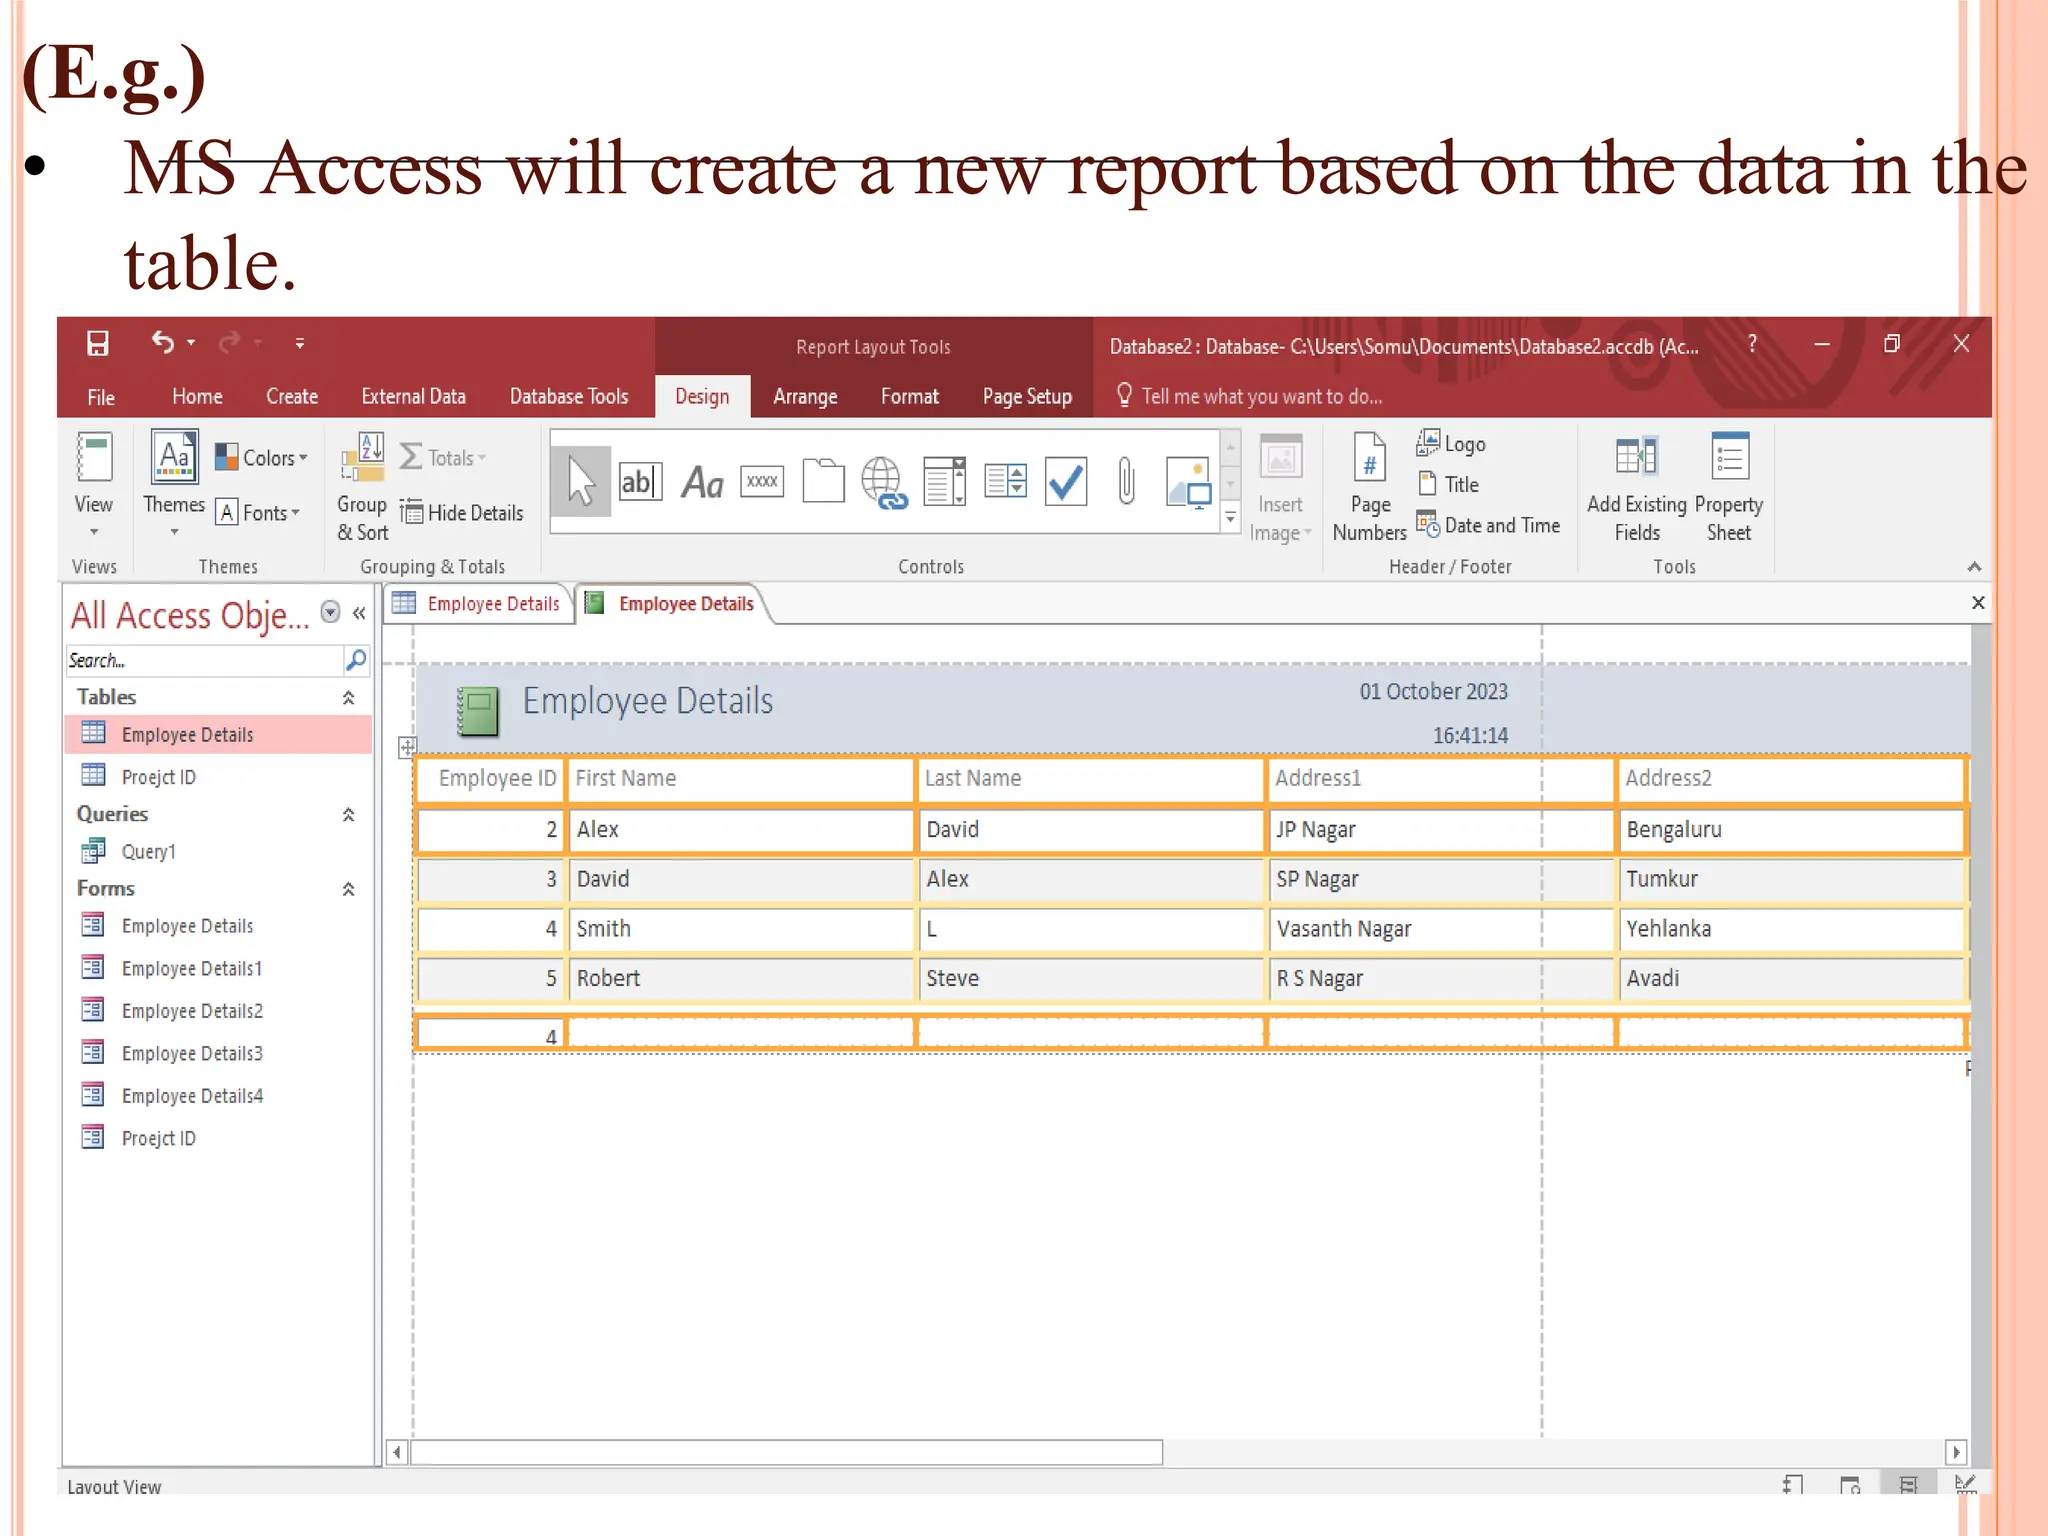
Creation and use of forms and reports in MS Access for data entry, formatting, and summarizing information for easy access.
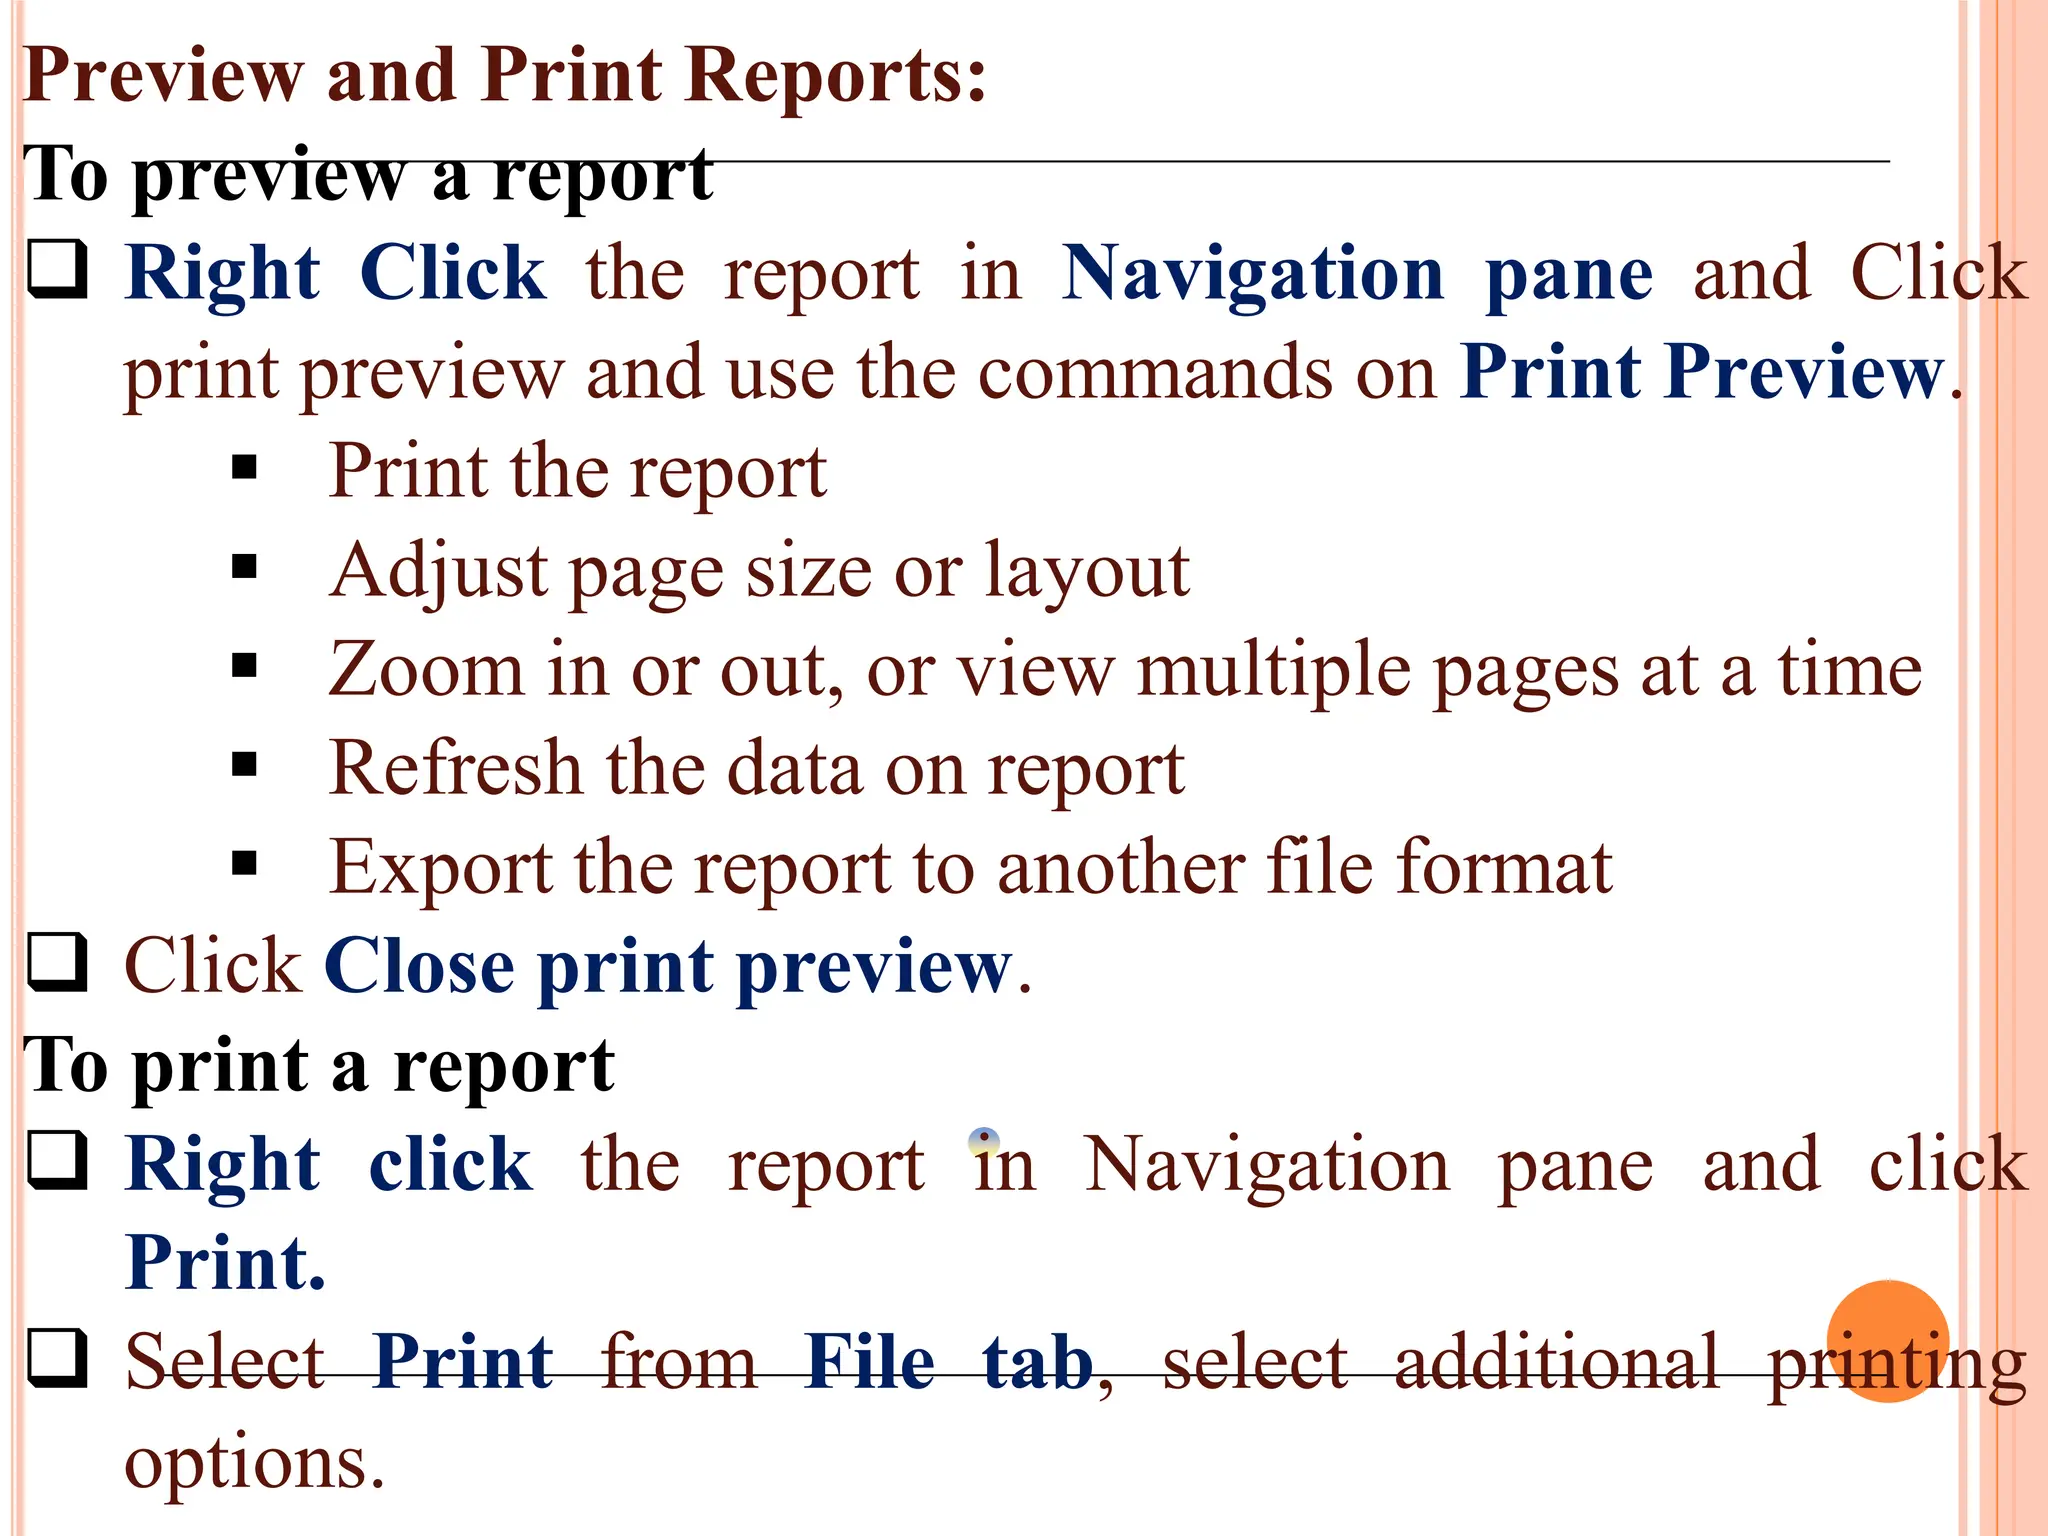
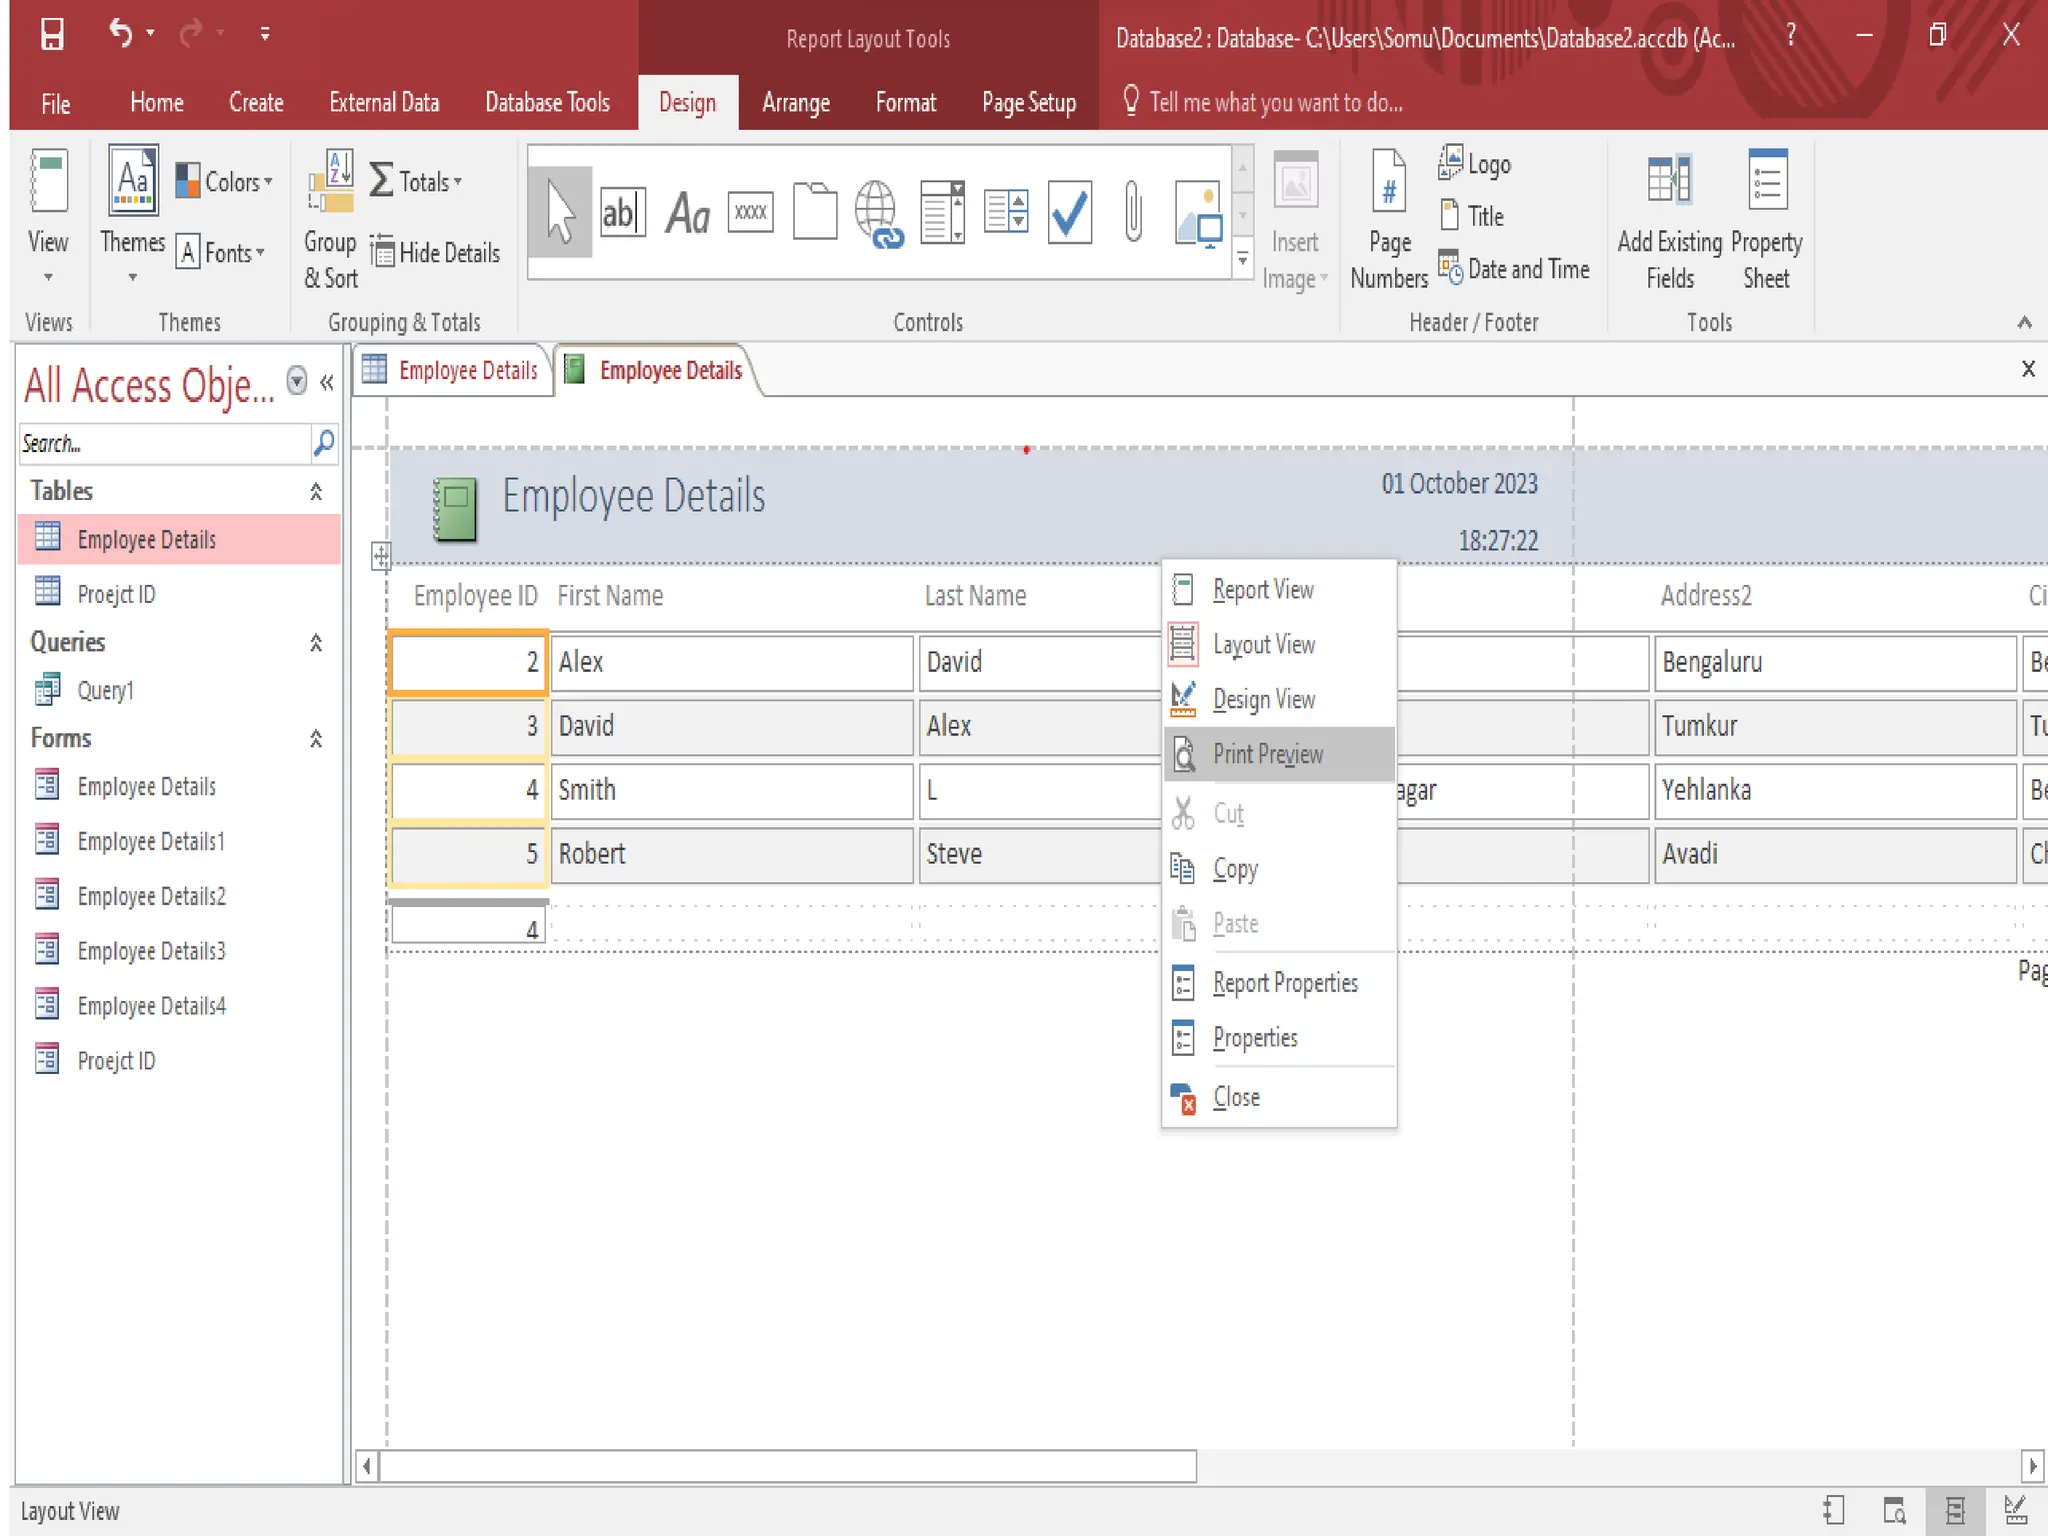
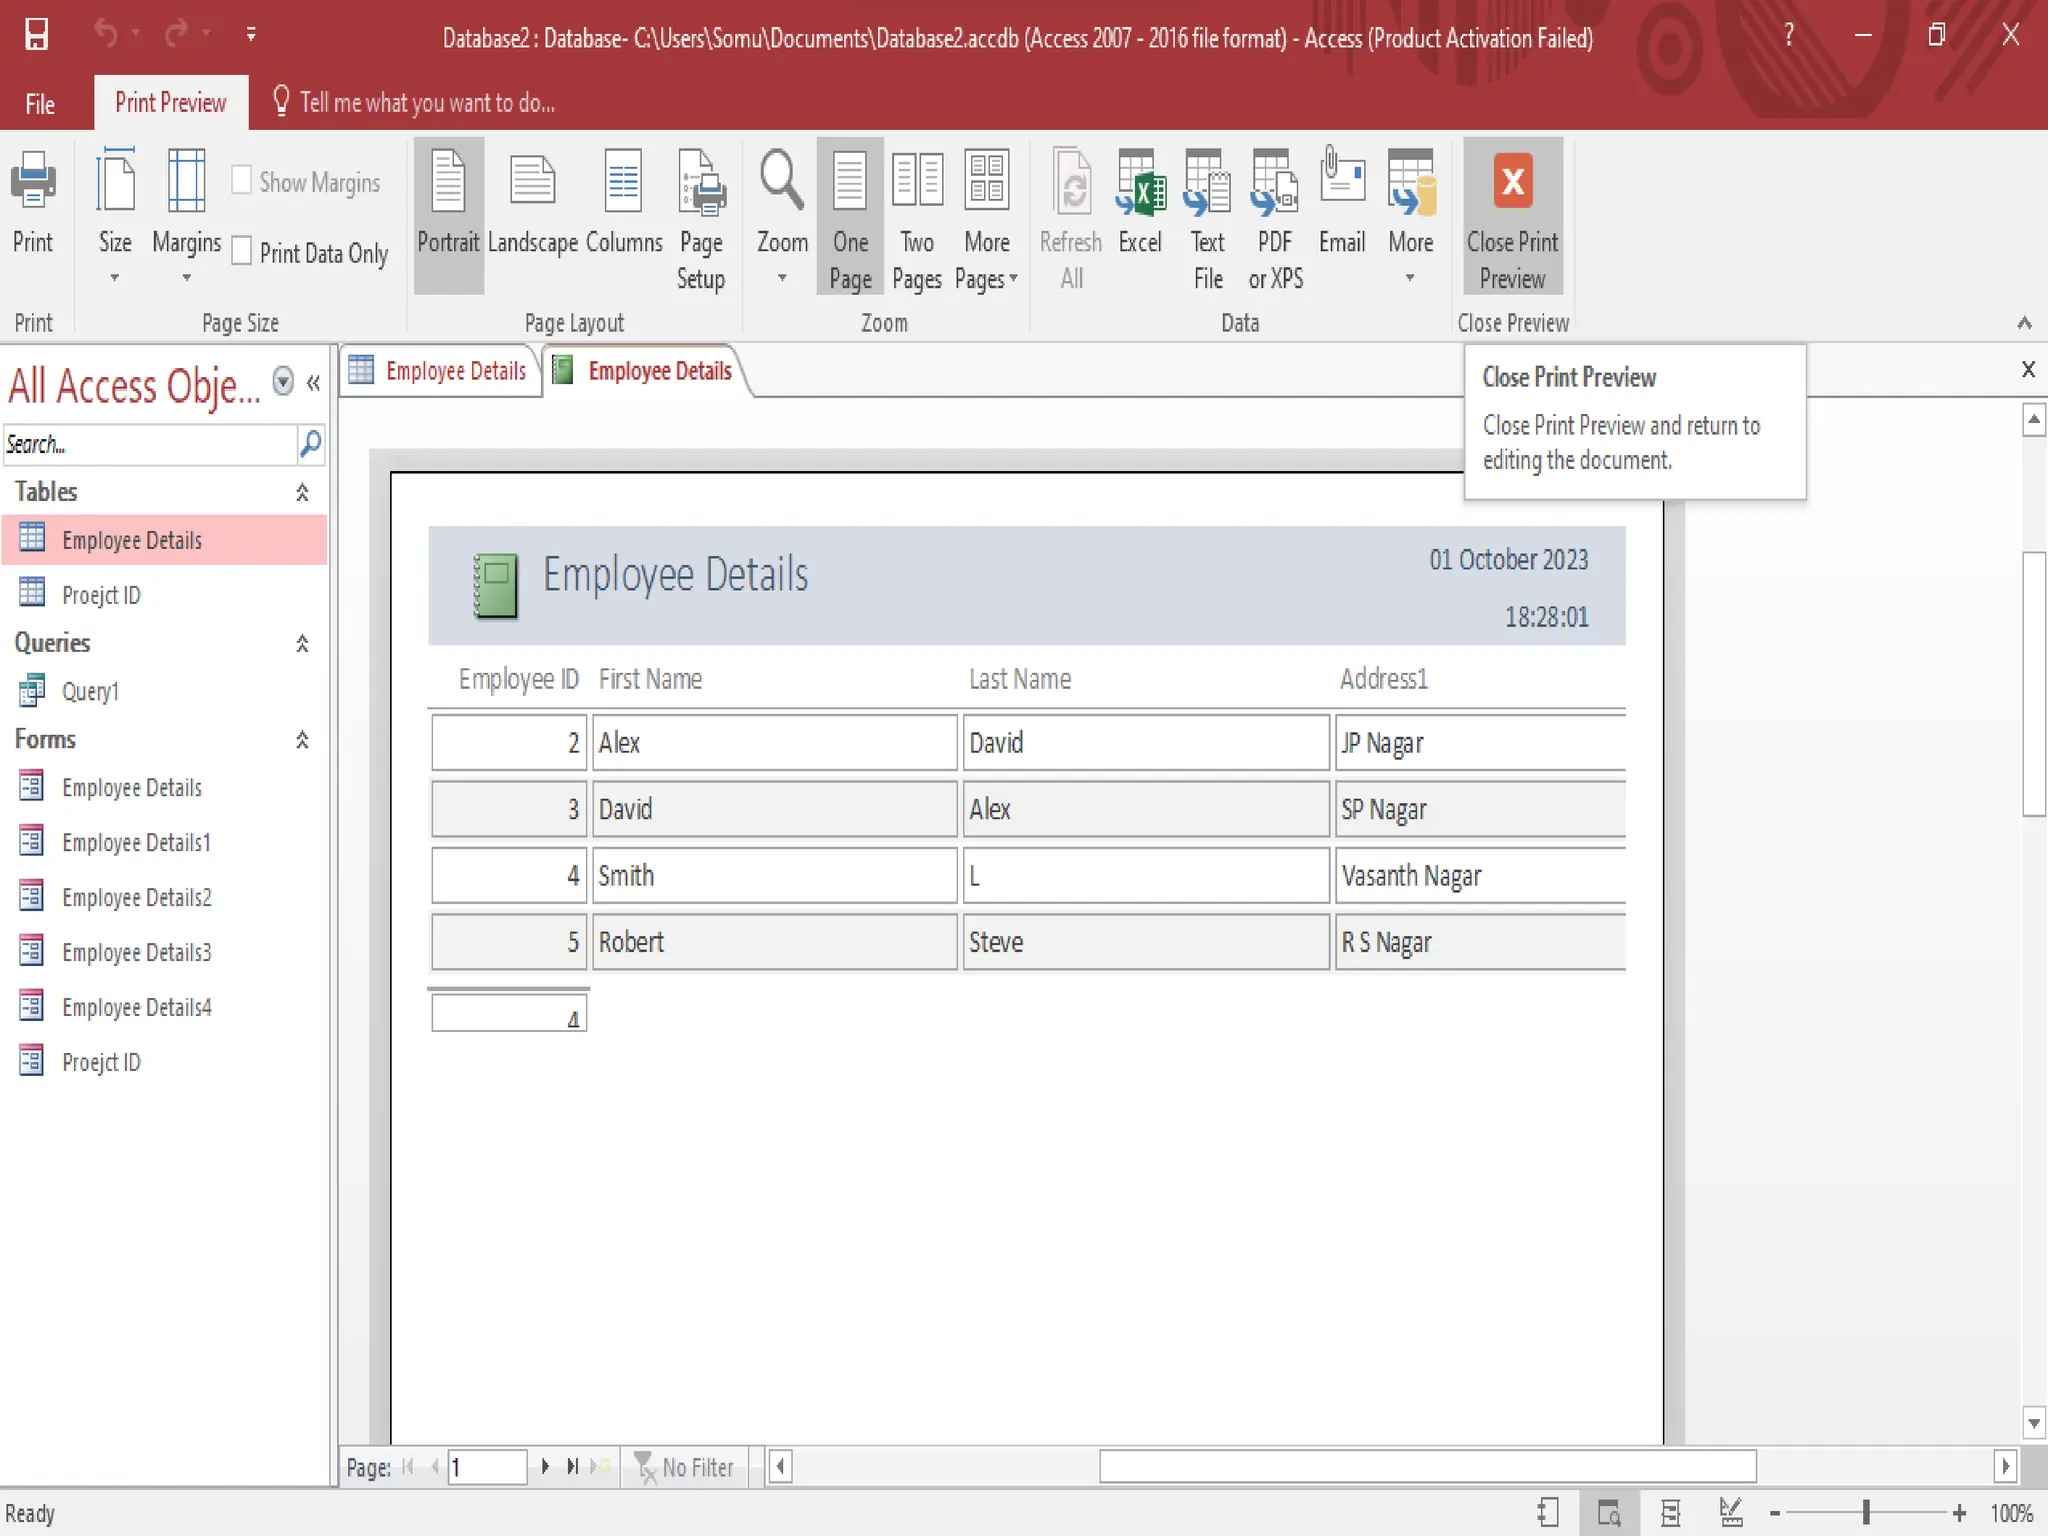
Procedure for previewing and printing reports in MS Access along with tips for formatting and utilizing reports effectively.
UNIT – 3
DATABASEMANAGEMENT SYSTEM
Introduction to Data and Information,
database, types of database models,
Introduction to DBMS, Difference between file
management systems and DBMS, advantages
& disadvantages of DBMS, Data warehousing,
Data mining, Applications of DBMS,
Introduction to MS Access, Create Database,
Create Table, Adding Data, Forms in MS
Access, Reports in MS Access.
3.
DATA
Definition:
“ Data areraw fact or elementary descriptions of things, events,
activities, transactions that are stored, recorded & classified but
not organized to convey any specific meanings.”
(E.g.) Employee No, Bank balance, Student details, etc.
Types of Data:
1. Primary Data.
2. Secondary Data. (Magazines, Journals, Past data, etc.)
3. Qualitative Data. 4. Quantitative Data.
Other types of data:
1. Alphanumeric data. (Letters, characters)
2. Image data. (Image, Pictures)
3. Audio data. (Sound, noise, tones)
4. Video data. (moving image, picture)
4.
DATABASE
Definition:
“Database is acollection of inter-related data which
is used to retrieve, insert and delete the data
efficiently. It is also used to organize the data in the
form of a table, schema, views and reports, etc.”
“A well-organized collection of data that are related
in a meaningful way, which can be accessed by
different users but stored only once.”
(E.g.) Student’s record register, address book,
dictionary, etc.
5.
DATABASE
Database Operations:
The mostcommonly used operations performed on the
databases are –
a) Insertion: To add new data into the database.
b) Selection: To view or retrieve the stored data.
c) Updation: To modify or edit the existing data.
d) Deletion: To remove or delete the existing data
from the database.
e) Sorting: To arrange the data in a desired order.
(ascending / descending).
6.
DATABASE MODEL
Database Model:
“Database Model can be defined as an integrated collection
of concepts that can be used to describe the logical structure
of the database including data types, relationships between
data and constraints that should apply on the data.”
“Data modeling is the process of creating a data model for
the data to be stored in a database.”
Components: A Data model comprises of 3 components –
a) Structural Part – consists of set of rules according to
which databases can be constructed.
b) Manipulative Part – it defines types of operation that are
allowed on the data. (updation or retrieving)
c) Integrity Rules – which ensures that the data is accurate.
7.
Importance of DatabaseModel:
A data model possesses the following characteristics –
It offers simple representation, usually graphical, of complex
real world data structures.
It facilitate interaction among designer, applications
programmer and end user.
Good database design uses an appropriate data model as its
foundation.
End users have different views and needs for data.
It provides a blue print of the data that is required for a
functional system.
It provides a methodology for representing the objects of a
particular application environment.
It is used to define relational tables, primary and foreign keys,
stored procedures and packages.
8.
Major events indata modeling includes -
Defining the data (its types and sizes).
Identifying the data and associated processes.
Ensuring data integrity.
Defining the data management processes.
Specifying the data storage requirement.
Data Model Basic building blocks:
1. Entity: Anything about which data are to be collected and
stored.
(E.g.) Student, Teacher, Employee, Manager.
2. Attribute: A Characteristic of an entity.
(E.g.) Name, Salary, Job, etc.
9.
3. Relationship: Anassociation among (two or more) entities.
One-to-One (1:1) relationship (E.g.) Department Vs
Manager.
One-to-Many (1:M) relationship (E.g.) Manager Vs
Employer.
Many-to-One (M:1) relationship (E.g.) Employee Vs
Manager.
Many-to-Many (M:M) relationship (E.g.) Student Vs
Course.
4. Constraint: A constraint is a restriction placed on the data
and helps to ensure data integrity.
• Constraints are normally expressed in the form of rules.
(E.g.) An Employee’s salary must be between Rs.10000 and
Rs.50000.
• Each class must have one and only one teacher.
10.
TYPES OF DATABASEMODEL
The most widely accepted data models are –
1. Hierarchical Model:
It is one of the oldest database models, dating from late 1950s.
The general shape of this model is like Organizational chart
and node represents a particular entity.
A model used the tree as its basic structure, which consists of a
hierarchy nodes with single node called root, at highest level.
A node may have no. of children, but each child node may
have only one parent node. This structure is referred to as
“Inverted Tree”.
The parent-to-child creates one-to-many relationship, but
child-to-parent creates one-to-one relationship.
11.
In hierarchicaldata model, records are arranged in a top down
structure.
The nodes of tree represent data records & relationships are
represented as links or pointers between nodes.
To locate particular record, it start at top of tree with a parent
record and trace down the tree to the child.
(E.g.) Hierarchical data model for University
University – Root node, Departments - Children
University
Humanities Dept. CS Dept.
Physical Sciences Computer Lab
12.
Advantages:
Simplicity –the relationship between various layers is logically
simple.
Data Security – it offers data security that is provided by the DBMS.
Data Integrity – there is always a link between parent segment and
child segment.
Efficiency – it is very efficient because database contains a large no. of
one-to-many relationship.
Disadvantages:
Implementation Complexity – it is quite complex to implement.
Database Management Problem – it needs to make changes in entire
application program that access the database.
Lack of structural independence – as we change the structure then it
becomes compulsory to change the applications too.
Operational Anomalies – it suffers from insert, delete and update
anomalies also retrieval operation is difficult.
13.
2. Network Model:
This model was developed to overcome limited scope of
hierarchical model. (multiple parent-child relationships are
used).
This model presented in CODASYL (Conference on Data
Systems Languages) through its Data Base Task Group
(DBTG), which is called DBTG model.
It uses a network structure, which is data structure consisting
of nodes and branches.
There is no distinction between parent and child nodes.
In this model, directed graphs are used instead of tree structure
to represent the structure of database.
It permits a child node to have more than one parent nodes,
whereas hierarchical model does not allows a child node to
have multiple parent nodes.
14.
(E.g.) Network datamodel for University
Humanities Dept. node is associated with CS Department
Computer Lab and Physical Sciences are associated with both
Humanities Dept. and CS Dept. nodes.
University
Humanities Dept. CS Dept.
Library Computer Lab
15.
Advantages:
Conceptual Simplicity– network model is also simple and easy to
implement.
Capability to handle more relationship types – it can handle one-to-
one (1:1) and many-to-many (M:M) relationship.
Ease to access data – Rapid and easy access to data is possible due to
multiple access.
Data Integrity – there is a link between parent and child segment.
Data Independence – this model is better than hierarchical model.
Disadvantages:
System Complexity – all records have to maintain using pointers thus
DB structure becomes more complex.
Operational Anomalies – large no. of pointers is required so insertion,
deletion and updating more complex.
Absence of structural independence – as we change the structure then
it becomes compulsory to change the applications too.
16.
3. Relational Model:
This is popular model and first outlined by Dr. E.F.Codd in June
1970.
It is considered as most popular developments in DB technology
as it represent most of the real world objects.
Data is organized in terms of rows and columns in a table known
as relation.
Each table consists of rows also known as ‘tuples’ ( A tuple
represents a collection of information that describes a person,
place, thing) and columns also known as ‘attributes’ (An attribute
represents the characteristics of a person, place or thing).
No. of tuples in a relation determines its cardinality and no. of
attributes in tuple determines its degree.
Intersection of a row and column must give a single value & not
set of values.
17.
Any tablecan be accessed directly without having to access child
tables through a hierarchy or network of parent tables.
It relates or connects data in different tables through use of
common field or attribute.
This model doesn’t require any information that specifies how
data should be stored physically.
Relatively complex and efficient data structure can be created
with relational data model.
(E.g.) Relational data model
Attributes
Tuple
Relation
18.
Advantages:
Conceptual Simplicity– relational model is simpler than both of those
two model.
Structural Independence – changes in structure do not affects the data
access.
Design Implementation – it achieves both data independence and
structural independence.
Ad hoc query capability – it is powerful, flexible and easy to use
capability.
Security – security control & authorization implemented easily by
moving sensitive attributes in given table into separate relation.
Advisor Table
Name Major GPA Advisor
Advisor Phone Address
Student Table
19.
Disadvantages:
Hardware overheads– it hide the implementation
complexities and physical data storage details from user,
which needs more powerful hardware computers and data
storage devices.
Cost – it is expensive of setting up and maintaining the
database system, which requires special software to set up a
relational database.
Ease of design can lead to bad design – ease of design and
use can lead to development and implementation of very
poorly designed database management system.
20.
Comparison of DatabaseModels
Hierarchical Data
Model
Network Data Model Relational Data Model
Tree structure (i.e.)
hierarchy of parent –
child relationships
Association between
two records
Records in form of
table and relationships
among tables are set
using common fields.
One-to-many
relationship (i.e.) parent
record may have more
than one child.
Many-to-many
relationship (i.e.) each
child can have more
than one parent record.
One-to-one, One-to-
many & Many-to-many
relationship
implemented in
relational database
model.
Changing the structure
leads to change in
application too. (i.e.)
lack of independence
This model is better
than hierarchical model
in case of data
independence.
Model is based on
relations, not on
structures, there is high
degree of data
independence.
21.
Comparison of DatabaseModels
Hierarchical Data
Model
Network Data
Model
Relational Data
Model
Simple, straight
forward method of
implementing record
relationships.
Record relationship
implementation is
very complex due to
use of pointers.
Record relationship is
very easy through use
of a key or composite
key field(s).
Complex in nature. More complex than
hierarchical &
relational data model.
Simple in nature
because data is
simply represented in
tabular format.
This model is used
when there is some
hierarchical character
in the database.
It is useful for
representing records
which have many-to-
many relationships.
It is useful for
representing real
world objects and
relationships among
them.
22.
Comparison of DatabaseModels
Hierarchical
Data Model
Network Data
Model
Relational Data
Model
Searching for a
record is very
difficult since one
can retrieve child
record only after
going through its
parent record.
Searching a record
is easy since there
are multiple access
paths to a data
element.
Unique indexed
key field is used to
search for a data
element.
Little difficult to
insert, delete and
update records.
Very difficult to
insert, delete and
update records.
Insertion, deletion
and updation are
very easy.
23.
DATABASE MANAGEMENT SYSTEM(DBMS)
Database:
“ A collection of integrated data items that can be retrieved
for various applications.”
It is a collection of related files.
Database Management System (DBMS) - Definition:
“A DBMS is a collection of interrelated data & set of programs
to store, modify & extract information, assess those data.”
DBMS is a software system used to manage database and the
various operations like insertion, deletion, updation and retrieval.
It enables users to store, modify and extract information from a
database as per the requirements.”
The primary goal of DBMS is to provide a way to store and
retrieve database information which is convenient & efficient.
23
24.
DBMS allows usersthe following tasks -
Data Definition: It is used for creation, modification, and
removal of definition that defines the organization of data in
the database.
Data Updation: It is used for the insertion, modification,
and deletion of the actual data in the database.
Data Retrieval: It is used to retrieve the data from the
database which can be used by applications for various
purposes.
User Administration: It is used for registering and
monitoring users, maintain data integrity, enforcing data
security, dealing with concurrency control, monitoring
performance and recovering information corrupted by
unexpected failure.
24
25.
Characteristics of DBMS:
Ituses a digital repository established on a server to store
and manage the information.
It can provide a clear and logical view of the process that
manipulates data.
DBMS contains automatic backup and recovery
procedures.
It contains ACID properties which maintain data in a
healthy state in case of failure.
It can reduce the complex relationship between data.
It is used to support manipulation and processing of data.
It is used to provide security of data.
It can view the database from different viewpoints
according to the requirements of the user. 25
26.
Functions:
It storesdata in consistent way.
It used to organize data, access, updates records.
Adding & deleting, data security.
Activities involved in DBMS:
1. DB design & development.
2. Data storage & update.
3. Data retrieval.
4. DB Security.
5. Data protection.
26
27.
File Management System:
File Management System handles how to read and
write data to the hard disk.
OS such as Linux and Windows provide file
systems and it stores data to hard disk and storing
and retrieving data occurs through this file
management system.
It is a method of organizing the files with a hard
disk or other mediums of storage.
It arranges the files and helps in retrieving the files,
when required.
It is more suitable for a small organization to deal
with the small number of clients. 27
28.
Difference between FileSystem and DBMS
Criteria File Management
System
DBMS
System Used to manage and
organise the files
stored in hard disk of
computer
A software to store and
retrieve the user’s data
Data Redundancy Redundant data is
present
No presence of redundant
data
Query Query processing is
not so efficient
Query processing is
efficient
Consistency Data Consistency is
low
Data Consistency is high
Data Sharing Less complex, doesn’t
support complicated
transactions
More complexity in
managing data, easier to
implement complicated
transactions
29.
Difference between FileSystem and DBMS
File Management
System
DBMS
Security Less Security Supports more
security mechanisms
Cost Less expensive in
comparison to DBMS
Higher cost than the
file system
Backup and Recovery
Process
Does not support
crash recovery
Crash recovery
mechanisms is highly
supported
No. of Users It is suitable for small
organizations or
single users
It is suitable for large
organizations to
support multiple users
30.
Use of DBMS(Applications):
Every organization incorporate to store, S/w develop &
retrieve data.
It manipulate data into various list, tables.
To manage DB for security & control.
(E.g.)
1. Banking – for customer information, accounts, etc.
2. Airlines – for reservation, schedule information.
3. University – for student information, course registration.
4. Finance – storing information about holdings, sales,
purchases.
5. HR – information about employees, salaries, etc.
6. Telecommunication – records of call made, monthly bills.
7. Manufacturing – for supply chain, inventories, etc.
8. Credit card transaction – purchase on credit cards details.
30
31.
Advantages:
1. DB supplymuch information to manager to take decision.
2. DB help in searching & combine data.
3. Data sharing. 4. Minimize duplication of data.
5. Description of data. 6. Easily Maintenance.
7. Reduce time 8. Backup & Recovery
9. Multiple User Interface.
Disadvantages:
1. Design expensive (memory, training, operating cost).
2. Centralization of information.
3. Need specialized people. (User training)
4. Data security & integrity.
5. Complexity of Backup and Recovery.
6. High Impact of a Failure. 31
32.
LET’S GO FORTHINKING
Data Set (Combo)
Item Set
Transaction / Purchasing
Frequent items
WHAT IS DATAWAREHOUSE?
Data Warehouse is an environment, not a product.
Data is often scattered across different database, it need DW to
get complete information.
It is aimed at effective integration of operational databases that
enables strategic use of data.
35.
Introduction:
Data Warehousingintegrates data and information collected
from various sources into one comprehensive database.
(E.g.) Customer information from organization’s point-of-sale
systems, its mailing lists, website and comment cards, etc.
Data Warehouse is a centralized storage system or central
repository for storing, analyzing information and interpreting of
data in order to facilitate better decision making.
A data warehouse is a type of data management system that
facilitates and supports business intelligence (BI) activities,
specifically analysis.
It is primarily designed to facilitate searches and analyses
usually contain large amounts of historical data.
DATA WAREHOUSING - INTRODUCTION
36.
Investment &Insurance Companies – to analyze customer &
market trends and allied data patterns.
Retail Chains – used for marketing and distribution to tract
items, examine pricing policies and analyze buying trends of
customers.
Healthcare – to generate treatment reports, share data with
insurance companies & medical units.
Airline – operation purpose like crew assignment, route
profitability, frequent flyer program promotions, etc.
Banking – to manage resources available on desk effectively.
Public Sector – used for intelligence gathering, to maintain &
analyze tax records, health policy records, etc.
Telecommunication – used for product promotions, sales
decisions and to make distribution decisions.
DATA WAREHOUSE USAGE - EXAMPLES
Definition:
“ A datawarehouse is a single, complete and consistent
store of data obtained from a variety of sources and made available
to end users in a way they can understand and use in a business
context.”
“ A data warehouse is a collection of corporate information
derived directly from operational systems and some external data
sources.”
“A data warehouse is a subject-oriented, integrated, time-
variant and non-volatile collection of data in support of
management’s decision making process”. - William H. Inmon
A data warehouse can be defined as a collection of
organizational data and information extracted from operational
sources and external data sources.
DATA WAREHOUSE - DEFINITION
40.
Data Warehouseworks as a central repository, where
information arrives from one or more data sources.
Data flows into data warehouse from transactional system and
other relational databases.
Data may be structured, semi-structured and unstructured data.
It is processed, transformed and ingested through BI tools, SQL
clients and spreadsheets.
Data warehouse contain multiple databases and data is
organized into tables and columns in each database.
Data stored in various tables described by schema & Query
tools use the schema to determine which data tables to access
and analyze.
Data stored in column describe the data such as integer, data
field, string, etc.
Data warehousing makes data mining possible.
HOW DATA WAREHOUSE WORKS?
41.
1. Subject-Oriented:
It providestopic wise information rather than the overall processes of
a business. (i.e.) sales, inventory, promotion, etc.
2. Integrated:
DW is developed by integrating data from varied source into a
consistent format. It is stored in data warehouse in a consistent
manner in terms of naming, format & coding, which facilitates data
analysis.
3. Non-Volatile:
Data once entered into a data warehouse must remain unchanged &
all data is read only.
4. Time Variant:
Data stored in a data warehouse is documented with an element of
time, either explicitly or implicitly. It is exhibited in primary key with
element of time like day, week, etc.
CHARACTERISTICS OF DATA WAREHOUSE
42.
1. Enterprise DataWarehouse (EDW):
It serves as a key or central database that facilitates
decision support services throughout the enterprise.
It provides access to cross-organizational information,
offers a unified approach to data representation.
2. Operational Data Store (ODS):
It is preferred for routine activities like storing employee
records.
3. Data Mart:
It is a subset of a data warehouse built to maintain a
particular department, region or business unit.
Every department of a business has a central repository or
data mart to store data.
TYPES OF DATA WAREHOUSE
43.
The four componentsof data warehouse are –
1. Load Manager (Front Component):
It performs with all the operations associated with the extraction and
load of data into warehouse.
2. Warehouse Manager:
It performs operations associated with the management of data in the
warehouse.
It performs operations like analysis of data to ensure consistency,
creation of indexes & views, transformation, merging of source data.
3. Query Manager (Backend Component):
It performs all operation related to management of user queries.
4. End-User access tools:
It is categorized into 5 groups like data reporting, query tools,
application development tools, EIS tools, OLAP tools and data mining
tools.
DATA WAREHOUSE – COMPONENTS
44.
ETL is aprocess in Data Warehousing and it stands for
Extract, Transform and Load.
It is a process in which an ETL tool extracts the data from
various data source systems, transforms it in the staging
area, finally loads it into the Data warehouse system.
It is data integration process that combines data from
multiple data sources into a single, consistent data store into
a data warehouse.
This may contains customize the tool to suit the need of the
enterprises.
(E.g.) ETL tool sets for long-term analysis & usage of data
in banking, insurance claims, retail sales history, etc.
ETL PROCESS IN DATA WAREHOUSE
Extraction (E):
Thefirst step is extraction of data, source system’s data is
accessed first and prepared further for processing and extracting
required values.
It is extracted in various formats like relational databases, No
SQL, XML and flat files, etc.
It is important to store extract data in staging area, not directly
into data warehouse as it may cause damage and rollback will be
much difficult.
Transformation (T):
The second step of ETL process is transformation.
A set of rules or functions are applied on extracted data to
convert it into a single standard format.
It includes dimension conversion, aggregation, joining,
derivation and calculations of new values.
ETL PROCESS
47.
Loading (L):
Thethird & final step of ETL process is loading.
Transformed data is finally loaded into data warehouse.
Data is updated by loading into data warehouse frequently,
but regular intervals.
Indexes and constraints previously applied to data needs to
be diabled before loading commences.
The rate and period of loading is depends on requirements
and varies from system to system.
During the loads, the data warehouse has to be offline.
Time period should be identified when loads may be
scheduled without affecting data warehouse users.
It should be consider to divide the whole load process into
smaller chunks and populating a few files at a time.
ETL PROCESS
48.
Data Warehouse applicationscan be categorized as:
Query and reporting tools.
Application Development tools.
Data Mining tools.
OLAP tools.
Some popular data warehouse tools are -
Xplenty.
Amazon Redshift.
Teradata.
Oracle 12c.
Informatica.
IBM Infosphere.
Cloudera.
Panoply.
DATA WAREHOUSE – TOOLS
49.
There are severalbenefits of data warehouse for end users
like –
Improved data consistency, data quality and accuracy.
Better business decisions.
Easier access to enterprise data for end-users.
Better documentation of data.
Historical data analysis.
Reduced computer costs and higher productivity.
Enabling end-users to ask ad-hoc queries or reports without
deterring the performance of operational systems.
Collection or consolidation of related data from various
sources into a place.
BENEFITS OF DATA WAREHOUSE
50.
It allowsbusiness users to quickly access critical data from
some sources.
It provides consistent information on various cross-
functional activities.
It helps to integrate many sources of data to reduce stress
on production system.
It helps to reduce total turnaround time for analysis &
reporting.
It stores a large amount of historical data and helps users
to analyse different time periods.
Restructuring & Integration make it easier for user to use
for reporting & analysis.
ADVANTAGES OF DATA WAREHOUSE
51.
Data Warehousecan be outdated relatively quickly.
Difficult to make changes in data types and ranges,
data source schema, indexes and queries.
Data warehouse seem easy, but actually, it is too
complex for average users.
Sometime warehouse users will develop different
business rules.
Organization need to spend lots of their resources
for training and implementation purpose.
This is not an ideal option for unstructured data.
DISADVANTAGES OF DATA WAREHOUSE
52.
DATA MINING -INTRODUCTION
Meaning:
Data mining is the art and science of using more powerful
algorithms, than traditional query tools such as SQL to extract more
useful information.
Data mining is also termed as “Knowledge Discovery in Databases”,
is the extraction of hidden predictive information from large
databases.
It is a powerful new technology with great potential to help
companies. (E.g.) to focus on the most important information in their
data warehouses.
Data mining is the core of the KDD process, involves inferring of
algorithm that explore the data, develop model and discover
unknown patterns.
The model is used for understanding phenomena from the data,
analysis and prediction.
Data mining is concerned with discovering knowledge.
53.
Definition:
Data mining isthe search of relationships and global
patterns that exist in large databases but are ‘hidden’
among the vast amount of data, such as a relationship
between patient data and their medical diagnosis.
- Marcel Holshemier & Arno Siebes
Data mining is the nontrivial extraction of implicit,
previously unknown, and potentially useful information
from data. - William J Frawley
54.
Characteristics:
Relevant datastored in large DB like data warehouse.
It is like end user & tools to get quick response.
Data mining has client / server architecture.
It use parallel processing of data mining due to large
amount of data.
It easily combined with spread sheets & other end user
software development tool for analyze process.
It get 5 types of information like association, sequence,
classification, cluster, forecasting.
It use to find unexpected, valuable results.
55.
Advantages:
Automated Predictionof Trends and Behaviours.
Automated Discovery of Previously Unknown
patterns.
Databases can be larger in both depth and breadth.
Disadvantages:
Privacy issues.
Security issues.
Misuse of Information / Inaccurate Information.
ADVANTAGES & DISADVANTAGES OF DATA
MINING
56.
APPLICATIONS OF DATAMINING
1. Retail / Marketing:
Identify buying patterns from customers.
Finding associations among customer demographic details.
Market basket analysis.
2. Banking:
Detect patterns of fraudulent credit card use.
Identify ‘loyal’ customers.
Predict customers likely to change their credit card
affiliation.
Determine credit card spending by customer groups.
Find hidden correlations between different financial
indicators.
Identify stock trading rules from historical market data.
57.
APPLICATIONS OF DATAMINING
3. Insurance and Health Care:
Claims analysis (i.e.) which medical procedures are
claimed together.
Predict which customers will buy new policies.
Identify behaviour patterns of risky customers.
Identify fraudulent behaviour.
4. Transportation:
Determine the distribution schedules among outlets.
Analyse loading patterns.
5. Medicine:
Characterize patient behaviour to predict office visits.
Identify successful medical therapies for different illnesses.
58.
DATA MINING VSDATA WAREHOUSING
Data Mining Data Warehousing
Data mining is the process of
determining data patterns.
A data warehouse is a database
system designed for analytics.
Data mining is generally
considered as the process of
extracting useful data from a
large set of data.
Data warehousing is the
process of combining all the
relevant data.
Business entrepreneurs carry
data mining with the help of
engineers.
Data warehousing is entirely
carried out by the engineers.
In data mining, data is analyzed
repeatedly.
In data warehousing, data is
stored periodically.
59.
DATA MINING VSDATA WAREHOUSING
Data Mining Data Warehousing
Data mining uses pattern
recognition techniques to
identify patterns.
Data warehousing is the process of
extracting and storing data that
allow easier reporting.
One of the most amazing data
mining technique is the detection
and identification of the
unwanted errors that occur in the
system.
One of the advantages of the data
warehouse is its ability to update
frequently. That is the reason why
it is ideal for business
entrepreneurs who want up to date
with the latest stuff.
The data mining techniques are
cost-efficient as compared to
other statistical data applications.
The responsibility of the data
warehouse is to simplify every type
of business data.
60.
DATA MINING VSDATA WAREHOUSING
Data Mining Data Warehousing
The data mining techniques are
not 100 percent accurate. It
may lead to serious
consequences in a certain
condition.
In the data warehouse, there is
a high possibility that the data
required for analysis by the
company may not be integrated
into the warehouse. It can
simply lead to loss of data.
Companies can benefit from
this analytical tool by
equipping suitable and
accessible knowledge-based
data.
Data warehouse stores a huge
amount of historical data that
helps users to analyze different
periods and trends to make
future predictions.
61.
INTRODUCTION TO MSACCESS
A database is a tool for collecting and organizing information
and store information about people, products, or anything else.
As list grows bigger, redundancies and inconsistencies begin to
appear in the data and becomes hard to understand.
Once these problems arise, it’s good idea to transfer data to a
database created by DBMS such as Microsoft Access.
Ms Access is a Database Management System which was
launched by Microsoft.
It is a part of the Microsoft Office suite and stores data in its
own format.
It is mainly used to store and manipulate large amount of data.
It helps to analyze large amounts of information and manage
related data more efficiently than Microsoft Excel or other
spreadsheet applications.
62.
USE OF MSACCESS
Use of MS Access:
Add new data to a database, such as a new item in
an inventory.
Edit existing data in the database, such as changing
the current location of an item.
Delete information, perhaps if an item is sold or
discarded.
Organize and view the data in different ways.
Share the data with others via reports, e-mail
messages, an intranet or Internet.
63.
COMPONENTS OF MSACCESS
There are seven major components of MS Access database
and discussed below:
1. Tables:
A table in access is similar to any other tabulated data in
the form of rows and columns.
The appearance of the table may look similar to the one
formed in Excel with column heading and titles.
2. Queries:
Once a table is created and the user or programmer is
looking for a calculated output, then it is called queries.
This may include filtering, calculating, sorting, updating,
etc.
64.
3. Relationships:
Whenmore than one table is added, the relation or
connection between them can be achieved.
The three ways in which the connection between tables can
be determined are –
One to One
One to Many
Many to Many
4. Macros:
The predefined actions which can automate tasks on an
Access report is called macros.
Multiple tasks can be assigned and they will function
whenever the macros option is selected on a report.
65.
5. Forms:
Auser interface for a database application can be
created using forms.
Forms can be divided into two: bound and unbound
forms.
6. Report:
Once all information is entered into the database, it
can be reviewed or analysed using a report.
A report can then be customised or modified as per
the user’s requirement.
7. Module:
This allows a set of pre-defined instructions to be
created by a programmer in the database.
66.
Benefits:
Easy tocreate database within lesser time duration.
Used a very comprehensive programming language which
made it user friendly.
With each revised version, new options and features were
made available to the users for their convenience.
It is easy to install and then easy to understand it’s
working.
Importing data was easy.
Graphical user interface made it easy to use.
Limitations:
Not too many people can use the same database at a single
time. This may affect its speed and efficiency.
The same database was tough to use with different
Operating systems.
Better database systems can be used for confidential data.
67.
CREATE DATABASE INMS ACCESS
To Create a blank database:
Open MS Access
Click Blank Database as shown in below figure
68.
Click BlankDatabase, create a database as shown in
below figure
69.
After clickingcreate, new database with empty table
named Table 1, then open Table 1 in Datasheet view. The
cursor is placed in first empty cell in the Click to Add
column.
70.
Begin typingto add data or you can paste data
from another source.
If you don’t want to enter the data in Table 1, click
Close.
If you made any changes to the table, Access
prompts you to save the changes.
Click Yes to save your changes, click No to discard
them or Click Cancel to leave the table open.
71.
CREATE TABLE INMS ACCESS
To Create a table:
In Access, a table is a database object that use to store data
about particular subject, like employees or products.
All tables are composed of horizontal rows and vertical
columns, with small rectangles called cells in the places
where rows and columns intersect.
In Access, rows and columns are referred to as records and
fields.
72.
ADDING DATA INMS ACCESS
Enter the sample data in the Table 1
Field Name Data Type
EmployeelD AutoNumber
FirstName Short Text
LastName Short Text
Address1 Short Text
Address2 Short Text
City Short Text
State Short Text
Zip Short Text
Phone Short Text
Phone Type Short Text
73.
Click on theName & Caption option in Fields and you will
see the following dialog box.
74.
Now Add somemore fields by clicking on Click to Add as per
sample data by choosing short text for each field name.
75.
Once all fieldsare added, Click the Save icon and enter the
table name for the table.
76.
Create another tableusing the Table Design View with the
following sample data.
Field Name Data Type
Project ID AutoNumber
ProjectName Short Text
ManagingEditor Short Text
Author Short Text
PStatus Short Text
Contracts Attachment
ProjectStart Date/Time
ProjectEnd Date/Time
Budget Currency
ProjectNotes Long Text
FORMS IN MSACCESS
Forms in Access are like display cases in stores that make it
easier to view or get the items that you want.
The two basic types of forms are –
a) Bound Forms:
Bound forms are connected to some underlying data source
such as a table, query, or SQL statement.
Bound forms are what people typically think of when they
think of the purpose of a form.
Forms are to be filled out or used to enter or edit data in a
database.
(E.g.) What users use to enter, view or edit data in a database.
Types of Bound forms are – Single item form, Multiple item
form and Split form.
86.
FORMS IN MSACCESS
b) Unbound Forms:
These forms are not connected to an underlying
record or data source.
Unbound forms could be dialog boxes, switch
boards or navigation forms.
Unbound forms are typically used to navigate or
interact with database at large, as opposed to the
data itself.
Form for theexisting database will be created in Layout view.
Then Save the Form
89.
Create a Formusing Blank Form or Form Wizard.
Then you can add the fields from Add Field List.
90.
Create a Formusing Blank Form or Form Wizard.
Then you can add the fields from Add Field List.
91.
Create a Formusing Blank Form or Form Wizard.
Then you can add the fields from Add Field List.
92.
REPORTS IN MSACCESS
Introduction:
Reports offer a way to view, format and summarize
the information in your Microsoft Access database.
Report can be created based on either tables or
queries.
It provide a pathway from a huge amount of data set
in tables or queries to a nice and brief summary of
data.
Reports give you the ability to present components of
your database in an easy-to-read, printable format.
(E.g.) Creating a report of phone no of all your contacts,
summary report of total sales across different regions
and time periods.
93.
Introduction:
Report canbe created in the Design View or by the
Report Wizard with two types of basic report types
– columnar and tabular.
The columnar report orients field names to the left
and their values to the right as in a columnar form.
The tabular report looks similar to the format of
tables, listing all the field names on top and their
values underneath of field names.
Orientation of a report is dependent on the taste and
needs of a report designer.
94.
Parts of aReport:
MS Access allows the user to create two types of reports –
a) Unbound report – these reports are not bound to any
database or Structured Query Language and don’t represent
any data.
b) Bound report – these reports are associated with a table or
a database and used to present the data of data source in a
simpler and summarized manner.
Application of Report:
Display the summarized result drawn from the information
stored.
Capture and archive the snapshots of information.
It can be used to provide details of a particular record in the
data.
It allows the user to create labels.
95.
Creating Reports:
To createa report in MS Access, the following steps are –
Step 1: Choose a record source:
The record source of report can be a table or named
query.
The record source must contain all rows and columns
of data that want to display on report.
If data is from existing table or query, select table or
query in Navigation pane and then choose report tool.
If record sources does not yet exist, then use Blank
report tool or create table or query that contains
required data, select query or table in Navigation Pane
and then choose report tool.
96.
Step 2: Choosea report tool:
The report tools are located on the Create tab of the
ribbon in Reports group.
Tool Description
Report Creates a simple, tabular report containing all of the
fields in the record source you selected in the
Navigation pane.
Report
Design
Opens a blank report in Design view, to which you can
add the required fields and controls.
Blank
Report
Opens a blank report in Layout view and displays the
Field List from where you can add fields to the report.
Report
Wizard
Displays a multiple step wizard than lets you specify
fields, grouping / sorting levels and layout options
Labels Displays a wizard that lets you select standard or
custom label sizes, fields you want to display.
97.
Step 3: Createthe report:
Click the button for the tool you want to use. If a
wizard appears, follow the steps in the wizard and click
Finish on the last page. Access displays the report in
Layout view.
Format the report to achieve the looks that you want:
Resize fields and labels by selecting them and then
dragging the edges until they are the size you want.
Move a field by selecting it and then dragging it to the
new location.
Right click a field and use the commands on shortcut
menu to merge or split cells, delete or select fields and
perform other formatting tasks.
98.
(E.g.)
• Open tableor query you want to use in your report.
• Select Create tab on Ribbon and locate Reports group.
• Click the report command.
99.
(E.g.)
• MS Accesswill create a new report based on the data in the
table.
100.
Preview and PrintReports:
To preview a report
Right Click the report in Navigation pane and Click
print preview and use the commands on Print Preview.
Print the report
Adjust page size or layout
Zoom in or out, or view multiple pages at a time
Refresh the data on report
Export the report to another file format
Click Close print preview.
To print a report
Right click the report in Navigation pane and click
Print.
Select Print from File tab, select additional printing
options.