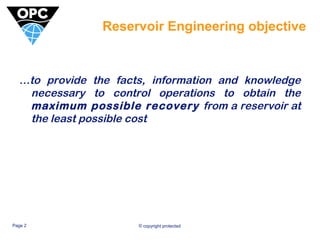
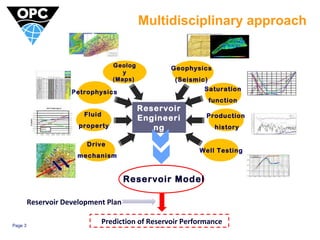
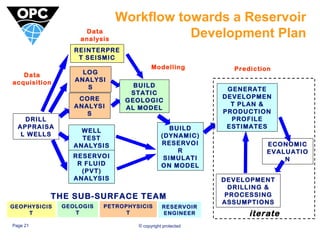
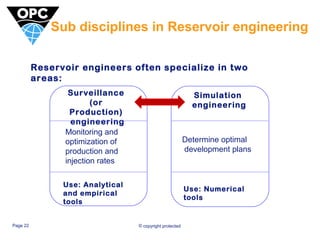
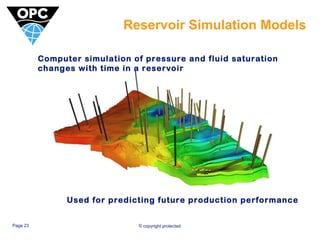
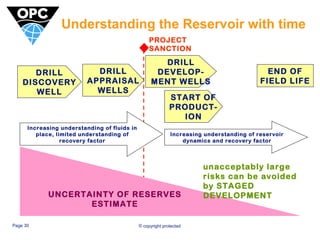
Page 1 
Introduction to Reservoir 
Engineering 
Hernan de Caso 
November 2014
Reservoir Engineering objective 
…to provide the facts, information and knowledge 
necessary to control operations to obtain the 
maximum possible recovery from a reservoir at 
the least possible cost 
Page 2 © copyright protected
Page 3 
Multidisciplinary approach 
Petrophysics Saturation 
Reservoir 
Engineeri 
ng 
Geolog 
y 
(Maps) 
Geophysics 
(Seismic) 
Fluid 
property 
function 
Production 
history 
Well Testing 
Drive 
mechanism 
Reservoir Model 
Reservoir Development Plan 
Prediction of Reservoir Performance
The Reservoir 
Seismic View 
Page 4 © copyright protected 
Simplified View
Information from wells drilled through the 
Page 5 © copyright protected 
reservoir 
LOGS: 
-porosity 
-lithology (what type of 
rocks) 
-oil, gas and water 
saturations 
-pressure 
CORE: 
-porosity and permeability 
-Lithology 
-calibrate log analysis 
WELL TEST: 
-permeability 
-productivity 
-fluid samples for analysis 
Well/Multi-well Analysis
Logging a Well 
Page 6 © copyright protected
Well Test – Flaring in the Desert 
Page 7 © copyright protected
Well Test – Flaring offshore 
Page 8 © copyright protected
Reservoir Characterisation 
TYPES OF RESERVOIR FLUID: 
-Oil 
-Oil with gas cap 
-Gas 
-Gas condensate 
WHERE THE FLUID RESIDES: 
-within the rock pores 
-within fractures in the rock 
Page 9 © copyright protected
How fluids flow through reservoir rock 
Page 10 © copyright protected 
pore space 
FLUID FLOW IS PROPORTIONAL TO: 
 PRESSURE DIFFERENCE 
 PERMEABILITY of the rock to the fluid 
and INVERSELY PROPORTIONAL TO: 
 Fluid VISCOSITY 
- this is DARCY’S LAW 
“Qoil = K A DeltaP / Mu L” 
oil, gas and water all potentially compete for a share 
of the flow 
High 
pressur 
e 
Low 
pressur 
e 
Flow direction
Understanding Pressure 
Pressures in rocks generally follow the normal 
hydrostatic gradient with depth 
Sea-level 14.7 psi atmospheric 
pressure 
1000 ft 450 psi deep dive 
record 
13,000 ft 5500 psi wreck of 
Titanic 
But pressures in some deep reservoirs can exceed 
15,000 psi due to their burial history 
Page 11 © copyright protected
The effect of pressure on oil & gas 
Original 
reservoi 
r 
pressur 
e 
dropping pressure 
reservoir 
pressure drops 
below BUBBLE 
POINT 
Page 12 © copyright protected 
Atmospheri 
c pressure 
or 
STOCKTAN 
K 
conditions 
OIL 
GAS 
reservoir 
pressure 
falls to 
BUBBLE 
POINT
The effect of pressure on gas 
GAS 
dropping pressure 
Page 13 © copyright protected 
condensate 
Original 
reservoi 
r 
pressur 
e 
reservoir 
pressure 
drops below 
DEW POINT 
Atmospheri 
c pressure 
or 
STOCKTAN 
K 
conditions 
OIL 
condensate
Understanding Permeability 
 Absolute permeability is a property of the reservoir 
rock 
 Permeability a measure of the ability of fluids to flow 
through the pore spaces in the rock. 
 The permeability of a rock to a fluid is reduced when 
other fluids are also present in the pore-space. This 
is called relative permeability. 
 When oil is displaced by water a residual oil 
saturation is left behind (typically 20-35% ) 
Page 14 © copyright protected
Original filling of oil reservoir 
Water-filled pores 
by gravity over geological time 
Page 15 © copyright protected 
Pores filled 
with oil and 
residual water 
rock water oil gas 
Pressure drop
Pressure depletion in oil reservoir 
Oil & dissolved 
gas initially 
produced 
Dropping pressure 
causes gas to break out 
of solution in the 
reservoir. Gas moves to 
wells faster. Proportion 
of gas produced 
increases. Reservoir 
depletes leaving 
significant oil behind. 
Pressure drop Pressure drop 
Page 16 © copyright protected
Water-oil Displacement in oil reservoir 
Injected water 
prevents 
pressure falling 
Pressure drop Pressure drop 
Page 17 © copyright protected 
Gas stays in 
solution, oil 
saturation reduced 
to residual, % of 
water produced 
increases
Ways of recovering oil and gas from 
PRIMARY 
RECOVERY 
By: PRESSURE 
DEPLETION 
Development wells are 
all producers 
Page 18 © copyright protected 
the reservoir 
Normal for 
GAS but poor 
for OIL (5- 
12% 
recovery) 
SECONDARY 
RECOVERY 
By: FLUID 
DISPLACEMENT 
Some development wells 
inject water or gas into the 
reservoir 
Good for OIL 
(30-40% 
recovery) 
TERTIARY 
RECOVERY 
(Enhanced 
Recovery) 
By: DISPLACEMENT 
USING SPECIAL 
FLUIDS 
injection of surfactants, 
carbon dioxide or steam 
Improves OIL 
recovery but 
expensive to 
carry out
Oil Recovery 
Page 19 © copyright protected
Why do we need a 
Reservoir Development Plan? 
 To generate number of wells, recoverable 
reserves values and production profiles for 
economic analysis of the development 
project 
 To satisfy government regulatory bodies (and 
licence partners) that the field will be 
developed efficiently 
Page 20 © copyright protected
Workflow towards a Reservoir 
THE SUB-SURFACE TEAM 
Page 21 © copyright protected 
Development Plan 
LOG 
ANALYSI 
S 
CORE 
ANALYSI 
S 
WELL 
TEST 
ANALYSIS 
RESERVOI 
R FLUID 
(PVT) 
ANALYSIS 
BUILD 
STATIC 
GEOLOGIC 
AL MODEL 
BUILD 
(DYNAMIC) 
RESERVOI 
R 
SIMULATI 
ON MODEL 
DRILL 
APPRAISA 
L WELLS 
GENERATE 
DEVELOPMEN 
T PLAN & 
PRODUCTION 
PROFILE 
ESTIMATES 
ECONOMIC 
EVALUATIO 
DEVELOPMENT 
DRILLING & 
PROCESSING 
ASSUMPTIONS 
N 
REINTERPRE 
T SEISMIC 
iterate 
GEOPHYSICIS 
T 
GEOLOGIS 
T 
PETROPHYSICIS 
T 
RESERVOIR 
ENGINEER 
Data 
acquisition 
Data 
analysis 
Modelling Prediction
Sub disciplines in Reservoir engineering 
Reservoir engineers often specialize in two 
areas: 
Surveillance 
(or 
Production) 
engineering 
Page 22 © copyright protected 
Simulation 
engineering 
Monitoring and 
optimization of 
production and 
injection rates 
Use: Analytical 
and empirical 
tools 
Determine optimal 
development plans 
Use: Numerical 
tools
Reservoir Simulation Models 
Computer simulation of pressure and fluid saturation 
changes with time in a reservoir 
Used for predicting future production performance 
Page 23 © copyright protected
Reservoir models are simplifications 
Page 24 © copyright protected 
each cell may be 
hundreds of feet 
long
Uncertainty 
Kensington Gardens River Thames 
Well 1 Well 2 
Page 25 © copyright protected
Uncertainty 
Kensington Gardens River Thames 
Well 1 Well 2 
Kensington Gardens River Thames 
Page 26 © copyright protected
Uncertainty 
Kensington Gardens River Thames 
Well 1 Well 2 
Kensington Gardens River Thames 
Page 27 © copyright protected
Uncertainty 
Kensington Gardens River Thames 
Well 1 Well 2 
Kensington Gardens River Thames 
Page 28 © copyright protected
Uncertainty 
Kensington Gardens River Thames 
Well 1 Well 2 
Kensington Gardens River Thames 
Page 29 © copyright protected
Understanding the Reservoir with time 
DRILL 
DISCOVERY 
WELL 
DRILL 
APPRAISAL 
WELLS 
PROJECT 
SANCTION 
DRILL 
DEVELOP-MENT 
WELLS 
START OF 
PRODUCT-ION 
Increasing understanding of fluids in 
place, limited understanding of 
recovery factor 
Page 30 © copyright protected 
END OF 
FIELD LIFE 
UNCERTAINTY OF RESERVES 
ESTIMATE 
Increasing understanding of reservoir 
dynamics and recovery factor 
unacceptably large 
risks can be avoided 
by STAGED 
DEVELOPMENT
Page 31 
Introduction to Reservoir 
Engineering 
Thank You 
opc.co.uk 
London, Aberdeen UK | Doha Qatar | Houston USA | Atyrau, Astana Kazakhstan | Stavanger Norway | Basra Iraq | Muscat Oman | Abu Dhabi UAE

Introduction to Reservoir Engineering

  • 1.
    Page 1 Introductionto Reservoir Engineering Hernan de Caso November 2014
  • 2.
    Reservoir Engineering objective …to provide the facts, information and knowledge necessary to control operations to obtain the maximum possible recovery from a reservoir at the least possible cost Page 2 © copyright protected
  • 3.
    Page 3 Multidisciplinaryapproach Petrophysics Saturation Reservoir Engineeri ng Geolog y (Maps) Geophysics (Seismic) Fluid property function Production history Well Testing Drive mechanism Reservoir Model Reservoir Development Plan Prediction of Reservoir Performance
  • 4.
    The Reservoir SeismicView Page 4 © copyright protected Simplified View
  • 5.
    Information from wellsdrilled through the Page 5 © copyright protected reservoir LOGS: -porosity -lithology (what type of rocks) -oil, gas and water saturations -pressure CORE: -porosity and permeability -Lithology -calibrate log analysis WELL TEST: -permeability -productivity -fluid samples for analysis Well/Multi-well Analysis
  • 6.
    Logging a Well Page 6 © copyright protected
  • 7.
    Well Test –Flaring in the Desert Page 7 © copyright protected
  • 8.
    Well Test –Flaring offshore Page 8 © copyright protected
  • 9.
    Reservoir Characterisation TYPESOF RESERVOIR FLUID: -Oil -Oil with gas cap -Gas -Gas condensate WHERE THE FLUID RESIDES: -within the rock pores -within fractures in the rock Page 9 © copyright protected
  • 10.
    How fluids flowthrough reservoir rock Page 10 © copyright protected pore space FLUID FLOW IS PROPORTIONAL TO:  PRESSURE DIFFERENCE  PERMEABILITY of the rock to the fluid and INVERSELY PROPORTIONAL TO:  Fluid VISCOSITY - this is DARCY’S LAW “Qoil = K A DeltaP / Mu L” oil, gas and water all potentially compete for a share of the flow High pressur e Low pressur e Flow direction
  • 11.
    Understanding Pressure Pressuresin rocks generally follow the normal hydrostatic gradient with depth Sea-level 14.7 psi atmospheric pressure 1000 ft 450 psi deep dive record 13,000 ft 5500 psi wreck of Titanic But pressures in some deep reservoirs can exceed 15,000 psi due to their burial history Page 11 © copyright protected
  • 12.
    The effect ofpressure on oil & gas Original reservoi r pressur e dropping pressure reservoir pressure drops below BUBBLE POINT Page 12 © copyright protected Atmospheri c pressure or STOCKTAN K conditions OIL GAS reservoir pressure falls to BUBBLE POINT
  • 13.
    The effect ofpressure on gas GAS dropping pressure Page 13 © copyright protected condensate Original reservoi r pressur e reservoir pressure drops below DEW POINT Atmospheri c pressure or STOCKTAN K conditions OIL condensate
  • 14.
    Understanding Permeability Absolute permeability is a property of the reservoir rock  Permeability a measure of the ability of fluids to flow through the pore spaces in the rock.  The permeability of a rock to a fluid is reduced when other fluids are also present in the pore-space. This is called relative permeability.  When oil is displaced by water a residual oil saturation is left behind (typically 20-35% ) Page 14 © copyright protected
  • 15.
    Original filling ofoil reservoir Water-filled pores by gravity over geological time Page 15 © copyright protected Pores filled with oil and residual water rock water oil gas Pressure drop
  • 16.
    Pressure depletion inoil reservoir Oil & dissolved gas initially produced Dropping pressure causes gas to break out of solution in the reservoir. Gas moves to wells faster. Proportion of gas produced increases. Reservoir depletes leaving significant oil behind. Pressure drop Pressure drop Page 16 © copyright protected
  • 17.
    Water-oil Displacement inoil reservoir Injected water prevents pressure falling Pressure drop Pressure drop Page 17 © copyright protected Gas stays in solution, oil saturation reduced to residual, % of water produced increases
  • 18.
    Ways of recoveringoil and gas from PRIMARY RECOVERY By: PRESSURE DEPLETION Development wells are all producers Page 18 © copyright protected the reservoir Normal for GAS but poor for OIL (5- 12% recovery) SECONDARY RECOVERY By: FLUID DISPLACEMENT Some development wells inject water or gas into the reservoir Good for OIL (30-40% recovery) TERTIARY RECOVERY (Enhanced Recovery) By: DISPLACEMENT USING SPECIAL FLUIDS injection of surfactants, carbon dioxide or steam Improves OIL recovery but expensive to carry out
  • 19.
    Oil Recovery Page19 © copyright protected
  • 20.
    Why do weneed a Reservoir Development Plan?  To generate number of wells, recoverable reserves values and production profiles for economic analysis of the development project  To satisfy government regulatory bodies (and licence partners) that the field will be developed efficiently Page 20 © copyright protected
  • 21.
    Workflow towards aReservoir THE SUB-SURFACE TEAM Page 21 © copyright protected Development Plan LOG ANALYSI S CORE ANALYSI S WELL TEST ANALYSIS RESERVOI R FLUID (PVT) ANALYSIS BUILD STATIC GEOLOGIC AL MODEL BUILD (DYNAMIC) RESERVOI R SIMULATI ON MODEL DRILL APPRAISA L WELLS GENERATE DEVELOPMEN T PLAN & PRODUCTION PROFILE ESTIMATES ECONOMIC EVALUATIO DEVELOPMENT DRILLING & PROCESSING ASSUMPTIONS N REINTERPRE T SEISMIC iterate GEOPHYSICIS T GEOLOGIS T PETROPHYSICIS T RESERVOIR ENGINEER Data acquisition Data analysis Modelling Prediction
  • 22.
    Sub disciplines inReservoir engineering Reservoir engineers often specialize in two areas: Surveillance (or Production) engineering Page 22 © copyright protected Simulation engineering Monitoring and optimization of production and injection rates Use: Analytical and empirical tools Determine optimal development plans Use: Numerical tools
  • 23.
    Reservoir Simulation Models Computer simulation of pressure and fluid saturation changes with time in a reservoir Used for predicting future production performance Page 23 © copyright protected
  • 24.
    Reservoir models aresimplifications Page 24 © copyright protected each cell may be hundreds of feet long
  • 25.
    Uncertainty Kensington GardensRiver Thames Well 1 Well 2 Page 25 © copyright protected
  • 26.
    Uncertainty Kensington GardensRiver Thames Well 1 Well 2 Kensington Gardens River Thames Page 26 © copyright protected
  • 27.
    Uncertainty Kensington GardensRiver Thames Well 1 Well 2 Kensington Gardens River Thames Page 27 © copyright protected
  • 28.
    Uncertainty Kensington GardensRiver Thames Well 1 Well 2 Kensington Gardens River Thames Page 28 © copyright protected
  • 29.
    Uncertainty Kensington GardensRiver Thames Well 1 Well 2 Kensington Gardens River Thames Page 29 © copyright protected
  • 30.
    Understanding the Reservoirwith time DRILL DISCOVERY WELL DRILL APPRAISAL WELLS PROJECT SANCTION DRILL DEVELOP-MENT WELLS START OF PRODUCT-ION Increasing understanding of fluids in place, limited understanding of recovery factor Page 30 © copyright protected END OF FIELD LIFE UNCERTAINTY OF RESERVES ESTIMATE Increasing understanding of reservoir dynamics and recovery factor unacceptably large risks can be avoided by STAGED DEVELOPMENT
  • 31.
    Page 31 Introductionto Reservoir Engineering Thank You opc.co.uk London, Aberdeen UK | Doha Qatar | Houston USA | Atyrau, Astana Kazakhstan | Stavanger Norway | Basra Iraq | Muscat Oman | Abu Dhabi UAE

Editor's Notes

  • #6 RE’s use data from a range of sources Petrophysics – electric log interpretations Core data recovered from the reservoir Well tests – flow the well into a separator and flare it while measuring the bottomhole pressure (at the bottom of the well)
  • #7 Measurement of the properties of the rocks.
  • #8 When we do a well test on an exploration or appraisal well, we need to flare the gas/oil since we have no pipeline or tanker export route.
  • #10 Discuss the range of fluids from dry gas to essentially coal, and various shades in between. Oils are various colours – Miller East example Should we show a slide of oil sample colours?
  • #11 Darcy equation – liked to most of our equations Based on experiemnts in the Paris sewers! No really Jane Austen!
  • #12 Psi – pounds per square inch Most reservoirs pressures are at hydrostatic pressure This essentially a column of seawater from the surface of the sea to the hydrocarbon – water contact in the reservoir. There are reservoirs which we can HPHT – high pressure-high temperature. These have pressure and/or temperatures which exceed most reservoirs. Usually the reservoir rock, supports the weight of the overburden rock above it, however in some circumstances the reservoir rock compresses due to the ovverburden and the reservoir fluid has to support some of the weight.
  • #13 As an oil reservoir depletes in pressure, gas will come out of solution (like opening a can of coca cola) and bubble out of the oil. It will be a bit more lively than coca cola though. Bubble Point is the pressure at which the first bubble of gas comes out of the liquid oil. As gas bubbles out of the oil, it will shrink – or reduce in volume. A bit like boiling a kettle dry. Then once all of the gas has bubbled out, which is what we do in a separation system on an oil platform using separators (pressurised tanks), we are left with what we call Stock Tank Oil.
  • #14 For gas, it is kind of the opposite way round. Dew Point is defined as the pressure at which the first droplet of oil condenses out of the gas. This is similar to how water vapour condenses on a mirror in the bathroom. As the pressure drop more, then so a larger volume of condensate comes out of the gas.
  • #15 Permeability is measured in samples of core recovered from the well by blowing gas through it. Permeability can be calculated by measuring pressures in a well test when it is flowed. Initial oil saturation could be 75%, and residual oil saturation 35%, so therefore 47% of the oil would be left behind.
  • #16 Migration of oil into a reservoir over a very long time.
  • #18 Water being pumped into a reservoir to flush out the oil. In the olden days, the pressure was allowed to drop since no water was injected. Gas then came out of solution. Gas travels much quicker than oil in the reservoir – maybe 100 times faster, so after a short time, the wells would gas out. In the olden days nobody was bothered about gas, so it was just either flared, or vented. Recovery factors were low such as 10-15%.
  • #19 Onshore USA, CO2 is frequently used for tertiary recovery. An additional 5 to 15% of reserves can be recovered. Offshore such as in the UK North Sea it is much more expensive to get CO2 offshore. It is not impossible to do, but somebody needs to pay for the pipeline!
  • #21 There is a term FID – Final Investment Decision – at which the decision is made by a company to spend billions of pounds to develop an oil field.
  • #24 GIGO – Garbage in – garbage out A model is only as good as the data that is put into it It will always be an approximation. If you imagine a very large bed sheet over a huge feast on a kitchen table, and a tiny pin prick in the sheet samples an apple. That is what a well measures. How will the driller know what is on the rest of the table?