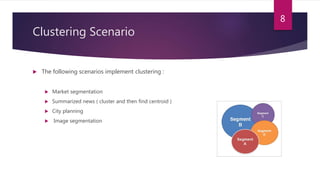
This is very simple introduction to Clustering with some real world example. At the end of lecture I use stackOverflow API to test some clustering. I also wants to try facebook but it has some problem with it's API
2. Objectives
At the end of this presentation you will understand :
Understand data science and it’s application
Get overview of Machine Learning
Learn some type of clustering algorithm
Implementation clustering with R
2
3. Data science and it’s Applications
Extract knowledge or insight from data
From speech-recognition and search engine to health-care and humanities
These scenarios involves :
Storing , organizing and integrating huge amount of unstructured data
Processing and Analyzing data
Extracting Knowledge , insight and predict future from data
Processing , Analyzing , Extracting knowledge and insight done through Machine
Learning
3
5. Machine Learning
Field of study that gives computers the ability to learn without being explicitly
programmed
Classified into three broad category :
Supervised Learning
Unsupervised Learning
*Reinforcement Learning
5
7. Cluster definition
Cluster analysis or clustering grouping similar object together ( called cluster)
Type of Clustering
Intra-class similarity
Inter-class similarity
7
8. Clustering Scenario
The following scenarios implement clustering :
Market segmentation
Summarized news ( cluster and then find centroid )
City planning
Image segmentation
8
10. Partitioning method
database of ‘n’ objects and the partitioning method constructs ‘k’ partition of data
which satisfy following :
Each group contains at least one object
Each object must belong to exactly one group
Points to remember
This method create initial partitioning
Use iterative relocation technique to improve partitioning
10
17. Density based Methods
Areas of higher density consider as cluster
Sparse areas usually consider as noise
It use two basic idea
Density reachable
Density connectivity
17
20. DBSCAN (Density-Based Spatial Clustering of Applications with Noise)
Advantage
Does not require a-priori specification of number of clusters.
Able to identify noise data while clustering.
is able to find arbitrarily size and arbitrarily shaped clusters
Disadvantage
Fails in case of neck type of dataset.
Does not work well in case of high dimensional data
20
21. Grid based algorithm
Using multi-resolution grid data structure
Clustering complexity depends on number of grid cell and not objects
Space into finite number cells that form a grid structure on which all of the
operation for clustering is performed
Clique , STING , WaveCluster
21
22. Clique ( CLustering-In-QUEst
Clique is used for clustering high-dimensional data
High dimensional data means have many attrs
Clique identifies the dense unit in subspace
22
Data Science is an interdisciplinary field about processes and systems to extract knowledge or insights from data in various forms, either structured or unstructured,[1][2] which is a continuation of some of the data analysis fields such as statistics, data mining, and predictive analytics, similar toKnowledge Discovery in Databases (KDD).
Data science employs techniques and theories drawn from many fields within the broad areas of mathematics, statistics, chemometrics, information science, and computer science, including signal processing, probability models, machine learning, statistical learning, data mining, database, data engineering, pattern recognition and learning, visualization, predictive analytics, uncertainty modeling, data warehousing, data compression, computer programming, artificial intelligence, and high performance computing. The development of machine learning has enhanced the growth and importance of data science
Data science affects academic and applied research in many domains, including machine translation, speech recognition, robotics, search engines,digital economy, but also the biological sciences, medical informatics, health care, social sciences and the humanities. It heavily influences economics,business and finance. From the business perspective, data science is an integral part of competitive intelligence, a newly emerging field that encompasses a number of activities, such as data mining and data analysis.[3]
Detection of fake book reviews (Amazon) and fake restaurant reviews (Zagat).
A major car company exploring how deep learning can react to audio recordings from the engine to determine if maintenance is necessary, or if parts are nearing the need for replacement.
Outdoor marketing company Route is using big data to define and justify its pricing model for advertising space on billboards, benches and the sides of busses. Traditionally, outdoor media pricing was priced “per impression” based on an estimate of how many eyes would see the ad in a given day. No more! Now they’re using sophisticated GPS, eye-tracking software, and analysis of traffic patterns to have a much more realistic idea of which advertisements will be seen the most — and therefore be the most effective.
Alan Turing : "Can machines think?”
Supervised learning : is the machine learning task of inferring a function from labeled training data. The training data consist of a set of training examples. In supervised learning, each example is a pair consisting of an input object (typically a vector) and a desired output value (also called thesupervisory signal). A supervised learning algorithm analyzes the training data and produces an inferred function, which can be used for mapping new examples.
Unsupervised learning : is the machine learning task of inferring a function to describe hidden structure from unlabeled data. Since the examples given to the learner are unlabeled, there is no error or reward signal to evaluate a potential solution.
Reinforcement learning : A computer program interacts with a dynamic environment in which it must perform a certain goal (such as driving a car), without a teacher explicitly telling it whether it has come close to its goal. Another example is learning to play a game by playing against an opponent
There are also exist other categories which categorized by output , …
Between supervised and unsupervised learning is semi-supervised learning, where the teacher gives an incomplete training signal: a training set with some (often many) of the target outputs missing
Supervised learning is the most common technique for training neural networks and decision trees.
Differences between clustering and classification
In general, in classification you have a set of predefined classes and want to know which class a new object belongs to.
Clustering tries to group a set of objects and find whether there is some relationship between the objects.
Intra calss : dissimilarity
Inter class : similarity
( Find best place to Open Emergency-Care wards )
ClassificationClustering algorithms may be classified as listed below:
Exclusive Clustering
Overlapping Clustering
Hierarchical Clustering
Probabilistic Clustering
some times use models for grouping :
Connectivity models: for example, hierarchical clustering builds models based on distance connectivity.
Centroid models: for example, the k-means algorithm represents each cluster by a single mean vector.
Distribution models: clusters are modeled using statistical distributions, such as multivariate normal distributions used by the Expectation-maximization algorithm.
Density models: for example, DBSCAN and OPTICS defines clusters as connected dense regions in the data space.
Subspace models: in Biclustering (also known as Co-clustering or two-mode-clustering), clusters are modeled with both cluster members and relevant attributes.
Group models: some algorithms do not provide a refined model for their results and just provide the grouping information.
Graph-based models: a clique, that is, a subset of nodes in a graph such that every two nodes in the subset are connected by an edge can be considered as a prototypical form of cluster. Relaxations of the complete connectivity requirement (a fraction of the edges can be missing) are known as quasi-cliques, as in the HCS clustering algorithm.
In recent years considerable effort has been put into improving the performance of existing algorithms. Among them are CLARANS (Ng and Han, 1994), and BIRCH (Zhang et al., 1996).With the recent need to process larger and larger data sets (also known as big data), the willingness to trade semantic meaning of the generated clusters for performance has been increasing. This led to the development of pre-clustering methods such as canopy clustering, which can process huge data sets efficiently, but the resulting "clusters" are merely a rough pre-partitioning of the data set to then analyze the partitions with existing slower methods such as k-means clustering. Various other approaches to clustering have been tried such as seed based clustering.
For high-dimensional data, many of the existing methods fail due to the curse of dimensionality, which renders particular distance functions problematic in high-dimensional spaces. This led to newclustering algorithms for high-dimensional data that focus on subspace clustering (where only some attributes are used, and cluster models include the relevant attributes for the cluster) and correlation clustering that also looks for arbitrary rotated ("correlated") subspace clusters that can be modeled by giving a correlation of their attributes. Examples for such clustering algorithms are CLIQUE and SUBCLU.
Ideas from density-based clustering methods (in particular the DBSCAN/OPTICS family of algorithms) have been adopted to subspace clustering (HiSC, hierarchical subspace clustering and DiSH) and correlation clustering (HiCO, hierarchical correlation clustering, 4C using "correlation connectivity" and ERiC exploring hierarchical density-based correlation clusters).
Several different clustering systems based on mutual information have been proposed. One is Marina Meilă's variation of information metric; another provides hierarchical clustering. Using genetic algorithms, a wide range of different fit-functions can be optimized, including mutual information.[29] Also message passing algorithms, a recent development in Computer Science andStatistical Physics, has led to the creation of new types of clustering algorithms.[30]
Points to remember :
For a given number of partitions (say k), the partitioning method will create an initial partitioning.
Then it uses the iterative relocation technique to improve the partitioning by moving objects from one group to other.K-means clustering can handle larger datasets than hierarchical cluster approaches.
There are two package in R for this kind pam() , k-meanSelects K centroids (K rows chosen at random)
Assigns each data point to its closest centroid
Recalculates the centroids as the average of all data points in a cluster (i.e., the centroids are p-length mean vectors, where p is the number of variables)
Assigns data points to their closest centroids
Continues steps 3 and 4 until the observations are not reassigned or the maximum number of iterations (R uses 10 as a default) is reached.
The MiniBatchKMeans is a variant of the KMeans algorithm which uses mini-batches to reduce the computation time,
Usually for small dataset ( 100 )
In R use hclust to
Agglomerative: This is a "bottom up" approach: each observation starts in its own cluster, and pairs of clusters are merged as one moves up the hierarchy. O(n^3)
Divisive: This is a "top down" approach: all observations start in one cluster, and splits are performed recursively as one moves down the hierarchy. O(2^n)
Single LinkageIn single linkage hierarchical clustering, the distance between two clusters is defined as the shortest distance between two points in each cluster. For example, the distance between clusters “r” and “s” to the left is equal to the length of the arrow between their two closest points.Complete LinkageIn complete linkage hierarchical clustering, the distance between two clusters is defined as the longest distance between two points in each cluster. For example, the distance between clusters “r” and “s” to the left is equal to the length of the arrow between their two furthest points.Average LinkageIn average linkage hierarchical clustering, the distance between two clusters is defined as the average distance between each point in one cluster to every point in the other cluster. For example, the distance between clusters “r” and “s” to the left is equal to the average length each arrow between connecting the points of one cluster to the other.
The idea is that if a particular point belongs to a cluster, it should be near to lots of other points in that cluster.
It works like this: First we choose two parameters, a positive number epsilon and a natural number minPoints. We then begin by picking an arbitrary point in our dataset. If there are more than minPoints points within a distance of epsilon from that point, (including the original point itself), we consider all of them to be part of a "cluster". We then expand that cluster by checking all of the new points and seeing if they too have more than minPoints points within a distance of epsilon, growing the cluster recursively if so.
Eventually, we run out of points to add to the cluster. We then pick a new arbitrary point and repeat the process. Now, it's entirely possible that a point we pick has fewer than minPoints points in its epsilon ball, and is also not a part of any other cluster. If that is the case, it's considered a "noise point" not belonging to any cluster.
Advantage : reconginze noise
Disadvanatage : cannot recongize cluster which are not dense ( OPTIC )