Downloaded 602 times


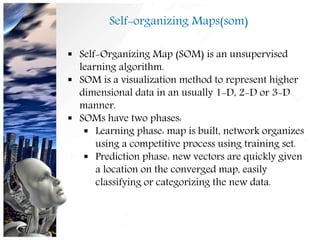


This document discusses unsupervised learning approaches including clustering, blind signal separation, and self-organizing maps (SOM). Clustering groups unlabeled data points together based on similarities. Blind signal separation separates mixed signals into their underlying source signals without information about the mixing process. SOM is an algorithm that maps higher-dimensional data onto lower-dimensional displays to visualize relationships in the data.