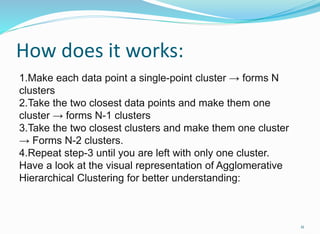
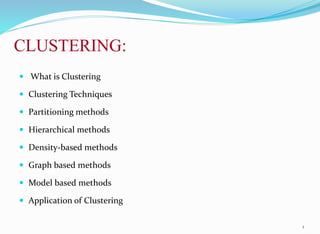
Clustering is an unsupervised machine learning technique that groups similar objects together. There are several clustering techniques including partitioning methods like k-means, hierarchical methods like agglomerative and divisive clustering, density-based methods, graph-based methods, and model-based clustering. Clustering is used in applications such as pattern recognition, image processing, bioinformatics, and more to split data into meaningful subgroups.


![4
Clustering
Techniques
Partitioning
methods
Hierarchical
methods
Density-based
methods
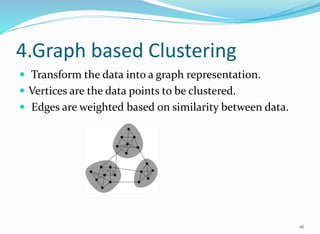
Graph based
methods
Model based
clustering
• k-Means algorithm [1957, 1967]
• k-Medoids algorithm
• k-Modes [1998]
• Fuzzy c-means algorithm [1999]
Divisive
Agglomerative
methods
• STING [1997]
• DBSCAN [1996]
• CLIQUE [1998]
• DENCLUE [1998]
• OPTICS [1999]
• Wave Cluster [1998]
• MST Clustering [1999]
• OPOSSUM [2000]
• SNN Similarity Clustering [2001, 2003]
• EM Algorithm [1977]
• Auto class [1996]
• COBWEB [1987]
• ANN Clustering [1982, 1989]
• AGNES [1990]
• BIRCH [1996]
• CURE [1998]
• ROCK [1999]
• Chamelon [1999]
• DIANA [1990]
• PAM [1990]
• CLARA [1990]
• CLARANS [1994]
hniques:](https://image.slidesharecdn.com/clusteringppt-230414075031-c4b2845a/85/clustering-ppt-pptx-4-320.jpg)