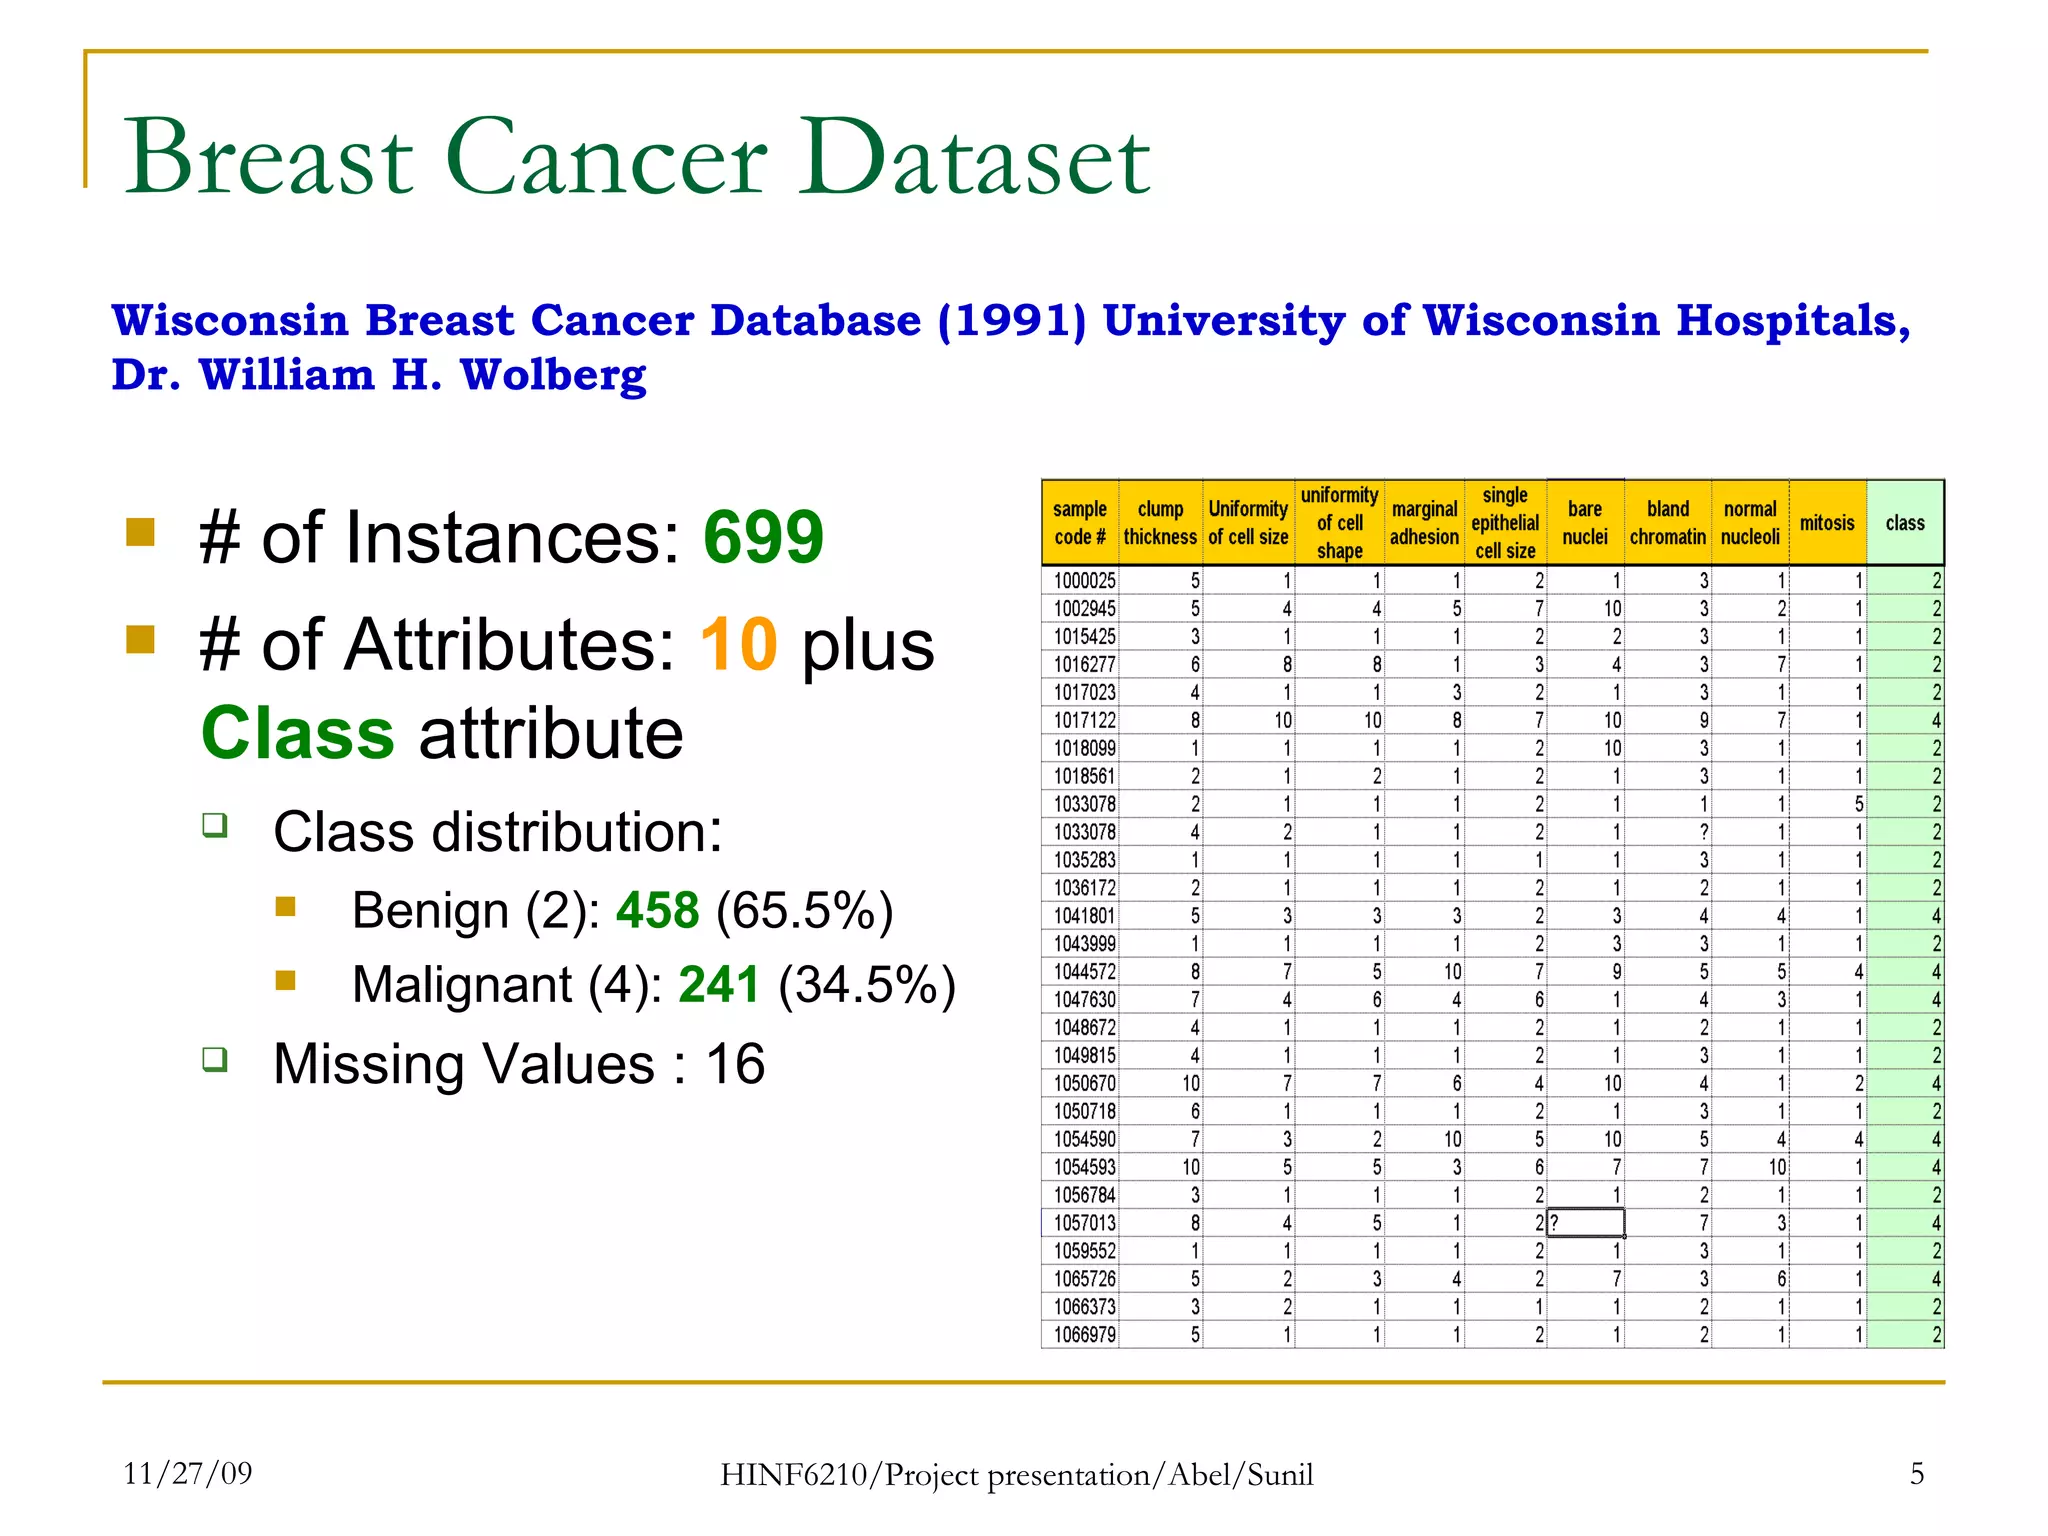
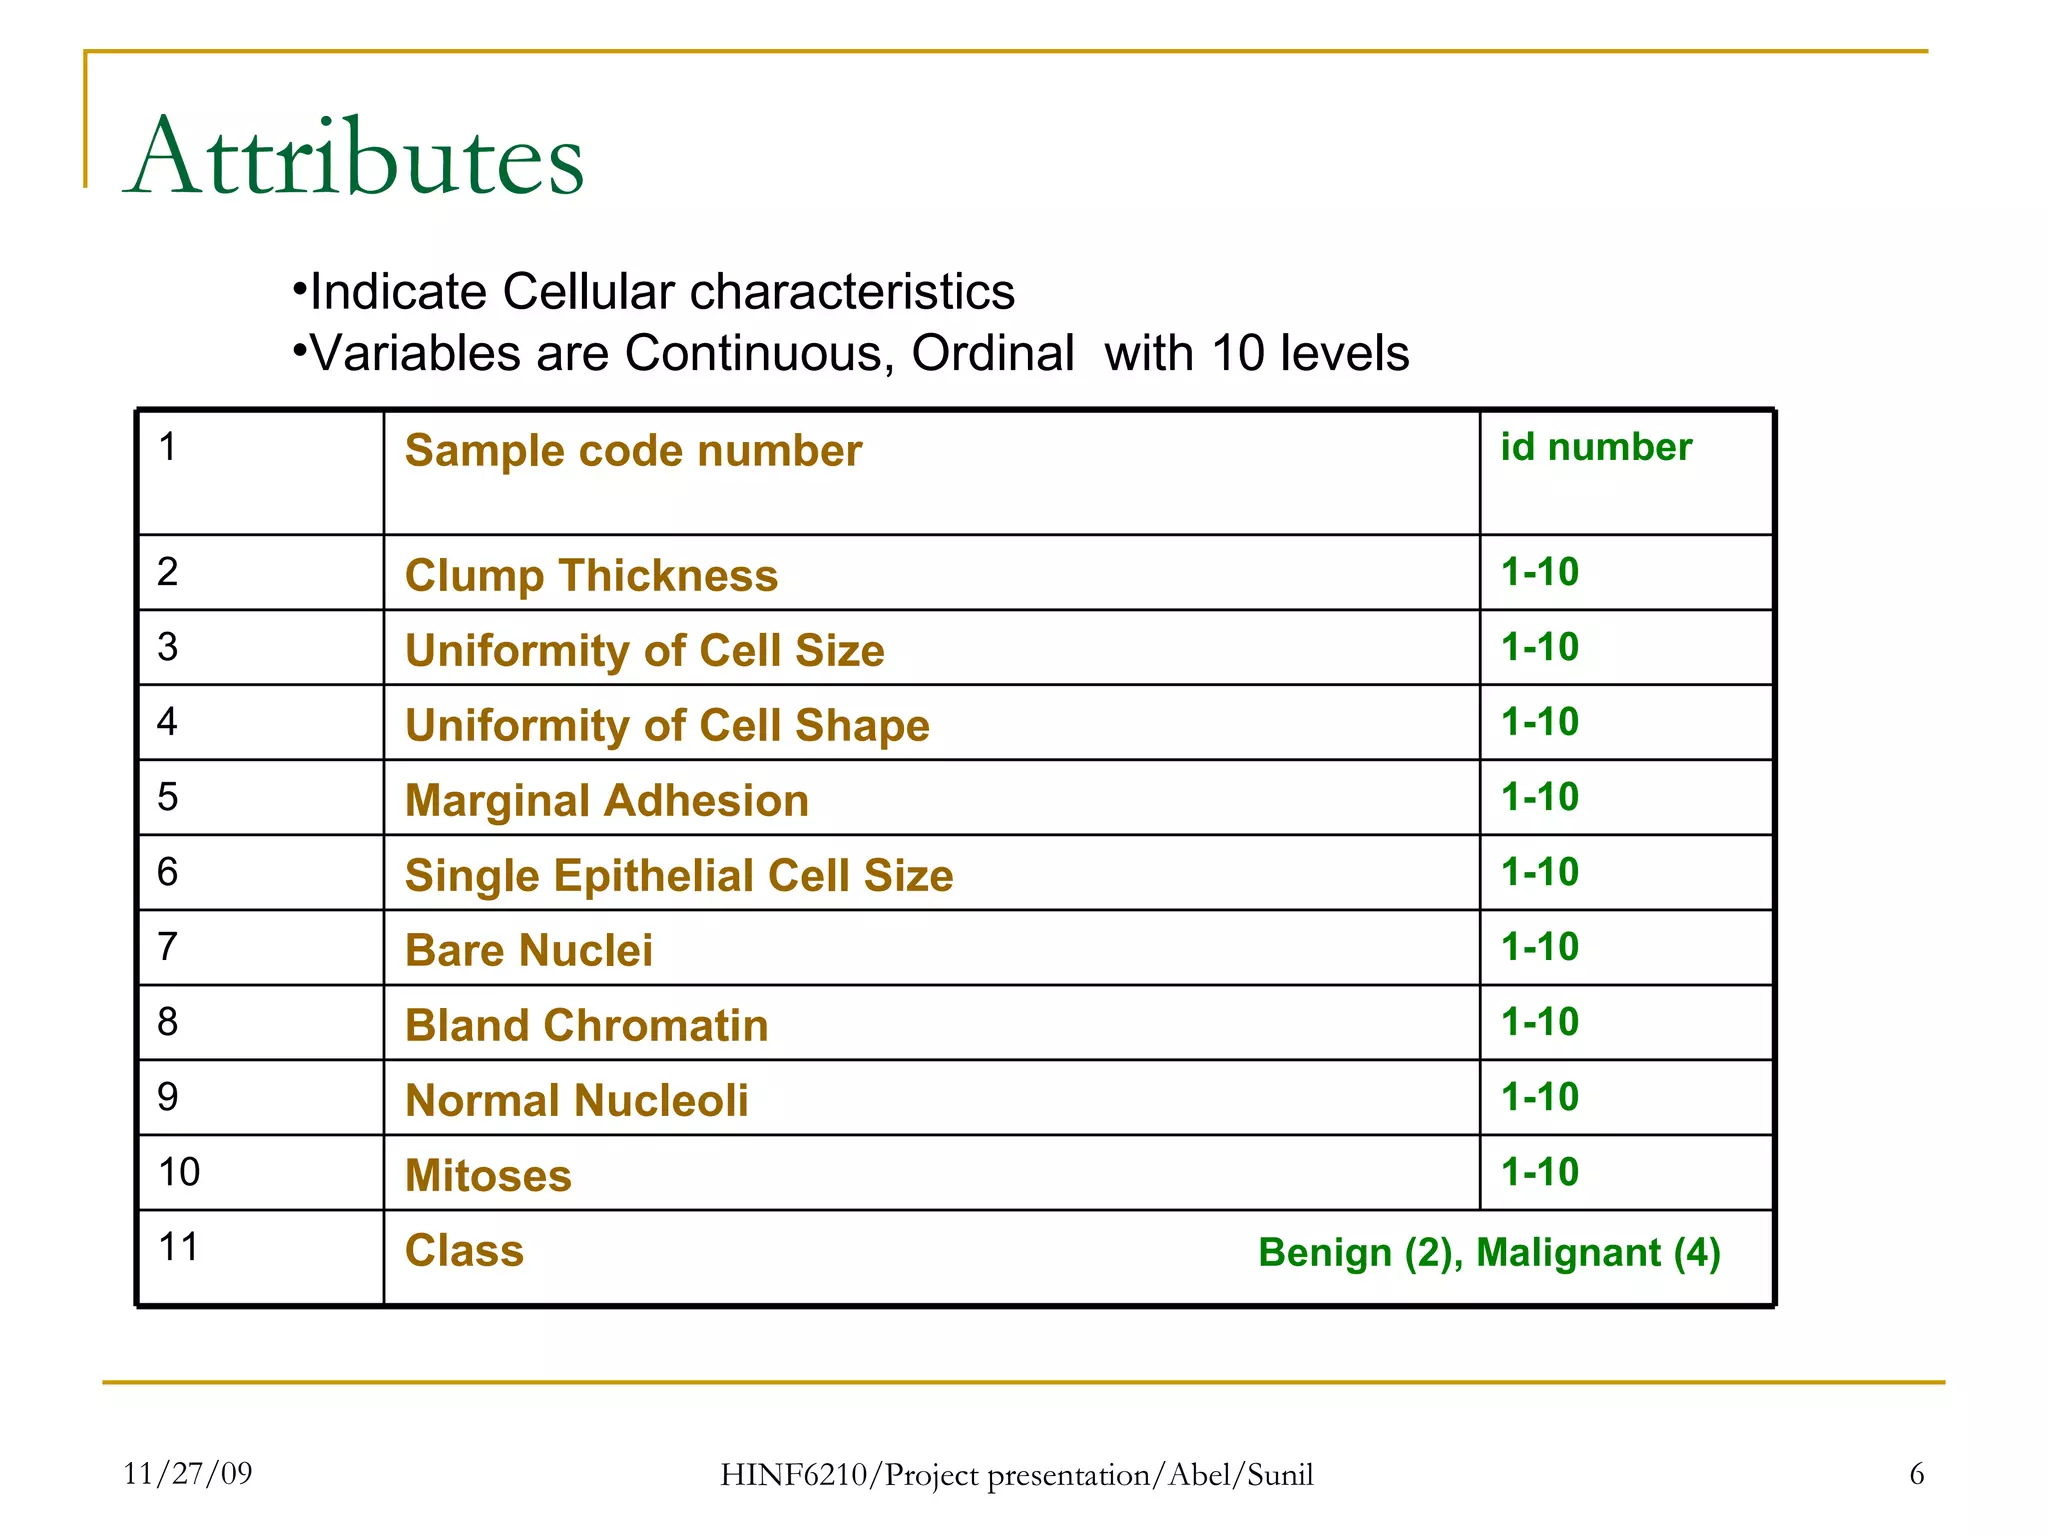
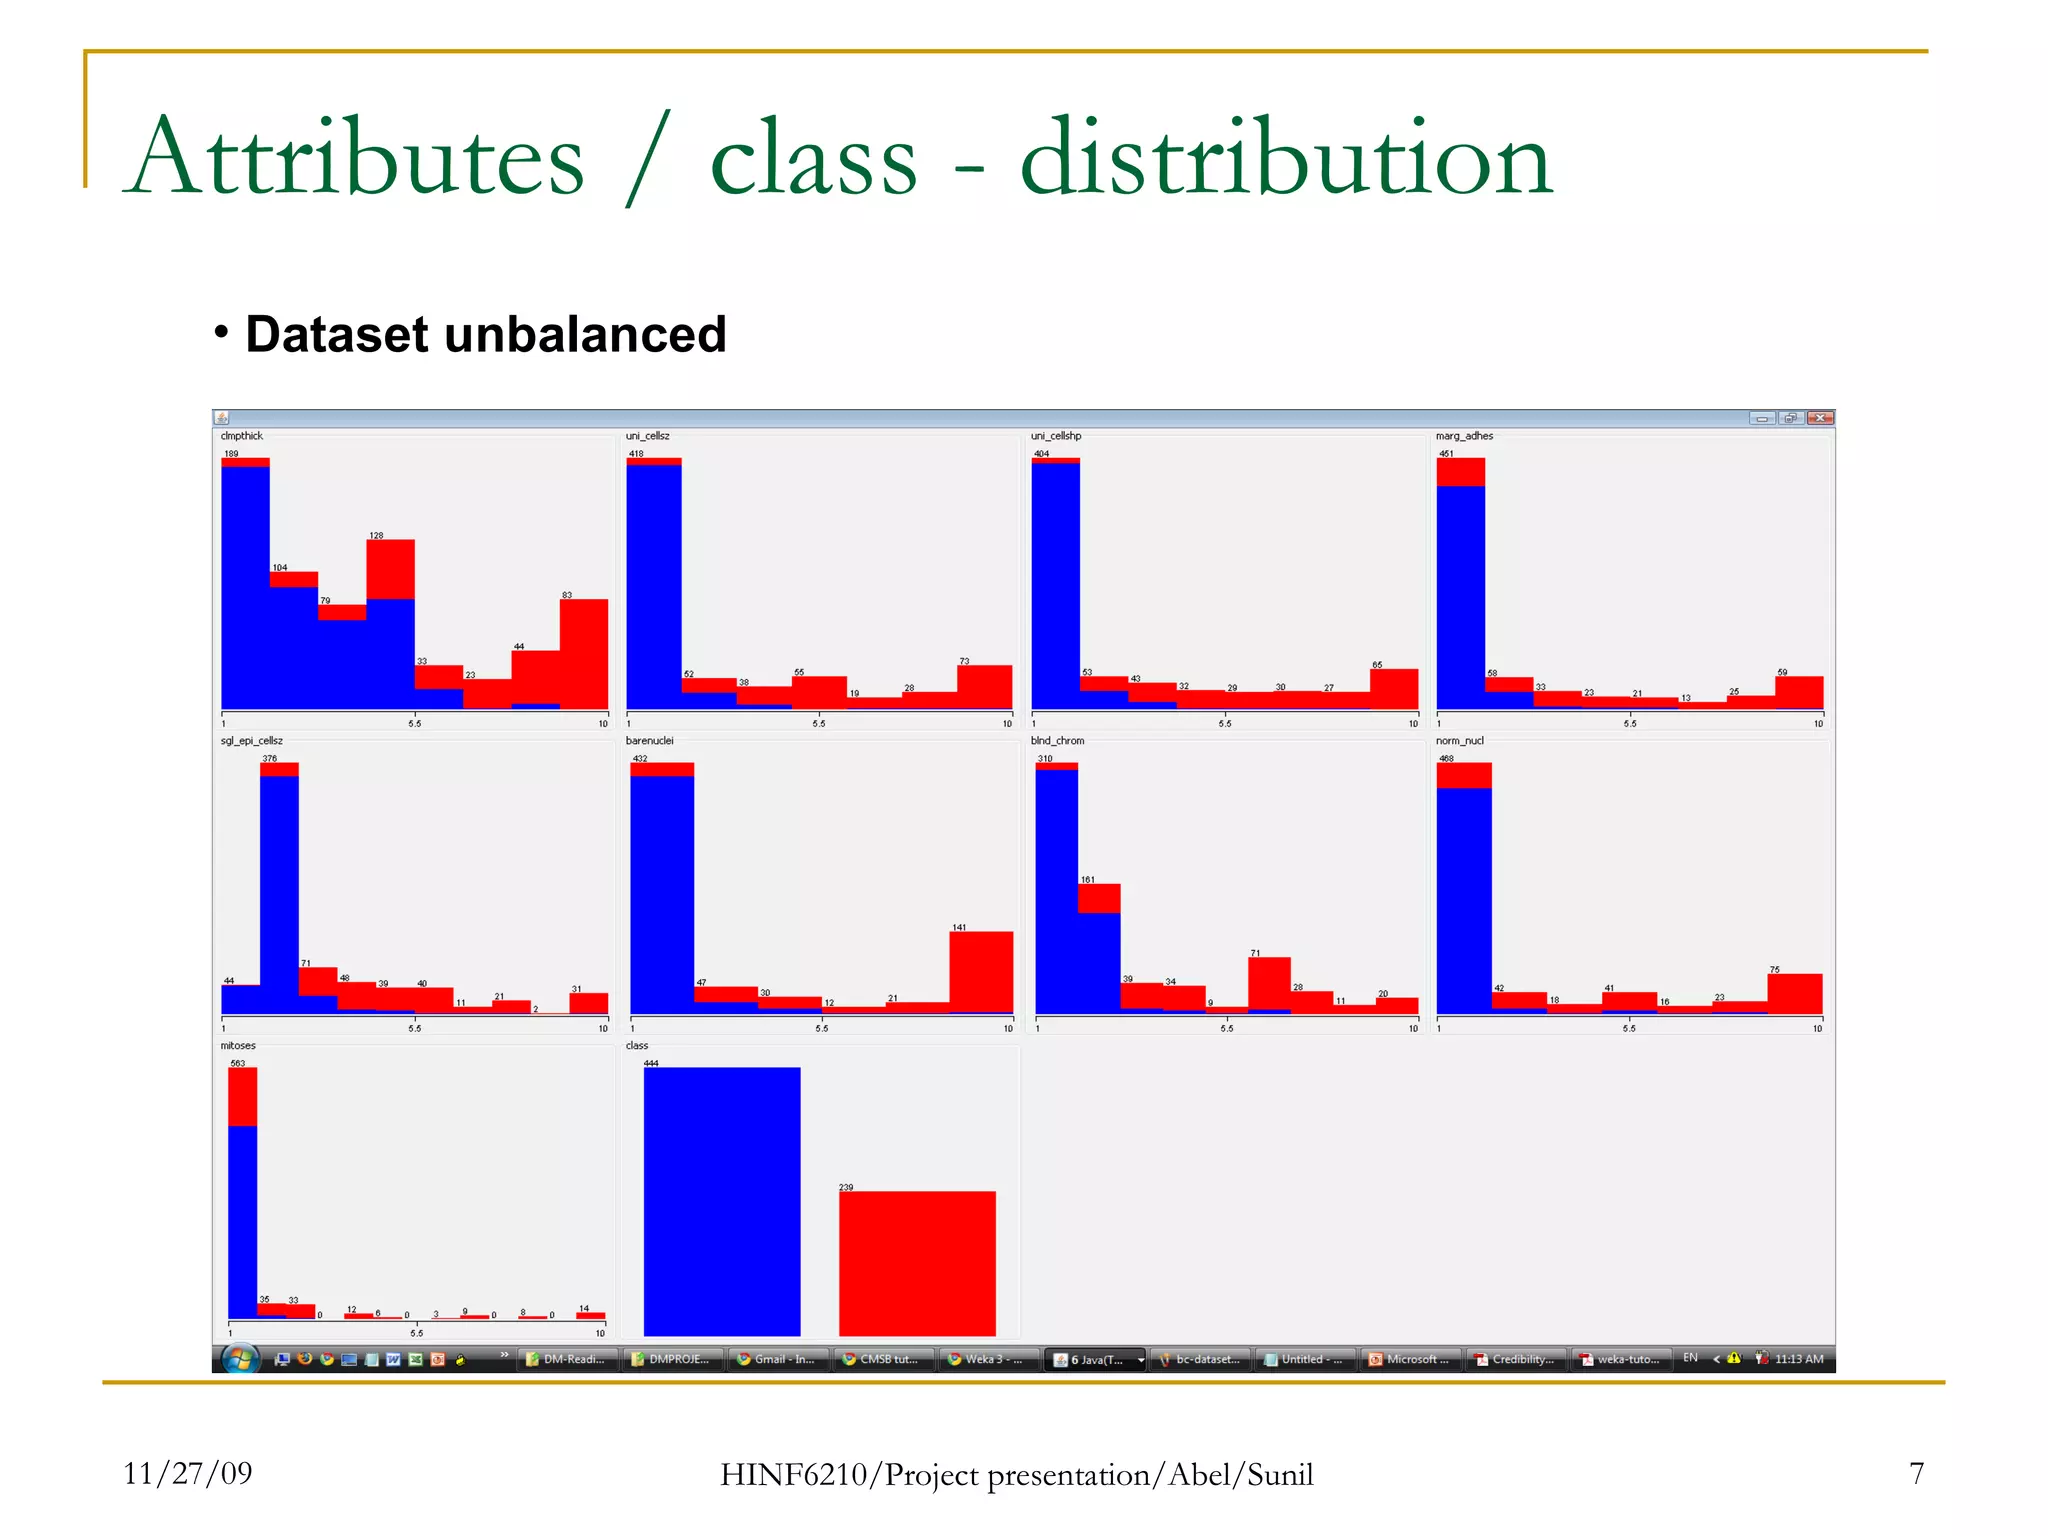
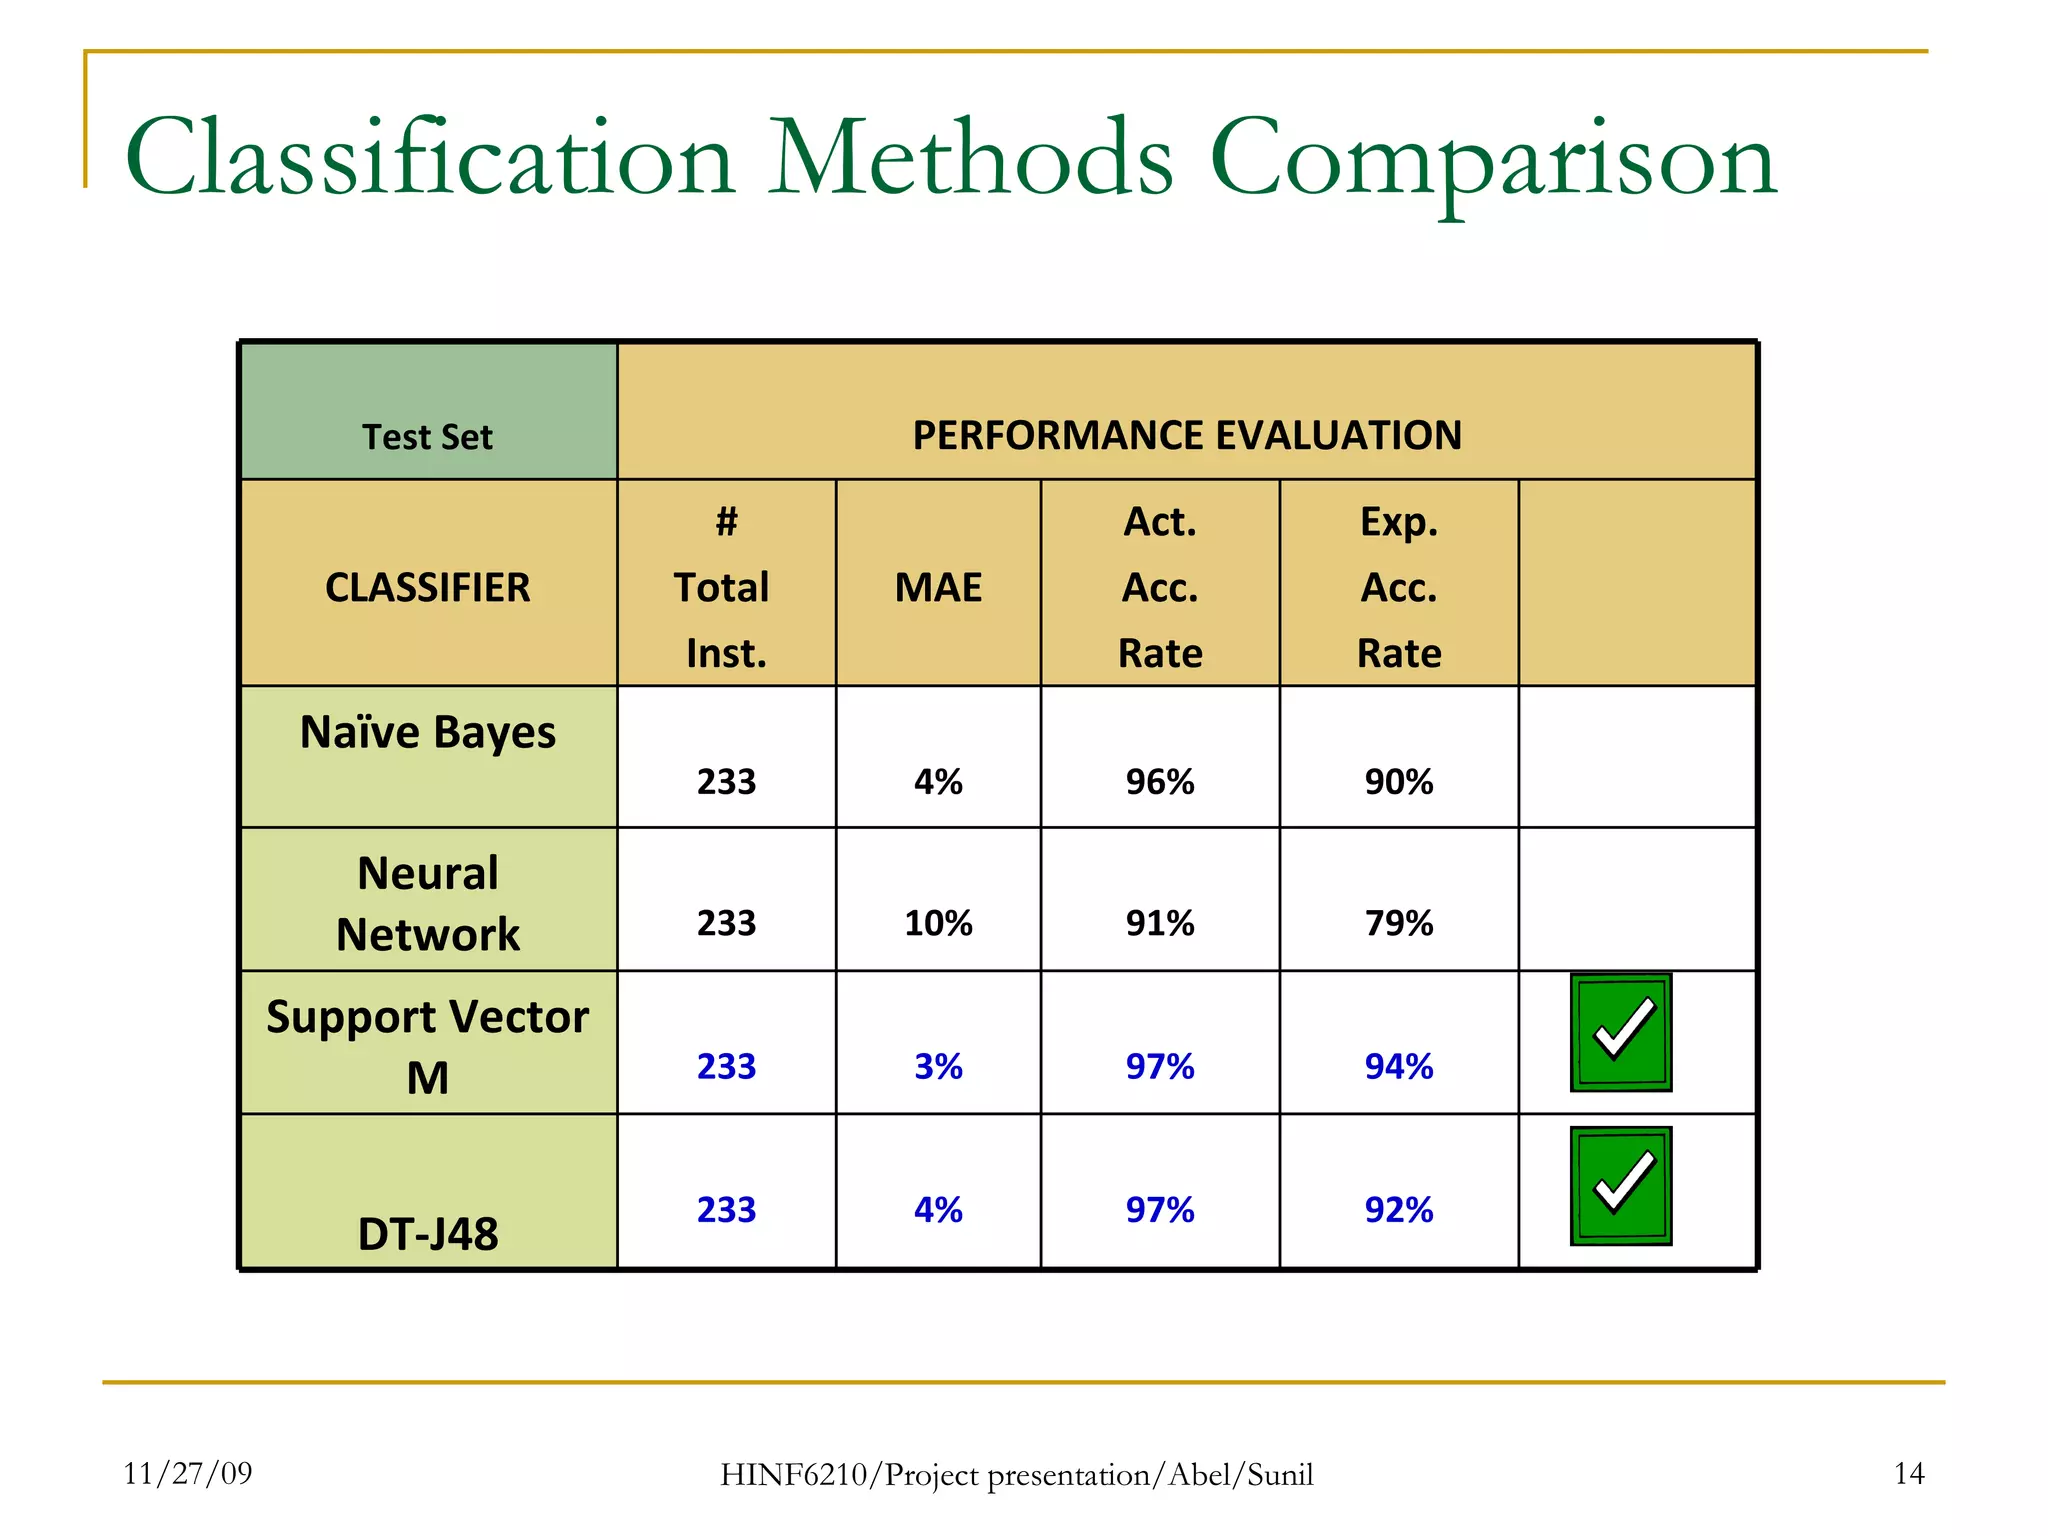
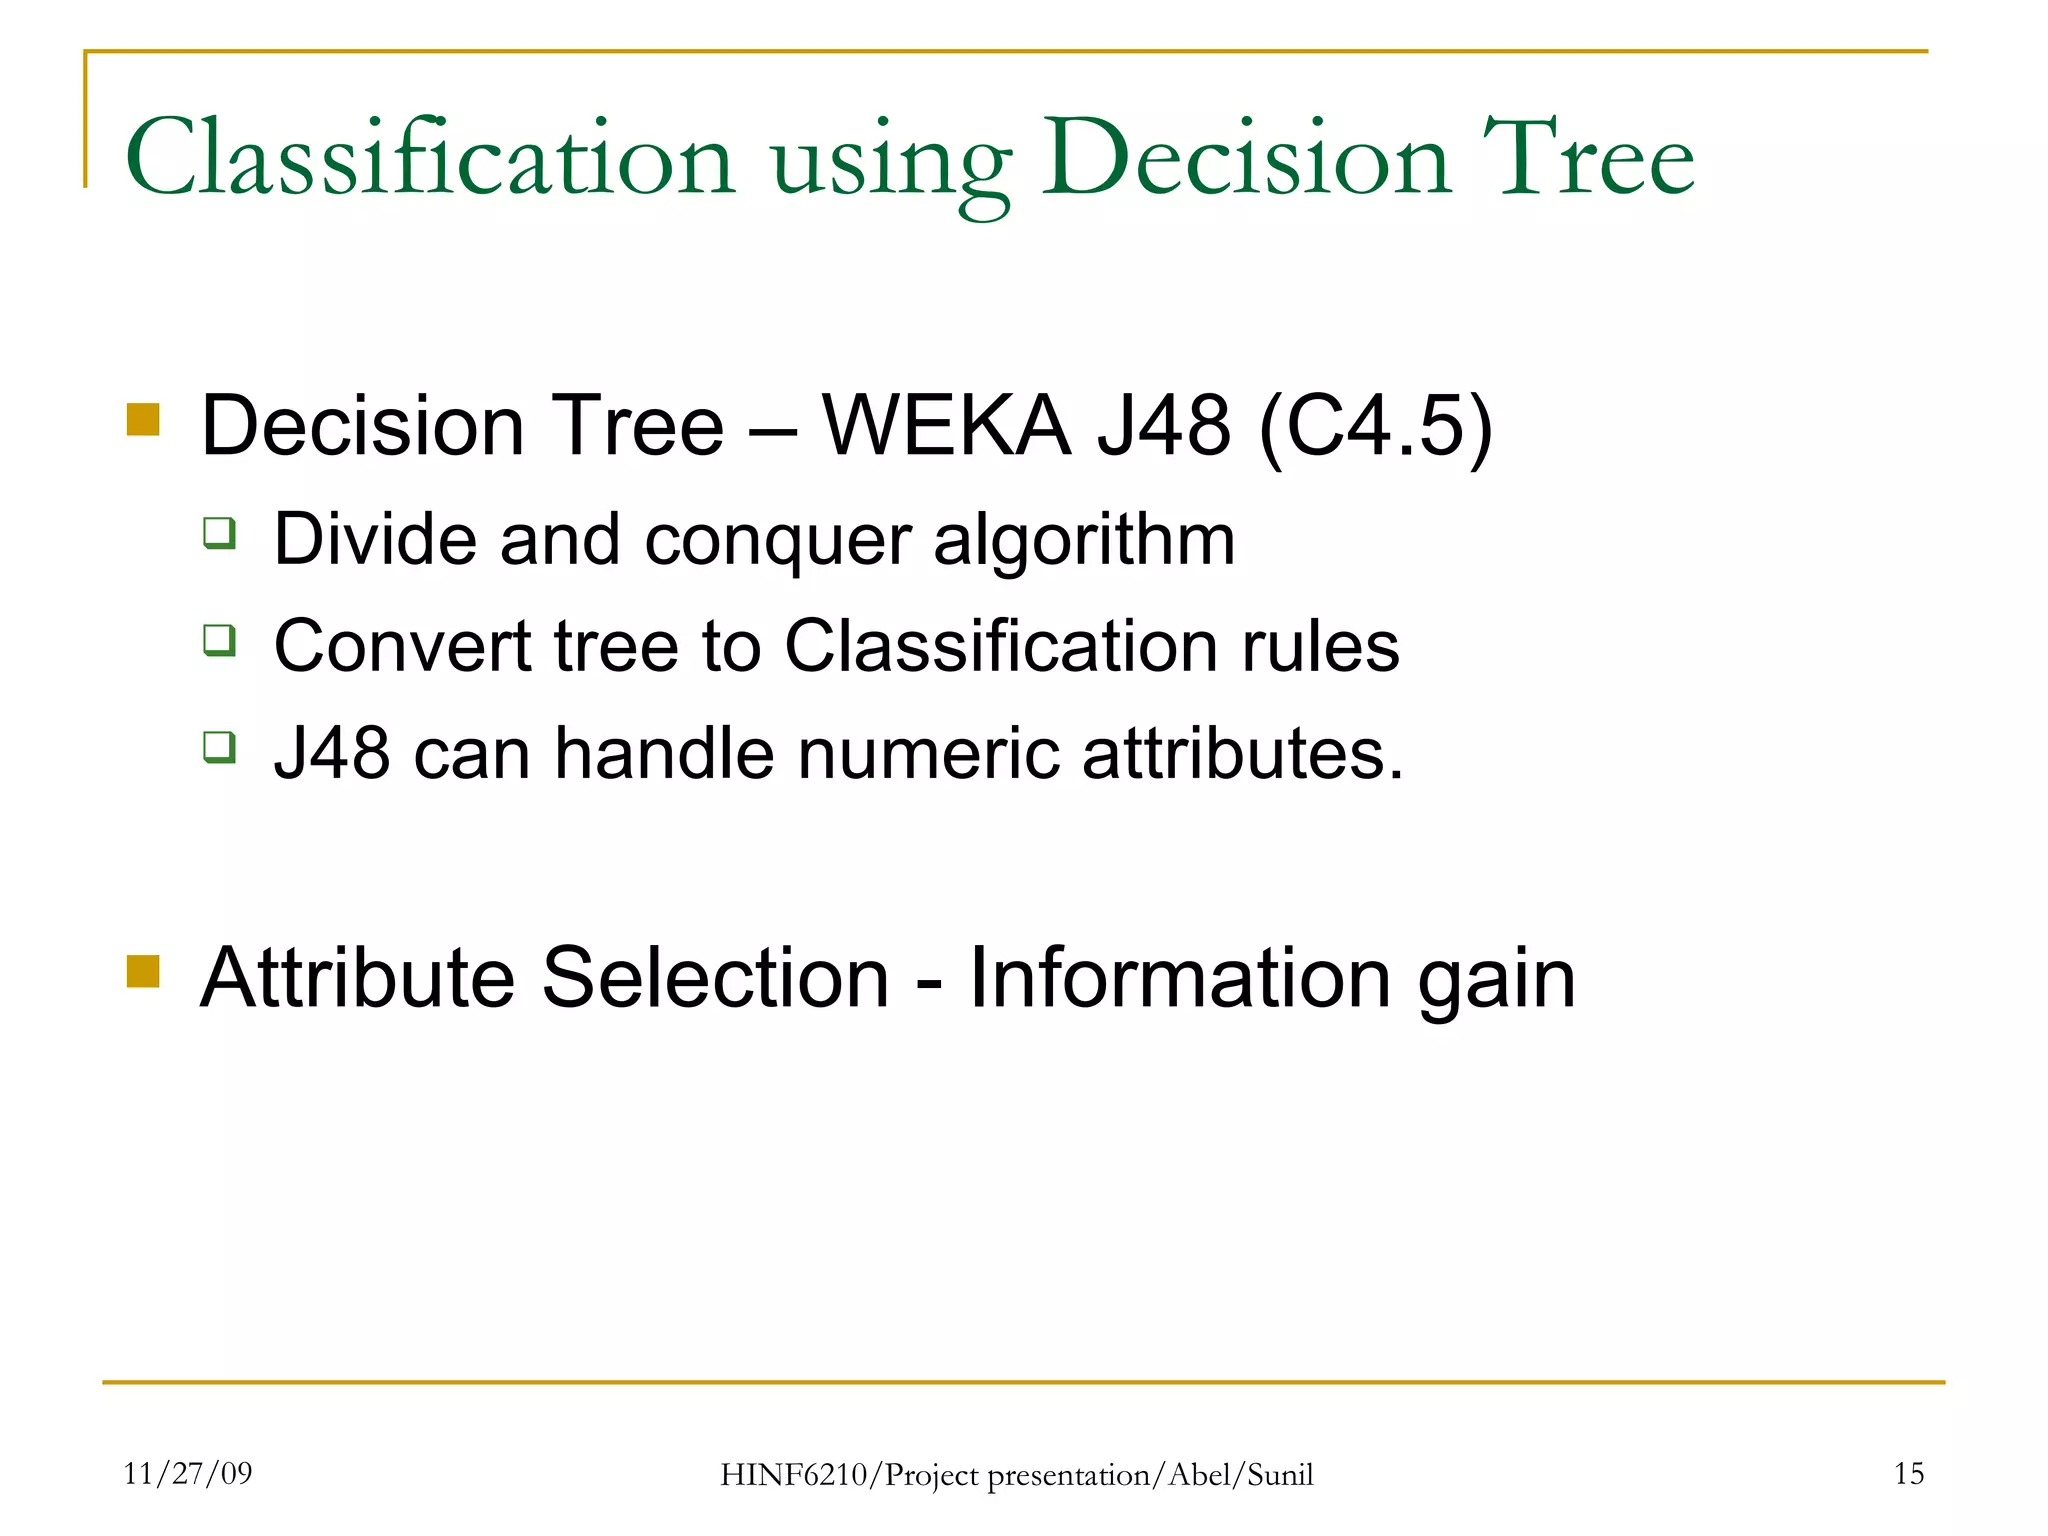
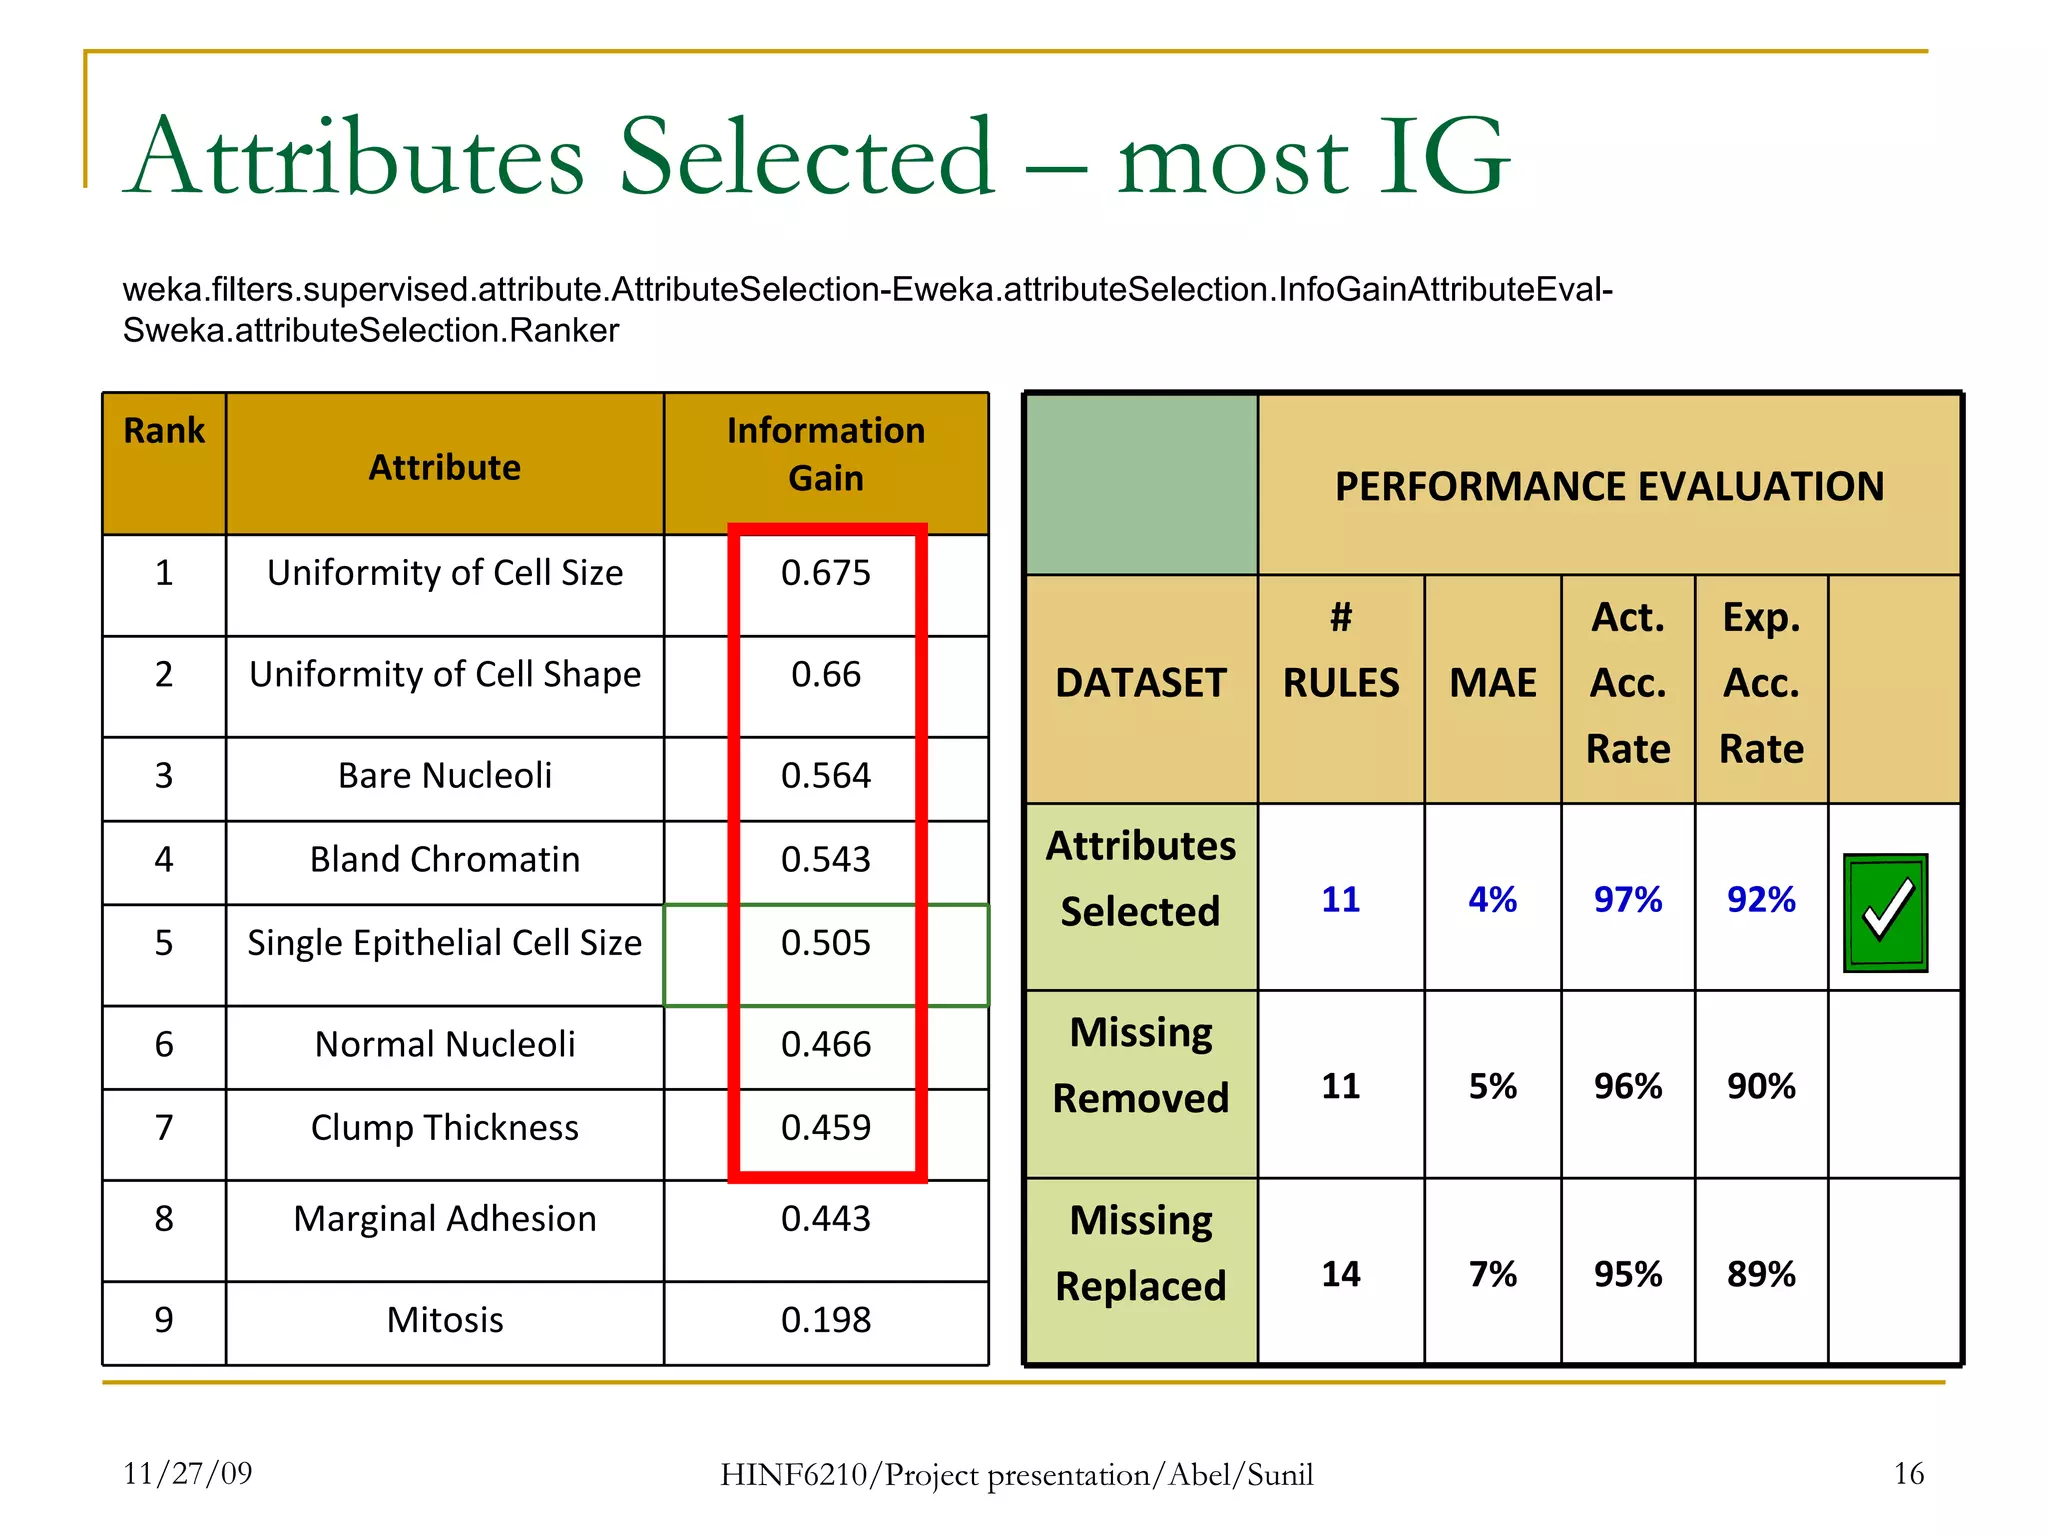
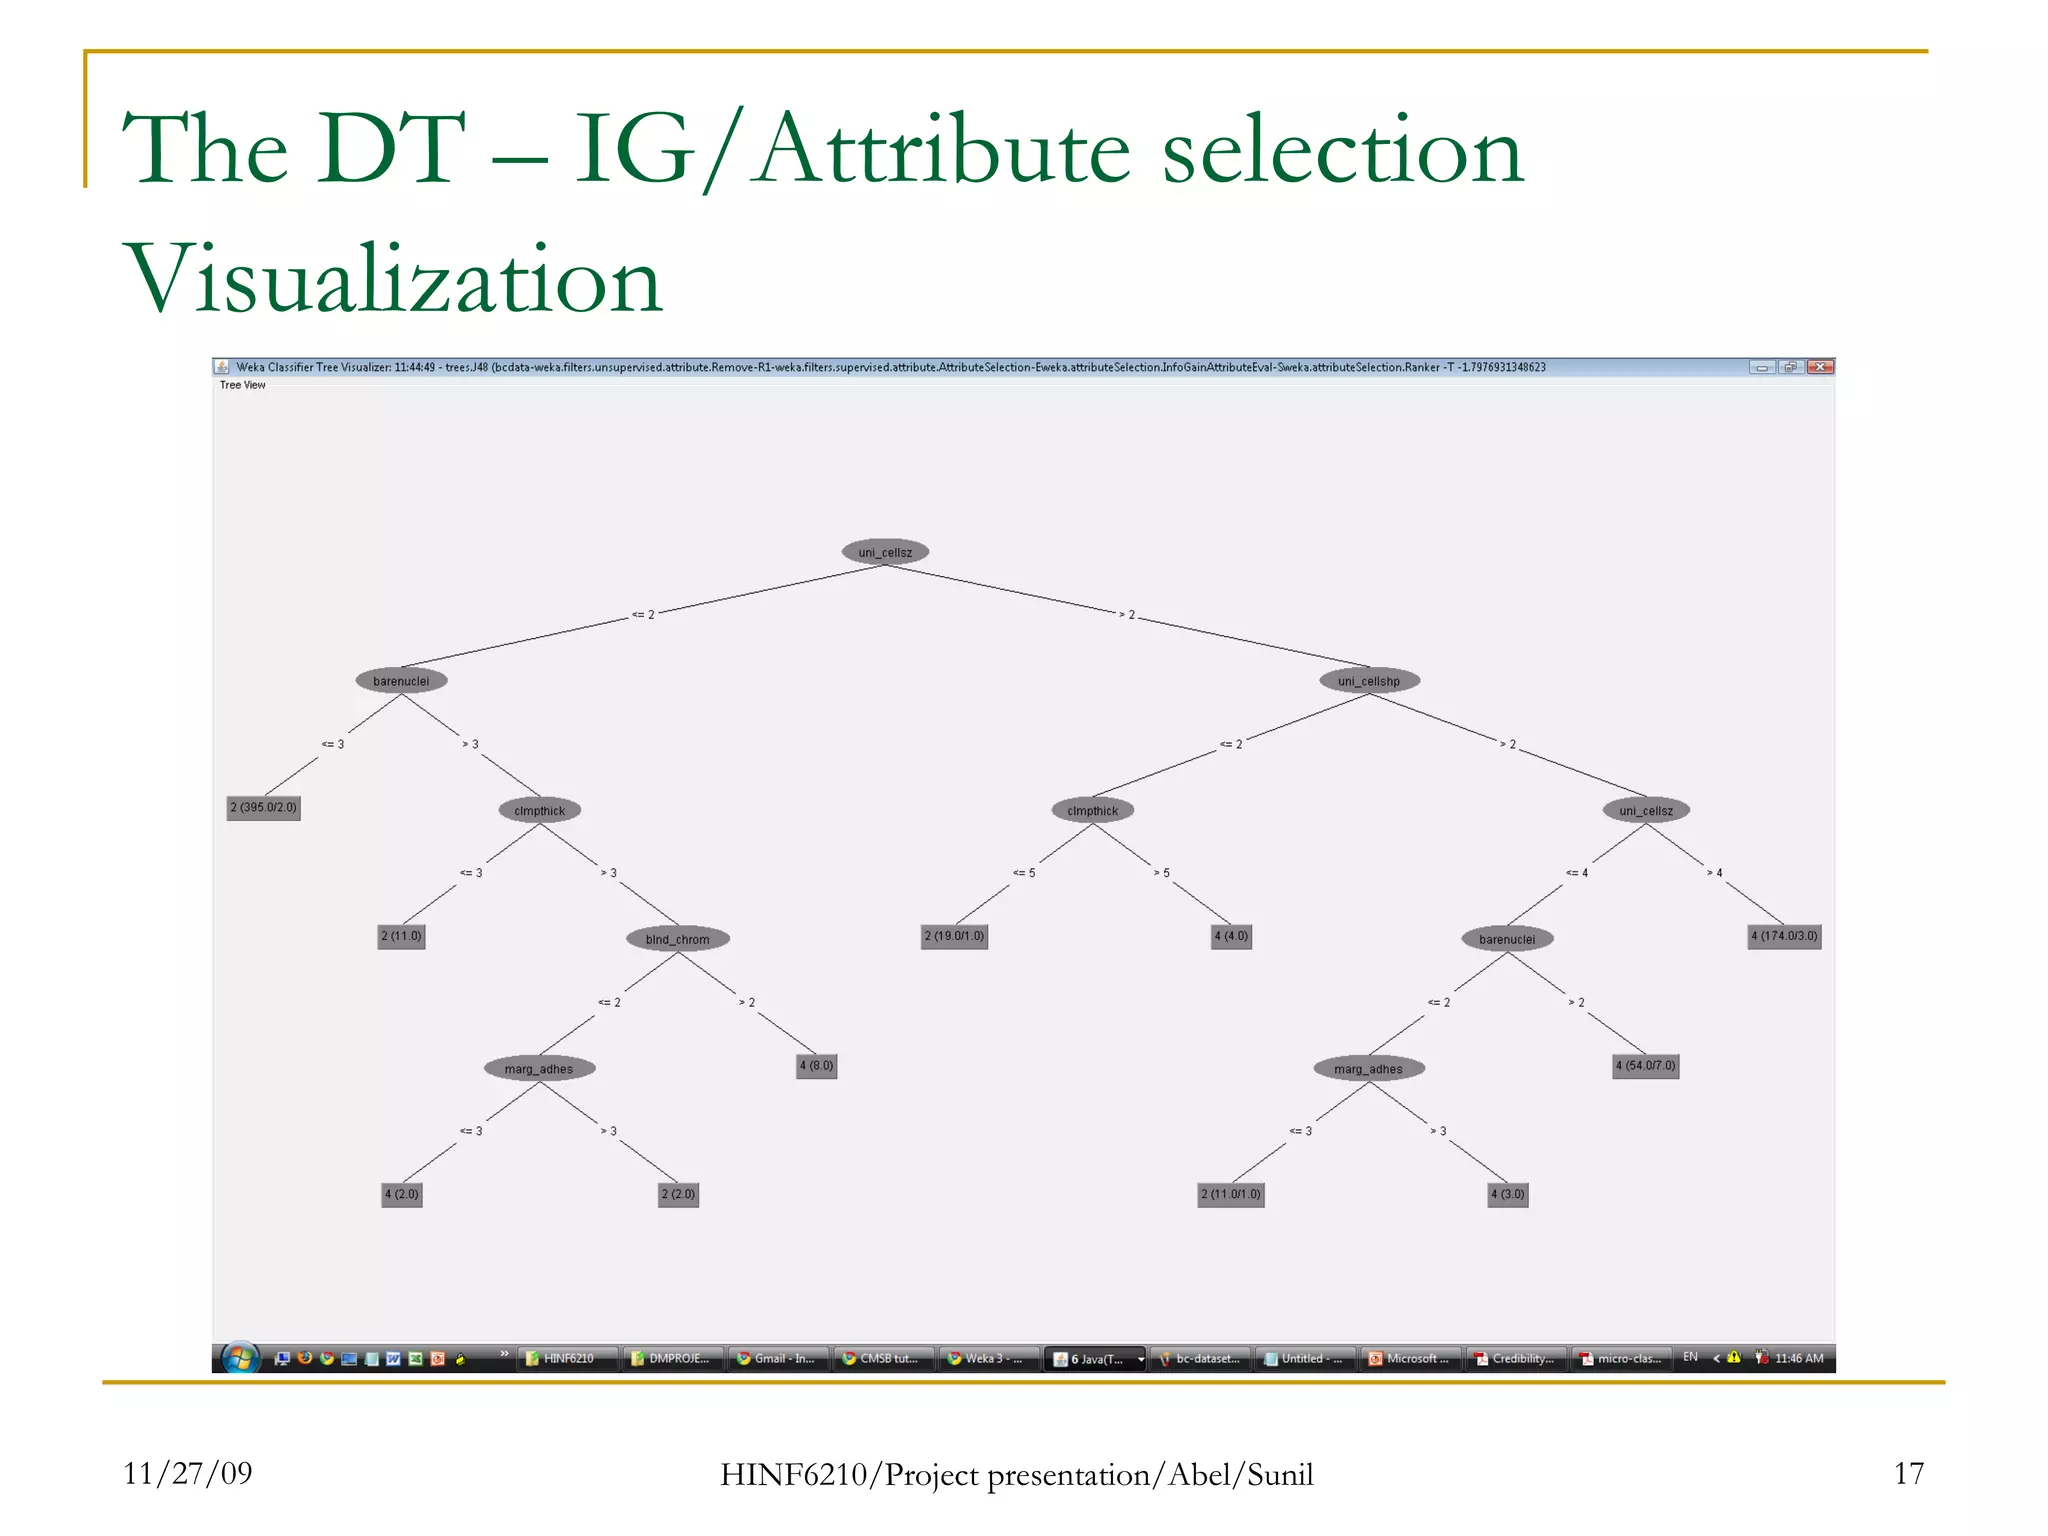
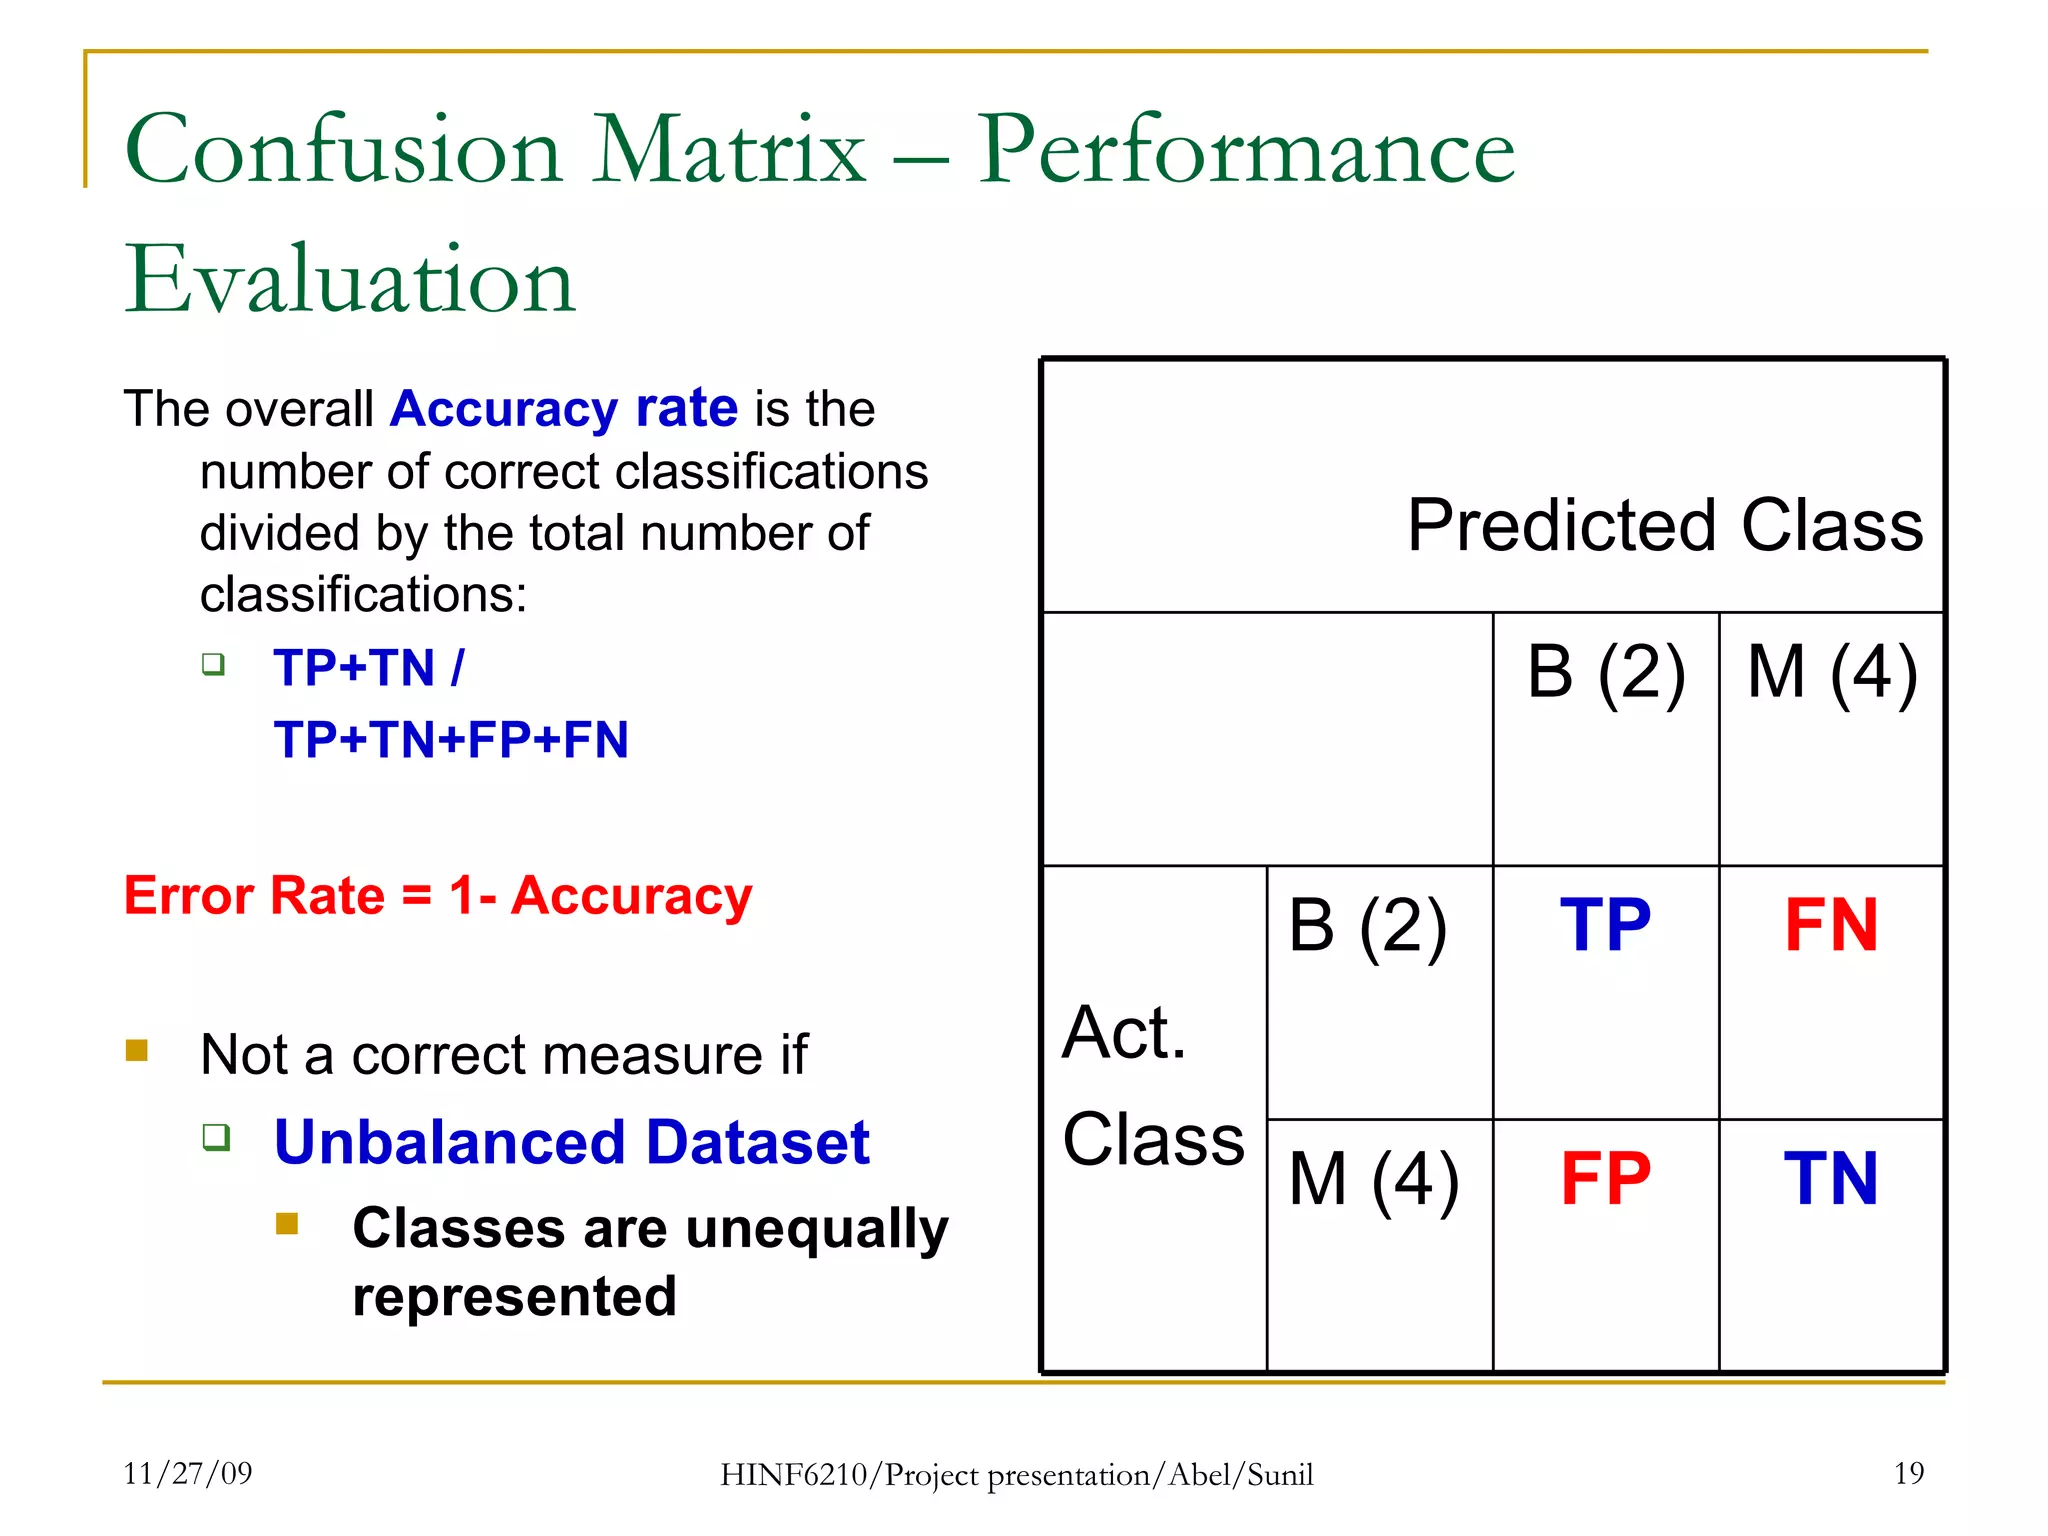
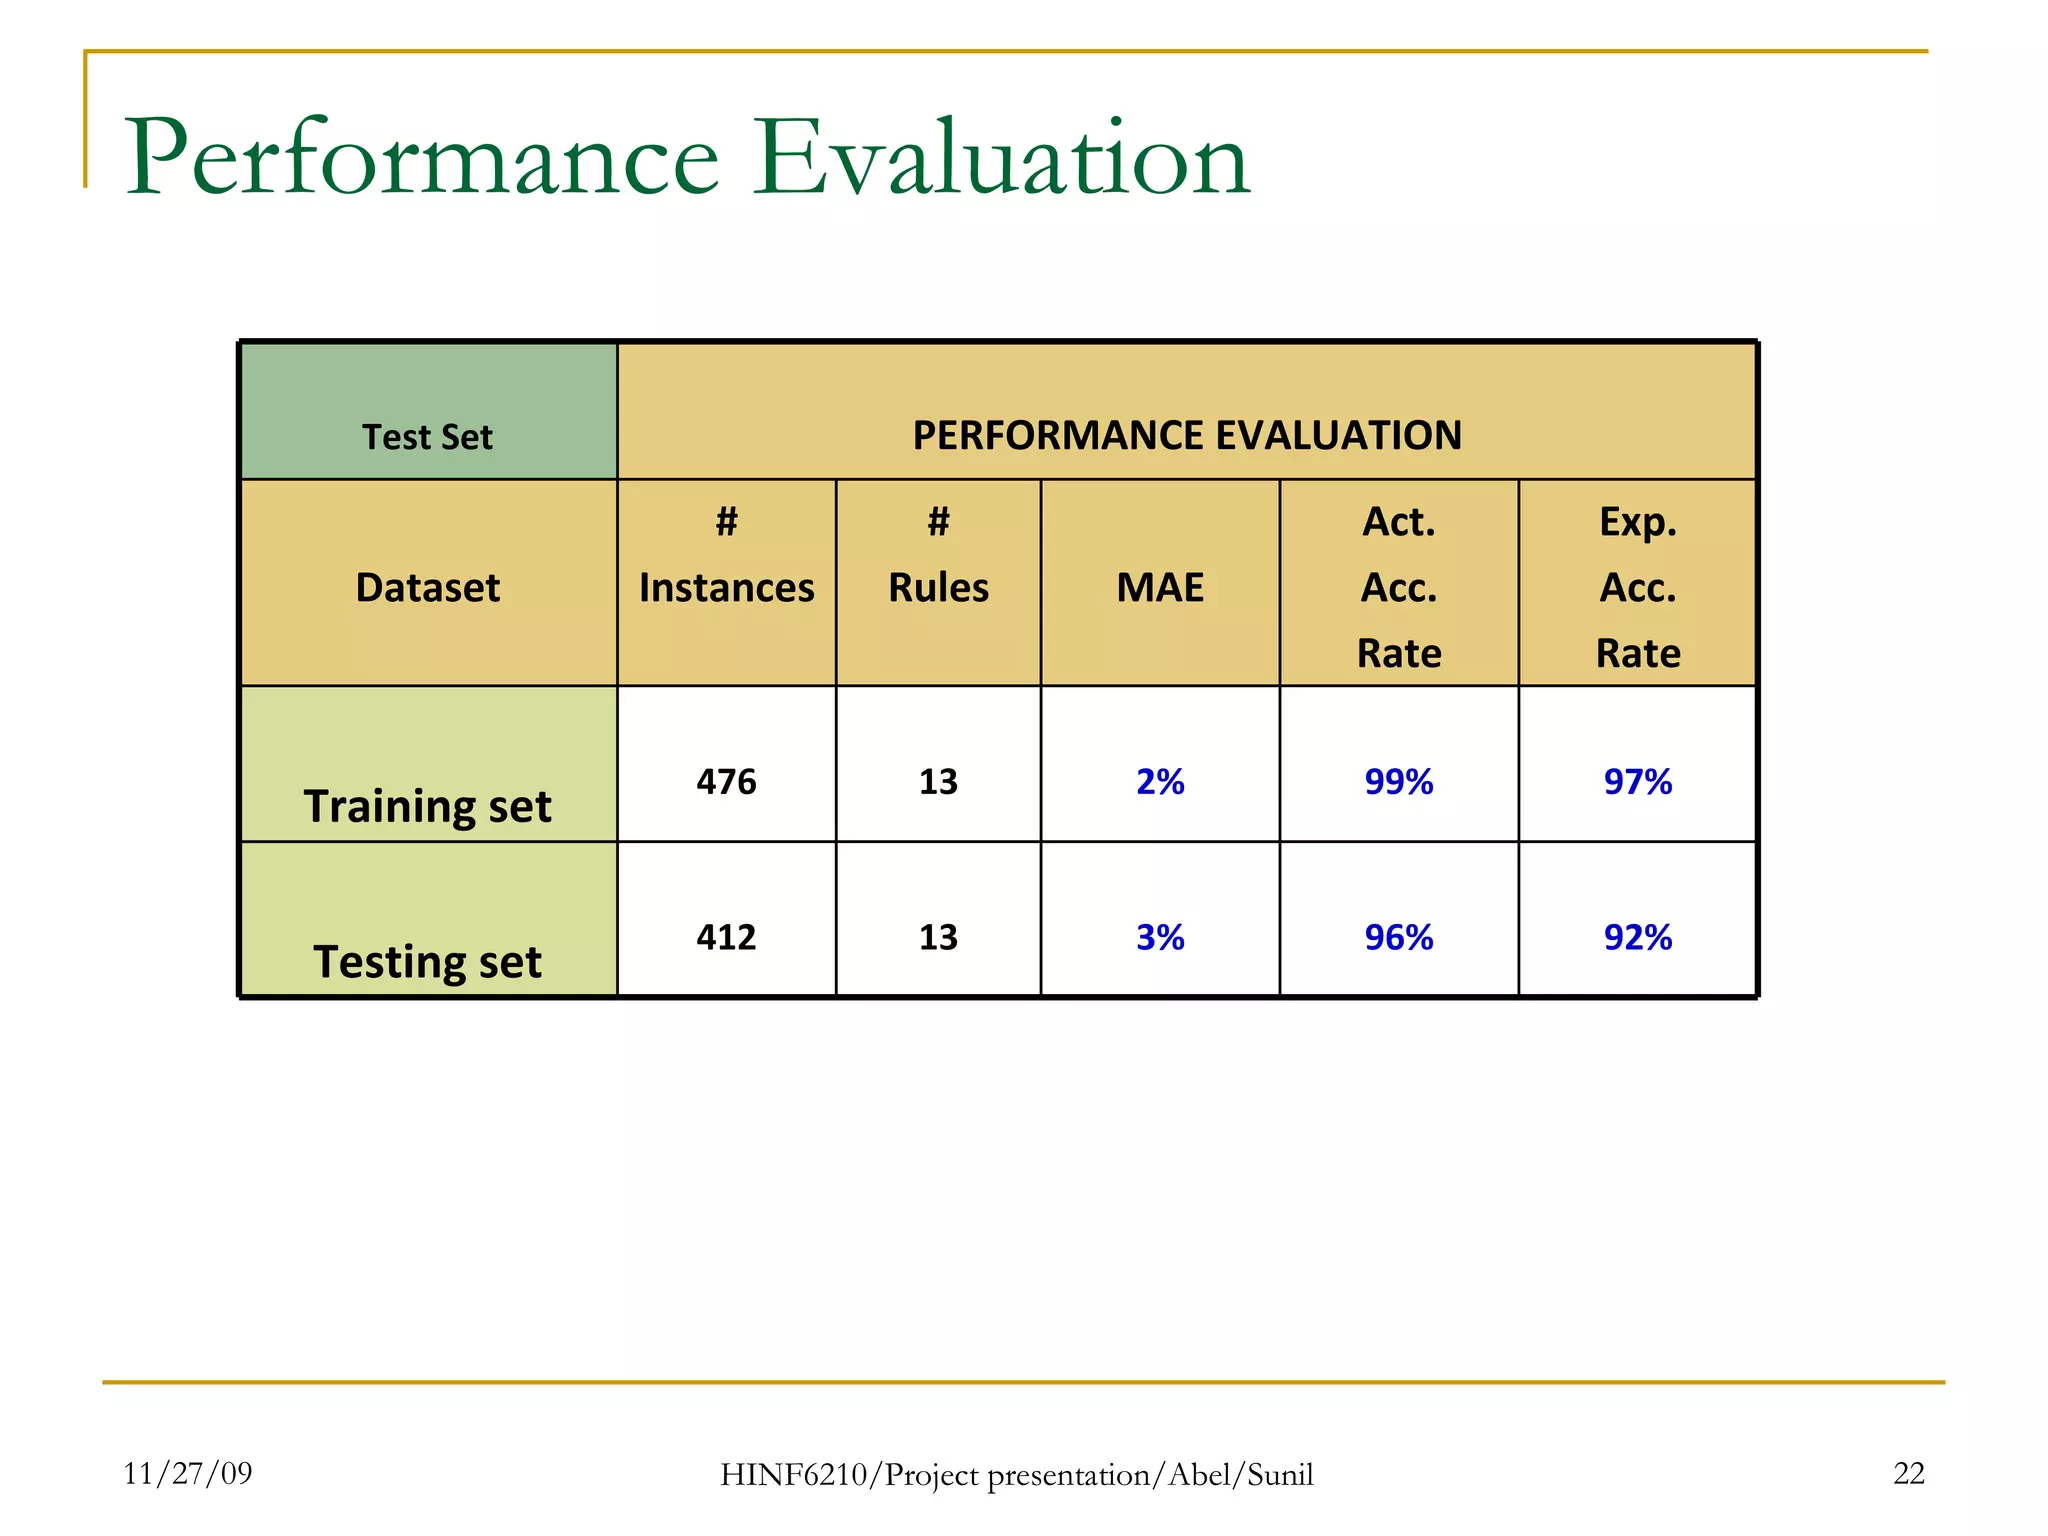
Classification of Breast Cancer dataset using  Decision Tree Induction Sunil Nair  Abel Gebreyesus   Masters of Health Informatics Dalhousie University HINF6210 Project Presentation – November 25, 2008
Agenda Objective Dataset Approach Classification Methods  Decision Tree Problems Future direction
Introduction Breast Cancer prognosis Breast cancer incidence is high Improvement in diagnostic methods Early diagnosis and treatment. But, recurrence is high Good prognosis is important….
Objective  Significance of project Previous work done using this dataset Most previous work indicated room for improvement in increasing accuracy of classifier
Breast Cancer Dataset # of Instances:  699 # of Attributes:  10  plus  Class  attribute Class distribution : Benign (2):  458  (65.5%) Malignant (4):  241  (34.5%) Missing Values : 16 Wisconsin Breast Cancer Database (1991) University of Wisconsin Hospitals,  Dr. William H. Wolberg
Attributes Indicate Cellular characteristics Variables are Continuous, Ordinal  with 10 levels Class  Benign (2), Malignant (4) 11 1-10 Mitoses 10 1-10 Normal Nucleoli 9 1-10 Bland Chromatin 8 1-10 Bare Nuclei 7 1-10 Single Epithelial Cell Size 6 1-10 Marginal Adhesion 5 1-10 Uniformity of Cell Shape 4 1-10 Uniformity of Cell Size 3 1-10 Clump Thickness 2 id number Sample code number 1
Attributes / class - distribution Dataset unbalanced
Our Approach Data Pre-processing Comparison between Classification techniques Decision Tree Induction Attribute Selection J48 Evaluation
Data Pre-processing  Filter out the ID column Handle Missing Values WEKA
Data preprocessing  Two options to manage Missing data – WEKA “ Replacemissingvalues ” weka.filters.unsupervised.attribute.ReplaceMissingValues Missing nominal and numeric attributes replaced with mode-means Remove (delete) the tuple with missing values. Missing values are attribute bare nuclei = 16  Outliers
Comparison chart – Handle Missing Value Confusion Matrix Total Correctly Classified Instances Test split = 223 Accuracy Rate: 95.78% How many predictions by chance? Expected Accuracy Rate = Kappa Statistic - is used to measure the agreement between predicted and actual categorization of data while correcting for prediction that occurs by chance. 89% 95% 7% 14 Missing Replaced 90% 96% 5% 11 Missing Removed 87% 94% 8% 14 Complete Exp. Acc. Rate Act. Acc. Rate MAE # RULES DATASET PERFORMANCE EVALUATION 233 70 163 Total 66 63 3 M 167 7 160 B Total M B Class
Data Pre-processing  Missing Value  Replaced  - Mean-Mode Missing Value  Removed  - Mean-Mode
Agenda Objective Dataset Approach Data Pre-Processing Classification Methods  Decision Tree Problems Future direction
Classification Methods Comparison 94% 97% 3% 233 Support Vector M 92% 97% 4% 233 DT-J48 79% 91% 10% 233 Neural Network 90% 96% 4% 233 Naïve Bayes Exp. Acc. Rate Act. Acc. Rate MAE # Total  Inst. CLASSIFIER PERFORMANCE EVALUATION Test Set
Classification using Decision Tree  Decision Tree – WEKA J48 (C4.5) Divide and conquer algorithm Convert tree to Classification rules J48 can handle numeric attributes. Attribute Selection - Information gain
Attributes Selected – most IG weka.filters.supervised.attribute.AttributeSelection-Eweka.attributeSelection.InfoGainAttributeEval-Sweka.attributeSelection.Ranker  89% 95% 7% 14 Missing Replaced 90% 96% 5% 11 Missing Removed 92% 97% 4% 11 Attributes  Selected Exp. Acc. Rate Act. Acc. Rate MAE # RULES DATASET PERFORMANCE EVALUATION 0.198 Mitosis 9 0.443 Marginal Adhesion 8 0.459 Clump Thickness 7 0.466 Normal Nucleoli 6 0.505 Single Epithelial Cell Size 5 0.543 Bland Chromatin 4 0.564 Bare Nucleoli 3 0.66 Uniformity of Cell Shape 2 0.675 Uniformity of Cell Size 1 Information Gain Attribute Rank
The DT – IG/Attribute selection Visualization
Decision Tree - Problems Concerns Missing values Pruning – Preprune or postprune Estimating error rates  Unbalanced Dataset Bias in prediction Overfitting – in test set Underfitting
Confusion Matrix – Performance Evaluation The overall  Accuracy  rate  is the number of correct classifications divided by the total number of classifications: TP+TN /  TP+TN+FP+FN   Error Rate = 1- Accuracy  Not a correct measure if Unbalanced Dataset  Classes are unequally represented TN FP M (4) FN TP B (2) Act. Class M (4) B (2) Predicted Class
Unbalanced dataset problem Solution: Stratified Sampling Method Partitioning of dataset based on class Random Sampling Process Create Training and Test set with equal size class Testing set data independent from Training set. Standard Verification technique Best error estimate
Stratified Sampling Method
Performance Evaluation 92% 96% 3% 13 412 Testing set 97% 99% 2% 13 476 Training set Exp. Acc. Rate Act. Acc. Rate MAE # Rules # Instances Dataset PERFORMANCE EVALUATION Test Set
Tree Visualization
Unbalanced dataset Problem Solution: Cost Matrix  Cost sensitive classification Costs not known Complete financial analysis needed; i.e cost of Using ML tool Gathering training data Using the model Determining the attributes for test Cross Validation once all costs are known
Future direction The overall accuracy of the classifier needs to be increased Cluster based Stratified Sampling Partitioning the original dataset using Kmeans Alg. Multiple Classifier model Bagging and Boosting techniques ROC (Receiver Operating Characteristic)  Plotting the TP Rate (Y-axis) over FP Rate (X-Axis) Advantage: Does not regard class distribution or error costs.
ROC Curve - Visualization For Benign class For Malignant class Area under the curve AUC Larger the area, better is the model
Questions / Comments Thank You !

Data Mining - Classification Of Breast Cancer Dataset using Decision Tree Induction - Sunil Nair Health Informatics Dalhousie University

  • 1.
    Classification of BreastCancer dataset using Decision Tree Induction Sunil Nair Abel Gebreyesus Masters of Health Informatics Dalhousie University HINF6210 Project Presentation – November 25, 2008
  • 2.
    Agenda Objective DatasetApproach Classification Methods Decision Tree Problems Future direction
  • 3.
    Introduction Breast Cancerprognosis Breast cancer incidence is high Improvement in diagnostic methods Early diagnosis and treatment. But, recurrence is high Good prognosis is important….
  • 4.
    Objective Significanceof project Previous work done using this dataset Most previous work indicated room for improvement in increasing accuracy of classifier
  • 5.
    Breast Cancer Dataset# of Instances: 699 # of Attributes: 10 plus Class attribute Class distribution : Benign (2): 458 (65.5%) Malignant (4): 241 (34.5%) Missing Values : 16 Wisconsin Breast Cancer Database (1991) University of Wisconsin Hospitals, Dr. William H. Wolberg
  • 6.
    Attributes Indicate Cellularcharacteristics Variables are Continuous, Ordinal with 10 levels Class Benign (2), Malignant (4) 11 1-10 Mitoses 10 1-10 Normal Nucleoli 9 1-10 Bland Chromatin 8 1-10 Bare Nuclei 7 1-10 Single Epithelial Cell Size 6 1-10 Marginal Adhesion 5 1-10 Uniformity of Cell Shape 4 1-10 Uniformity of Cell Size 3 1-10 Clump Thickness 2 id number Sample code number 1
  • 7.
    Attributes / class- distribution Dataset unbalanced
  • 8.
    Our Approach DataPre-processing Comparison between Classification techniques Decision Tree Induction Attribute Selection J48 Evaluation
  • 9.
    Data Pre-processing Filter out the ID column Handle Missing Values WEKA
  • 10.
    Data preprocessing Two options to manage Missing data – WEKA “ Replacemissingvalues ” weka.filters.unsupervised.attribute.ReplaceMissingValues Missing nominal and numeric attributes replaced with mode-means Remove (delete) the tuple with missing values. Missing values are attribute bare nuclei = 16 Outliers
  • 11.
    Comparison chart –Handle Missing Value Confusion Matrix Total Correctly Classified Instances Test split = 223 Accuracy Rate: 95.78% How many predictions by chance? Expected Accuracy Rate = Kappa Statistic - is used to measure the agreement between predicted and actual categorization of data while correcting for prediction that occurs by chance. 89% 95% 7% 14 Missing Replaced 90% 96% 5% 11 Missing Removed 87% 94% 8% 14 Complete Exp. Acc. Rate Act. Acc. Rate MAE # RULES DATASET PERFORMANCE EVALUATION 233 70 163 Total 66 63 3 M 167 7 160 B Total M B Class
  • 12.
    Data Pre-processing Missing Value Replaced - Mean-Mode Missing Value Removed - Mean-Mode
  • 13.
    Agenda Objective DatasetApproach Data Pre-Processing Classification Methods Decision Tree Problems Future direction
  • 14.
    Classification Methods Comparison94% 97% 3% 233 Support Vector M 92% 97% 4% 233 DT-J48 79% 91% 10% 233 Neural Network 90% 96% 4% 233 Naïve Bayes Exp. Acc. Rate Act. Acc. Rate MAE # Total Inst. CLASSIFIER PERFORMANCE EVALUATION Test Set
  • 15.
    Classification using DecisionTree Decision Tree – WEKA J48 (C4.5) Divide and conquer algorithm Convert tree to Classification rules J48 can handle numeric attributes. Attribute Selection - Information gain
  • 16.
    Attributes Selected –most IG weka.filters.supervised.attribute.AttributeSelection-Eweka.attributeSelection.InfoGainAttributeEval-Sweka.attributeSelection.Ranker 89% 95% 7% 14 Missing Replaced 90% 96% 5% 11 Missing Removed 92% 97% 4% 11 Attributes Selected Exp. Acc. Rate Act. Acc. Rate MAE # RULES DATASET PERFORMANCE EVALUATION 0.198 Mitosis 9 0.443 Marginal Adhesion 8 0.459 Clump Thickness 7 0.466 Normal Nucleoli 6 0.505 Single Epithelial Cell Size 5 0.543 Bland Chromatin 4 0.564 Bare Nucleoli 3 0.66 Uniformity of Cell Shape 2 0.675 Uniformity of Cell Size 1 Information Gain Attribute Rank
  • 17.
    The DT –IG/Attribute selection Visualization
  • 18.
    Decision Tree -Problems Concerns Missing values Pruning – Preprune or postprune Estimating error rates Unbalanced Dataset Bias in prediction Overfitting – in test set Underfitting
  • 19.
    Confusion Matrix –Performance Evaluation The overall Accuracy rate is the number of correct classifications divided by the total number of classifications: TP+TN / TP+TN+FP+FN Error Rate = 1- Accuracy Not a correct measure if Unbalanced Dataset Classes are unequally represented TN FP M (4) FN TP B (2) Act. Class M (4) B (2) Predicted Class
  • 20.
    Unbalanced dataset problemSolution: Stratified Sampling Method Partitioning of dataset based on class Random Sampling Process Create Training and Test set with equal size class Testing set data independent from Training set. Standard Verification technique Best error estimate
  • 21.
  • 22.
    Performance Evaluation 92%96% 3% 13 412 Testing set 97% 99% 2% 13 476 Training set Exp. Acc. Rate Act. Acc. Rate MAE # Rules # Instances Dataset PERFORMANCE EVALUATION Test Set
  • 23.
  • 24.
    Unbalanced dataset ProblemSolution: Cost Matrix Cost sensitive classification Costs not known Complete financial analysis needed; i.e cost of Using ML tool Gathering training data Using the model Determining the attributes for test Cross Validation once all costs are known
  • 25.
    Future direction Theoverall accuracy of the classifier needs to be increased Cluster based Stratified Sampling Partitioning the original dataset using Kmeans Alg. Multiple Classifier model Bagging and Boosting techniques ROC (Receiver Operating Characteristic) Plotting the TP Rate (Y-axis) over FP Rate (X-Axis) Advantage: Does not regard class distribution or error costs.
  • 26.
    ROC Curve -Visualization For Benign class For Malignant class Area under the curve AUC Larger the area, better is the model
  • 27.