Downloaded 432 times
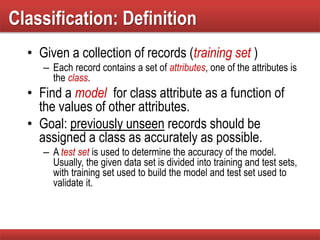
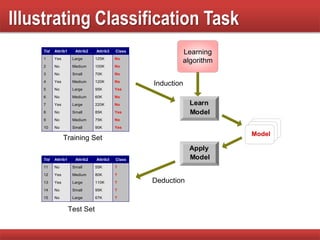
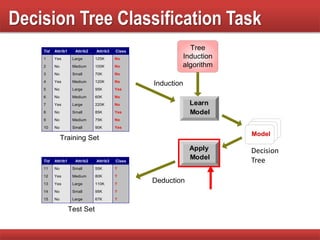
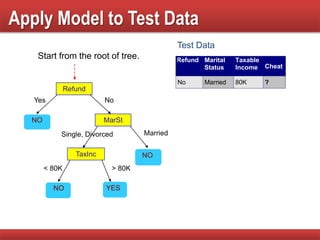
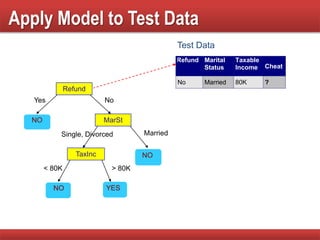
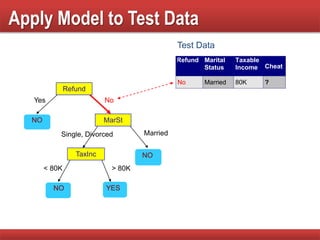


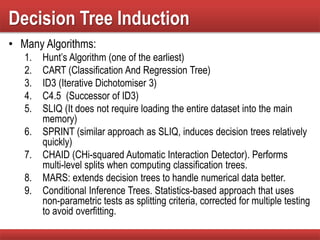
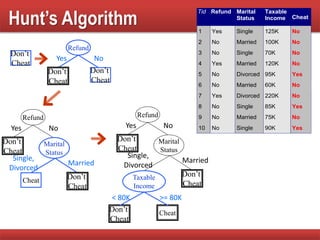
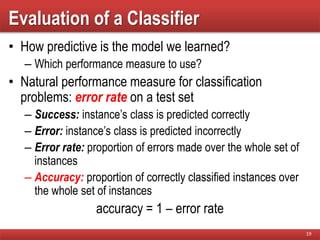
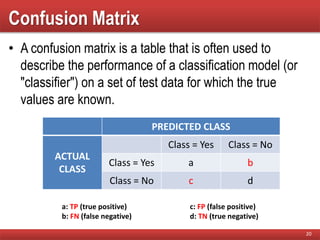
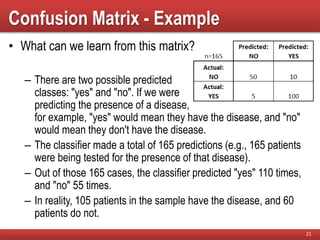

The document provides an overview of classification in data mining, detailing the process of creating models to assign classes to new records based on training data. It discusses various classification techniques such as decision trees, neural networks, and support vector machines, along with evaluation metrics like accuracy and confusion matrices. Examples illustrate the application of classification tasks, primarily focusing on how various algorithms, including Hunt's algorithm, function to build decision trees for predictive analysis.