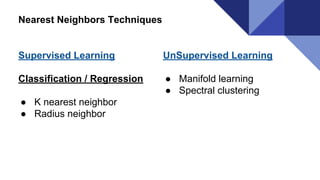
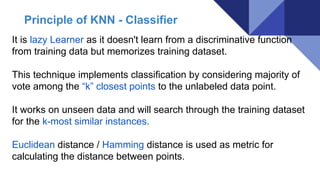
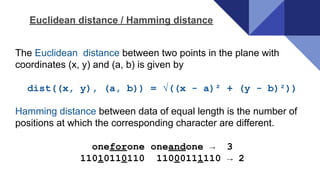
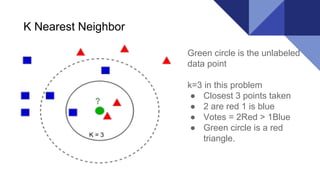
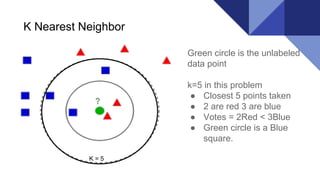
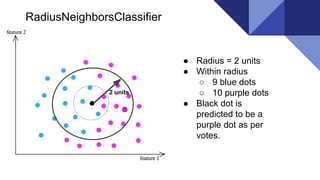
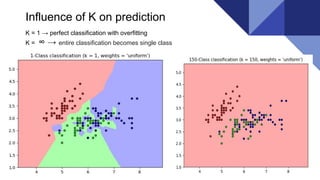
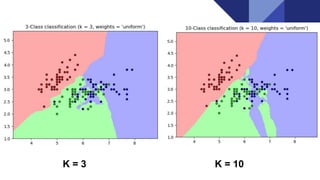
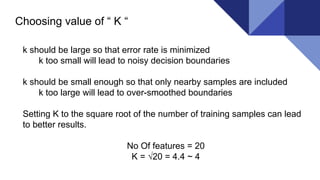
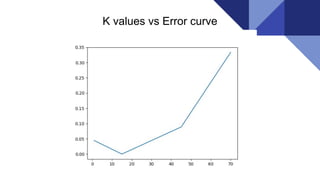
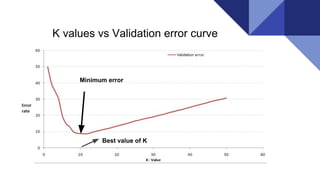
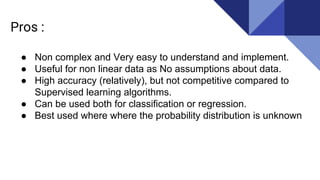
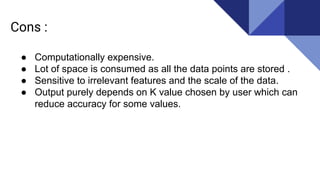
K - Nearest Neighbours
Classification , Regression
Khan
Introduction
KNN
K - Nearest neighbors is a
lazy learning instance based
classification( regression )
algorithm which is widely
implemented in both
supervised and unsupervised
learning techniques.
Nearest Neighbors Techniques
UnSupervised Learning
● Manifold learning
● Spectral clustering
Supervised Learning
Classification / Regression
● K nearest neighbor
● Radius neighbor
It is lazy Learner as it doesn't learn from a discriminative function
from training data but memorizes training dataset.
This technique implements classification by considering majority of
vote among the “k” closest points to the unlabeled data point.
It works on unseen data and will search through the training dataset
for the k-most similar instances.
Euclidean distance / Hamming distance is used as metric for
calculating the distance between points.
Principle of KNN - Classifier
The Euclidean distance between two points in the plane with
coordinates (x, y) and (a, b) is given by
dist((x, y), (a, b)) = √((x - a)² + (y - b)²))
Hamming distance between data of equal length is the number of
positions at which the corresponding character are different.
oneforone oneandone → 3
11010110110 11000111110 → 2
Euclidean distance / Hamming distance
K Nearest Neighbor
Green circle is the unlabeled
data point
k=3 in this problem
● Closest 3 points taken
● 2 are red 1 is blue
● Votes = 2Red > 1Blue
● Green circle is a red
triangle.K = 3
K Nearest Neighbor
Green circle is the unlabeled
data point
k=5 in this problem
● Closest 5 points taken
● 2 are red 3 are blue
● Votes = 2Red < 3Blue
● Green circle is a Blue
square.
K = 5
This implements learning based on the number of neighbors within
a fixed radius of each training point.
RadiusNeighborsClassifier can be a better choice For
high-dimensional parameter spaces
The radius floating point is provided by the user for taking the
Points into consideration.
This method becomes less effective due to “curse of
dimensionality”.
RadiusNeighborsClassifier
● Radius = 2 units
● Within radius
○ 9 blue dots
○ 10 purple dots
● Black dot is
predicted to be a
purple dot as per
votes.
2 units
Influence of K on prediction
K = 1 → perfect classification with overfitting
K = ∞ → entire classification becomes single class
K = 3 K = 10
Choosing value of “ K “
k should be large so that error rate is minimized
k too small will lead to noisy decision boundaries
k should be small enough so that only nearby samples are included
k too large will lead to over-smoothed boundaries
Setting K to the square root of the number of training samples can lead
to better results.
No Of features = 20
K = √20 = 4.4 ~ 4
K values vs Error curve
K values vs Validation error curve
Minimum error
Best value of K
Pros :
● Non complex and Very easy to understand and implement.
● Useful for non linear data as No assumptions about data.
● High accuracy (relatively), but not competitive compared to
Supervised learning algorithms.
● Can be used both for classification or regression.
● Best used where where the probability distribution is unknown
Cons :
● Computationally expensive.
● Lot of space is consumed as all the data points are stored .
● Sensitive to irrelevant features and the scale of the data.
● Output purely depends on K value chosen by user which can
reduce accuracy for some values.
Applications :
1. Recommender Systems
2. Medicine
3. Finance
4. Text mining
5. Agriculture
Let’s code now
Data used : Iris from Sklearn
Plots : Matplotlib
K values taken - 1, 3 , 10 , 150
File : knnKpara.py
Link to code : Click here for code
Thank You

K - Nearest neighbor ( KNN )

  • 1.
    K - NearestNeighbours Classification , Regression Khan
  • 2.
    Introduction KNN K - Nearestneighbors is a lazy learning instance based classification( regression ) algorithm which is widely implemented in both supervised and unsupervised learning techniques.
  • 3.
    Nearest Neighbors Techniques UnSupervisedLearning ● Manifold learning ● Spectral clustering Supervised Learning Classification / Regression ● K nearest neighbor ● Radius neighbor
  • 4.
    It is lazyLearner as it doesn't learn from a discriminative function from training data but memorizes training dataset. This technique implements classification by considering majority of vote among the “k” closest points to the unlabeled data point. It works on unseen data and will search through the training dataset for the k-most similar instances. Euclidean distance / Hamming distance is used as metric for calculating the distance between points. Principle of KNN - Classifier
  • 5.
    The Euclidean distancebetween two points in the plane with coordinates (x, y) and (a, b) is given by dist((x, y), (a, b)) = √((x - a)² + (y - b)²)) Hamming distance between data of equal length is the number of positions at which the corresponding character are different. oneforone oneandone → 3 11010110110 11000111110 → 2 Euclidean distance / Hamming distance
  • 6.
    K Nearest Neighbor Greencircle is the unlabeled data point k=3 in this problem ● Closest 3 points taken ● 2 are red 1 is blue ● Votes = 2Red > 1Blue ● Green circle is a red triangle.K = 3
  • 7.
    K Nearest Neighbor Greencircle is the unlabeled data point k=5 in this problem ● Closest 5 points taken ● 2 are red 3 are blue ● Votes = 2Red < 3Blue ● Green circle is a Blue square. K = 5
  • 8.
    This implements learningbased on the number of neighbors within a fixed radius of each training point. RadiusNeighborsClassifier can be a better choice For high-dimensional parameter spaces The radius floating point is provided by the user for taking the Points into consideration. This method becomes less effective due to “curse of dimensionality”. RadiusNeighborsClassifier
  • 9.
    RadiusNeighborsClassifier ● Radius =2 units ● Within radius ○ 9 blue dots ○ 10 purple dots ● Black dot is predicted to be a purple dot as per votes. 2 units
  • 10.
    Influence of Kon prediction K = 1 → perfect classification with overfitting K = ∞ → entire classification becomes single class
  • 11.
    K = 3K = 10
  • 12.
    Choosing value of“ K “ k should be large so that error rate is minimized k too small will lead to noisy decision boundaries k should be small enough so that only nearby samples are included k too large will lead to over-smoothed boundaries Setting K to the square root of the number of training samples can lead to better results. No Of features = 20 K = √20 = 4.4 ~ 4
  • 13.
    K values vsError curve
  • 14.
    K values vsValidation error curve Minimum error Best value of K
  • 15.
    Pros : ● Noncomplex and Very easy to understand and implement. ● Useful for non linear data as No assumptions about data. ● High accuracy (relatively), but not competitive compared to Supervised learning algorithms. ● Can be used both for classification or regression. ● Best used where where the probability distribution is unknown
  • 16.
    Cons : ● Computationallyexpensive. ● Lot of space is consumed as all the data points are stored . ● Sensitive to irrelevant features and the scale of the data. ● Output purely depends on K value chosen by user which can reduce accuracy for some values.
  • 17.
    Applications : 1. RecommenderSystems 2. Medicine 3. Finance 4. Text mining 5. Agriculture
  • 18.
    Let’s code now Dataused : Iris from Sklearn Plots : Matplotlib K values taken - 1, 3 , 10 , 150 File : knnKpara.py Link to code : Click here for code
  • 19.