Downloaded 187 times

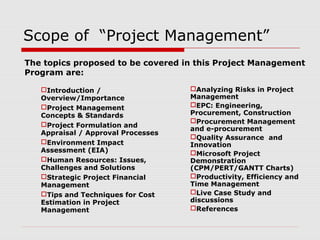
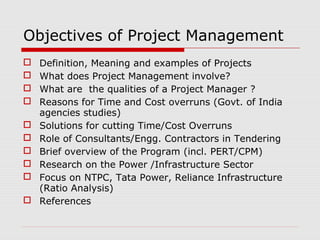
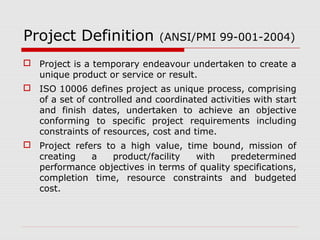
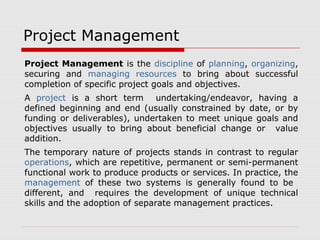


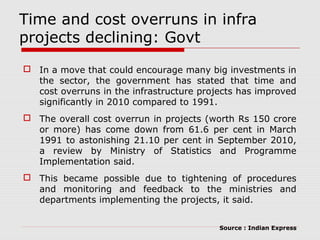
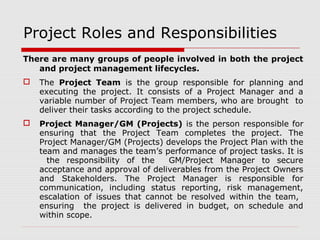
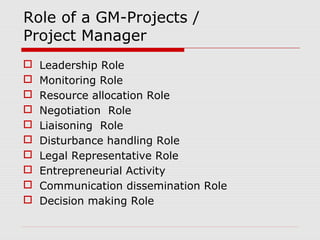

This document outlines the scope and content of an innovative project management program for working professionals. The program will cover topics such as project concepts and standards, formulation and approval processes, risk analysis, quality assurance, and case studies. It will demonstrate the use of tools like CPM, PERT and Gantt charts for project scheduling. The objectives are to define what constitutes a project, explain the project manager's role, and analyze reasons for cost and time overruns in government projects in India. Successful project management requires experienced people, well-defined processes and organizational structure.