Download to read offline

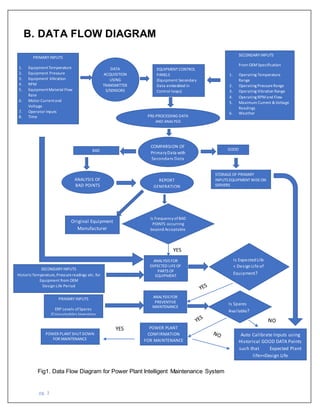
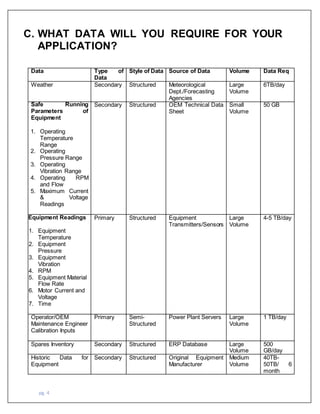


This document proposes a Power Plant Intelligent Maintenance System to analyze sensor data from power plants to predict equipment failures and recommend preventative maintenance. It will ingest structured data like temperature readings from sensors as well as weather data through APIs. The data will be stored in Google Cloud and analyzed with Apache Hadoop. This will help reduce power plant breakdowns and save costs from forced shutdowns. The estimated budget is $5.47 million per year per plant.


![제 23회 보아즈(BOAZ) 빅데이터 컨퍼런스 - [MBOAX] : ABSA를 활용한 소비자 반응 분석 기반 운영 효율화 대시보드 설계](https://cdn.slidesharecdn.com/ss_thumbnails/3-1boaz23rdconferencemboax-260203102709-9d519923-thumbnail.jpg?width=640&height=640&fit=bounds)


