Download to read offline

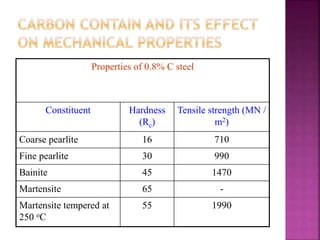
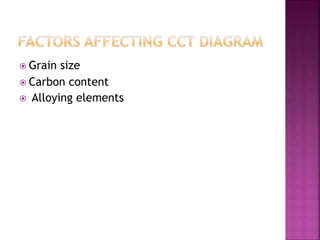


There are two types of CCT diagrams that plot the start, fraction, and finish of transformation temperatures against transformation time or cooling rate. CCT diagrams measure the extent of transformation as a function of time for continuously decreasing temperature, as materials are usually cooled continuously. The transformations are delayed compared to isothermal curves, shifting them to longer times and lower temperatures. CCT diagrams differ from TTT diagrams in that continuous cooling prevents the formation of bainite, resulting in pearlite formation instead. Properties like hardness and strength depend on the formed constituent, with martensite being the hardest and strongest. Factors that affect the CCT curve include grain size, carbon content, and alloying elements.