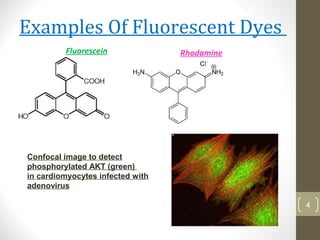
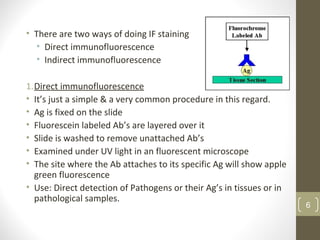
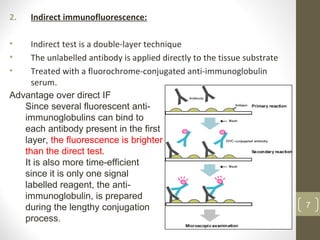
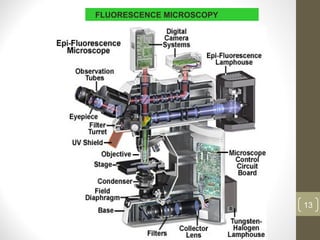
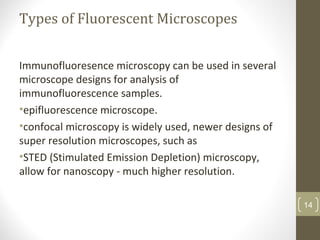
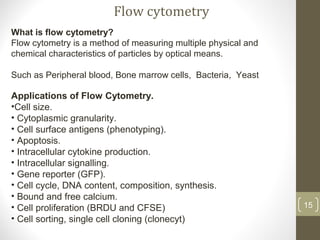
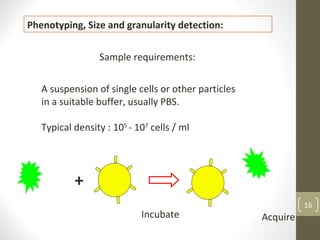
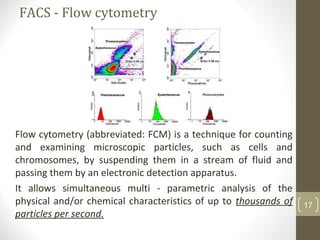
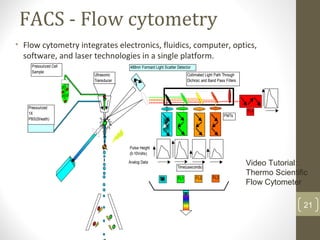
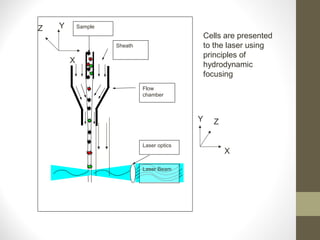
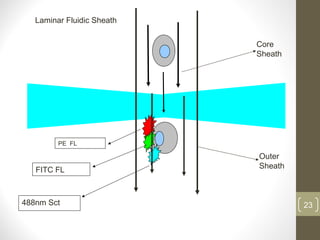
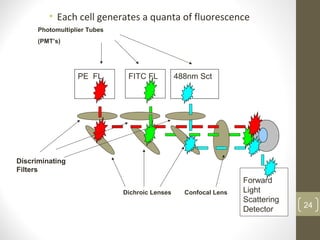
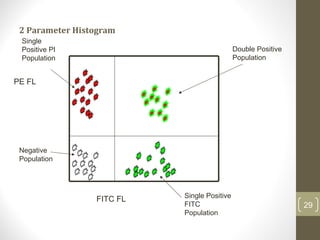
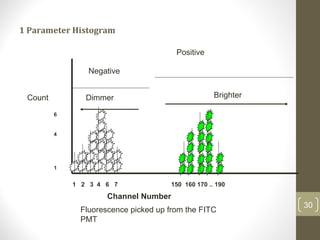
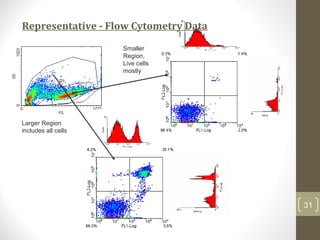
Immunofluorescence
and Fluorescence
microscopy
Immunofluorescence
• Immunofluorescence : Immunofluorescence is a powerful
technique that utilizes fluorescent-labeled antibodies to
detect specific target antigens..
 Fluorescein is a dye which emits greenish fluorescence under
UV light. It can be tagged to immunoglobulin molecules.
• This technique is sometimes used to make viral plaques more
readily visible to the human eye.
• Immunofluorescent labeled tissue sections are studied using a
fluorescence microscope. 2
• Immunofluorescence (IF) microscopy is a particularly robust and broadly
applicable method generally used by researchers to assess both the
localization and endogenous expression levels of proteins of interest.
• Immunofluorescence microscopy is a widely used example of
immunostaining and is a form of immunohistochemistry based on the use
of fluorophores to visualize the location of bound antibodies.
• The effective application of this method comprises several considerations,
including the nature of the antigen, specificity and sensitivity of the
primary antibody, properties of the fluorescent label, permeabilization
and fixation technique of the sample, and fluorescence imaging of the
cell.
• Immunofluorescence can be used on tissue sections, cultured cells or
individual cells that are fixed by a variety of methods. Antibodies can be
used in this method to analyze the distribution of proteins, glycoproteins
and other antigen targets including small biological and non-biological
molecules.
3
Examples Of Fluorescent Dyes
Fluorescein Rhodamine
4
Confocal image to detect
phosphorylated AKT (green)
in cardiomyocytes infected with
adenovirus
5
• There are two ways of doing IF staining
• Direct immunofluorescence
• Indirect immunofluorescence
1.Direct immunofluorescence
• It’s just a simple & a very common procedure in this regard.
• Ag is fixed on the slide
• Fluorescein labeled Ab’s are layered over it
• Slide is washed to remove unattached Ab’s
• Examined under UV light in an fluorescent microscope
• The site where the Ab attaches to its specific Ag will show apple
green fluorescence
• Use: Direct detection of Pathogens or their Ag’s in tissues or in
pathological samples.
6
2. Indirect immunofluorescence:
• Indirect test is a double-layer technique
• The unlabelled antibody is applied directly to the tissue substrate
• Treated with a fluorochrome-conjugated anti-immunoglobulin
serum.
7
Advantage over direct IF
Since several fluorescent anti-
immunoglobulins can bind to
each antibody present in the first
layer, the fluorescence is brighter
than the direct test.
It is also more time-efficient
since it is only one signal
labelled reagent, the anti-
immunoglobulin, is prepared
during the lengthy conjugation
process.
What Immunoflouroscence Does
Immunoflourescence is a Microscopic-based technique, used clinically to
diagnose certain cutaneous diseases ( e.g; Lyme Disease) by the
detection of AG:AB Complexes.
 Techniques including DIF, IDIF & Salt-split Skin are utilized depending on
clinical scenario.
 DIF is performed on patient’s skin using flourophore-labeled antibodies
that directly bind to pathogenic autoantibody-antigen complexes in the
skin.
• IDIF techniques are used in Dermatology primarily to detect circulating
pathogenic autoantibodies.
LIMITATIONS
• Fluorescence signals depend on the quality & Concentration of
antibodies, proper handling of specimen & detection with appropriate
secondary antibodies.
8
Part 1: Tissue preparation
1. Fixation
Fresh unfixed, fixed, or formalin fixation and paraffin embedding
2. Sectioning
3. Whole Mount Preparation
Part 2: pretreatment
1. Antigen retrieval : Proteolytic enzyme method and Heat-induced method
2. Inhibition of endogenous tissue components: 3% H2O2, 0.01% avidin
3. Blocking of nonspecific sites : 10% normal serum
Part 3: staining
Make a selection based on the type of specimen, the primary antibody, the
degree of sensitivity and the processing time required. 9
Immunohistochemistry Protocol
• Same as a conventional light
microscope (CM) with added features
to enhance its capabilities.
• CM - visible light (400-700
nanometers)
• FM- higher intensity light source which
excites a fluorescent species in a
sample.
• This fluorescent species in turn emits a
lower energy light of a longer
wavelength that produces the
magnified image instead of the original
light source.
Fluorescence microscope
10
Fluorescence microscope
Applications
Imaging structural components of small specimens,
(cells)
viability studies on cell populations (alive or dead)
Imaging the genetic material within a cell (DNA and RNA)
Viewing specific cells within a larger population with
techniques such as FISH
11
Effect of time of exposure and photo bleaching
12
FLUORESCENCE MICROSCOPY
13
Types of Fluorescent Microscopes
Immunofluoresence microscopy can be used in several
microscope designs for analysis of
immunofluorescence samples.
•epifluorescence microscope.
•confocal microscopy is widely used, newer designs of
super resolution microscopes, such as
•STED (Stimulated Emission Depletion) microscopy,
allow for nanoscopy - much higher resolution.
14
What is flow cytometry?
Flow cytometry is a method of measuring multiple physical and
chemical characteristics of particles by optical means.
Such as Peripheral blood, Bone marrow cells, Bacteria, Yeast
Applications of Flow Cytometry.
•Cell size.
• Cytoplasmic granularity.
• Cell surface antigens (phenotyping).
• Apoptosis.
• Intracellular cytokine production.
• Intracellular signalling.
• Gene reporter (GFP).
• Cell cycle, DNA content, composition, synthesis.
• Bound and free calcium.
• Cell proliferation (BRDU and CFSE)
• Cell sorting, single cell cloning (clonecyt)
Flow cytometry
15
A suspension of single cells or other particles
in a suitable buffer, usually PBS.
Typical density : 105
- 107
cells / ml
+
Incubate Acquire
Phenotyping, Size and granularity detection:
Sample requirements:
16
FACS - Flow cytometry
Flow cytometry (abbreviated: FCM) is a technique for counting
and examining microscopic particles, such as cells and
chromosomes, by suspending them in a stream of fluid and
passing them by an electronic detection apparatus.
It allows simultaneous multi - parametric analysis of the
physical and/or chemical characteristics of up to thousands of
particles per second.
17
FACS - Flow cytometry
Fluorescence-activated cell sorting is a specialized type of
flow cytometry. It provides a method for sorting a
heterogeneous mixture of biological cells into two or more
containers, one cell at a time, based upon the specific light
scattering and fluorescent characteristics of each cell.
It is a useful scientific instrument, as it provides fast,
objective and quantitative recording of fluorescent signals
from individual cells as well as physical separation of cells
of particular interest.
FACS is a trademark of Becton Dickinson Immunocytometry
Systems (BDIS). All FACS instruments are BDIS systems, but
not all cytometers are FACS.
18
19
•The cell suspension is entrained in the center of a narrow,
rapidly flowing stream of liquid. The flow is arranged so that
there is a large separation between cells relative to their
diameter.
•A vibrating mechanism causes the stream of cells to break into
individual droplets. The system is adjusted so that there is a low
probability of more than one cell per droplet.
•Just before the stream breaks into droplets, the flow passes
through a fluorescence measuring station where the
fluorescent character of interest of each cell is measured.
FACS – Working principle
• An electrical charging ring is placed just at the point where
the stream breaks into droplets. A charge is placed on the
ring based on the immediately prior fluorescence intensity
measurement, and the opposite charge is trapped on the
droplet as it breaks from the stream.
• The charged droplets then fall through an electrostatic
deflection system that diverts droplets into containers
based upon their charge.
• In some systems, the charge is applied directly to the
stream, and the droplet breaking off retains charge of the
same sign as the stream. The stream is then returned to
neutral after the droplet breaks off. 20
FACS – Working principle
FACS - Flow cytometry
• Flow cytometry integrates electronics, fluidics, computer, optics,
software, and laser technologies in a single platform.
21
Ultrasonic
Transducer
488nm Formard Light Scatter Detector
Collimated Light Path Through
Dichroic and Band Pass Filters
SS FL2FL1
FL4
FL3
Pulse Height
(0-10Volts)
Time(useconds)
Pressurized
1X
PBS(Sheath)
Pressurized Cell
Sample
Analog Data
PMTs
Video Tutorial:
Thermo Scientific
Flow Cytometer
Laser optics
Laser Beam
Flow
chamber
Sheath
SampleY
X
Z
Y Z
X
Cells are presented
to the laser using
principles of
hydrodynamic
focusing
23
PE FL
FITC FL
488nm Sct
Laminar Fluidic Sheath
Core
Sheath
Outer
Sheath
• Each cell generates a quanta of fluorescence
24
PE FL FITC FL 488nm Sct
Confocal LensDichroic Lenses
Photomultiplier Tubes
(PMT’s)
Discriminating
Filters
Forward
Light
Scattering
Detector
Negative cells are also detected
25
PE FL FITC FL 488nm Sct
Confocal Lens
Dichroic Lenses
Forward
Light
Scatter
26
Flow
Cell
Laser
Beam
FS
Sensor
Fluorescence
Pickup Lens
SS
Sensor
FL1
Sensor
525BP
FL2
Sensor
575BP
FL3
Sensor
620BP
FL4
Sensor
675BP
488DL
488BK
550DL
600DL
645DL
Optical Bench
Schematic
From Fluorescence to Computer Display
• Individual cell fluorescence quanta is picked up by the
various detectors(PMT’s-photo multiplier tubes as
detectors).
• PMT’s convert light into electrical pulses.
• These electrical signals are amplified and digitized using
Analog to Digital Converters (ADC’s).
• Each event is designated a channel number (based on the
fluorescence intensity as originally detected by the PMT’s)
on a 1 Parameter Histogram or 2 Parameter Histogram.
• All events are individually correlated for all the parameters
collected.
27
Light Scattering, 2 Parameter Histogram
28Forward Light Scatter (FLS)
90 degree
Light Scatter
Bigger
More
Granular
Live Cells
Bigger
Cells
Dead
Cells
Apoptotic
Cells
X Axis
Y Axis
2 Parameter Histogram
29
FITC FL
PE FL
Negative
Population
Single Positive
FITC
Population
Single
Positive PI
Population
Double Positive
Population
1 Parameter Histogram
30
1 2 3 4 6 7 150 160 170 .. 190
Channel Number
Positive
Negative
BrighterDimmerCount
1
4
6
Fluorescence picked up from the FITC
PMT
Representative - Flow Cytometry Data
31
Smaller
Region,
Live cells
mostly
Larger Region
includes all cells

Immunofluorescence and fluoroscence microscopy

  • 1.
  • 2.
    Immunofluorescence • Immunofluorescence :Immunofluorescence is a powerful technique that utilizes fluorescent-labeled antibodies to detect specific target antigens..  Fluorescein is a dye which emits greenish fluorescence under UV light. It can be tagged to immunoglobulin molecules. • This technique is sometimes used to make viral plaques more readily visible to the human eye. • Immunofluorescent labeled tissue sections are studied using a fluorescence microscope. 2
  • 3.
    • Immunofluorescence (IF)microscopy is a particularly robust and broadly applicable method generally used by researchers to assess both the localization and endogenous expression levels of proteins of interest. • Immunofluorescence microscopy is a widely used example of immunostaining and is a form of immunohistochemistry based on the use of fluorophores to visualize the location of bound antibodies. • The effective application of this method comprises several considerations, including the nature of the antigen, specificity and sensitivity of the primary antibody, properties of the fluorescent label, permeabilization and fixation technique of the sample, and fluorescence imaging of the cell. • Immunofluorescence can be used on tissue sections, cultured cells or individual cells that are fixed by a variety of methods. Antibodies can be used in this method to analyze the distribution of proteins, glycoproteins and other antigen targets including small biological and non-biological molecules. 3
  • 4.
    Examples Of FluorescentDyes Fluorescein Rhodamine 4 Confocal image to detect phosphorylated AKT (green) in cardiomyocytes infected with adenovirus
  • 5.
  • 6.
    • There aretwo ways of doing IF staining • Direct immunofluorescence • Indirect immunofluorescence 1.Direct immunofluorescence • It’s just a simple & a very common procedure in this regard. • Ag is fixed on the slide • Fluorescein labeled Ab’s are layered over it • Slide is washed to remove unattached Ab’s • Examined under UV light in an fluorescent microscope • The site where the Ab attaches to its specific Ag will show apple green fluorescence • Use: Direct detection of Pathogens or their Ag’s in tissues or in pathological samples. 6
  • 7.
    2. Indirect immunofluorescence: •Indirect test is a double-layer technique • The unlabelled antibody is applied directly to the tissue substrate • Treated with a fluorochrome-conjugated anti-immunoglobulin serum. 7 Advantage over direct IF Since several fluorescent anti- immunoglobulins can bind to each antibody present in the first layer, the fluorescence is brighter than the direct test. It is also more time-efficient since it is only one signal labelled reagent, the anti- immunoglobulin, is prepared during the lengthy conjugation process.
  • 8.
    What Immunoflouroscence Does Immunoflourescenceis a Microscopic-based technique, used clinically to diagnose certain cutaneous diseases ( e.g; Lyme Disease) by the detection of AG:AB Complexes.  Techniques including DIF, IDIF & Salt-split Skin are utilized depending on clinical scenario.  DIF is performed on patient’s skin using flourophore-labeled antibodies that directly bind to pathogenic autoantibody-antigen complexes in the skin. • IDIF techniques are used in Dermatology primarily to detect circulating pathogenic autoantibodies. LIMITATIONS • Fluorescence signals depend on the quality & Concentration of antibodies, proper handling of specimen & detection with appropriate secondary antibodies. 8
  • 9.
    Part 1: Tissuepreparation 1. Fixation Fresh unfixed, fixed, or formalin fixation and paraffin embedding 2. Sectioning 3. Whole Mount Preparation Part 2: pretreatment 1. Antigen retrieval : Proteolytic enzyme method and Heat-induced method 2. Inhibition of endogenous tissue components: 3% H2O2, 0.01% avidin 3. Blocking of nonspecific sites : 10% normal serum Part 3: staining Make a selection based on the type of specimen, the primary antibody, the degree of sensitivity and the processing time required. 9 Immunohistochemistry Protocol
  • 10.
    • Same asa conventional light microscope (CM) with added features to enhance its capabilities. • CM - visible light (400-700 nanometers) • FM- higher intensity light source which excites a fluorescent species in a sample. • This fluorescent species in turn emits a lower energy light of a longer wavelength that produces the magnified image instead of the original light source. Fluorescence microscope 10
  • 11.
    Fluorescence microscope Applications Imaging structuralcomponents of small specimens, (cells) viability studies on cell populations (alive or dead) Imaging the genetic material within a cell (DNA and RNA) Viewing specific cells within a larger population with techniques such as FISH 11
  • 12.
    Effect of timeof exposure and photo bleaching 12
  • 13.
  • 14.
    Types of FluorescentMicroscopes Immunofluoresence microscopy can be used in several microscope designs for analysis of immunofluorescence samples. •epifluorescence microscope. •confocal microscopy is widely used, newer designs of super resolution microscopes, such as •STED (Stimulated Emission Depletion) microscopy, allow for nanoscopy - much higher resolution. 14
  • 15.
    What is flowcytometry? Flow cytometry is a method of measuring multiple physical and chemical characteristics of particles by optical means. Such as Peripheral blood, Bone marrow cells, Bacteria, Yeast Applications of Flow Cytometry. •Cell size. • Cytoplasmic granularity. • Cell surface antigens (phenotyping). • Apoptosis. • Intracellular cytokine production. • Intracellular signalling. • Gene reporter (GFP). • Cell cycle, DNA content, composition, synthesis. • Bound and free calcium. • Cell proliferation (BRDU and CFSE) • Cell sorting, single cell cloning (clonecyt) Flow cytometry 15
  • 16.
    A suspension ofsingle cells or other particles in a suitable buffer, usually PBS. Typical density : 105 - 107 cells / ml + Incubate Acquire Phenotyping, Size and granularity detection: Sample requirements: 16
  • 17.
    FACS - Flowcytometry Flow cytometry (abbreviated: FCM) is a technique for counting and examining microscopic particles, such as cells and chromosomes, by suspending them in a stream of fluid and passing them by an electronic detection apparatus. It allows simultaneous multi - parametric analysis of the physical and/or chemical characteristics of up to thousands of particles per second. 17
  • 18.
    FACS - Flowcytometry Fluorescence-activated cell sorting is a specialized type of flow cytometry. It provides a method for sorting a heterogeneous mixture of biological cells into two or more containers, one cell at a time, based upon the specific light scattering and fluorescent characteristics of each cell. It is a useful scientific instrument, as it provides fast, objective and quantitative recording of fluorescent signals from individual cells as well as physical separation of cells of particular interest. FACS is a trademark of Becton Dickinson Immunocytometry Systems (BDIS). All FACS instruments are BDIS systems, but not all cytometers are FACS. 18
  • 19.
    19 •The cell suspensionis entrained in the center of a narrow, rapidly flowing stream of liquid. The flow is arranged so that there is a large separation between cells relative to their diameter. •A vibrating mechanism causes the stream of cells to break into individual droplets. The system is adjusted so that there is a low probability of more than one cell per droplet. •Just before the stream breaks into droplets, the flow passes through a fluorescence measuring station where the fluorescent character of interest of each cell is measured. FACS – Working principle
  • 20.
    • An electricalcharging ring is placed just at the point where the stream breaks into droplets. A charge is placed on the ring based on the immediately prior fluorescence intensity measurement, and the opposite charge is trapped on the droplet as it breaks from the stream. • The charged droplets then fall through an electrostatic deflection system that diverts droplets into containers based upon their charge. • In some systems, the charge is applied directly to the stream, and the droplet breaking off retains charge of the same sign as the stream. The stream is then returned to neutral after the droplet breaks off. 20 FACS – Working principle
  • 21.
    FACS - Flowcytometry • Flow cytometry integrates electronics, fluidics, computer, optics, software, and laser technologies in a single platform. 21 Ultrasonic Transducer 488nm Formard Light Scatter Detector Collimated Light Path Through Dichroic and Band Pass Filters SS FL2FL1 FL4 FL3 Pulse Height (0-10Volts) Time(useconds) Pressurized 1X PBS(Sheath) Pressurized Cell Sample Analog Data PMTs Video Tutorial: Thermo Scientific Flow Cytometer
  • 22.
    Laser optics Laser Beam Flow chamber Sheath SampleY X Z YZ X Cells are presented to the laser using principles of hydrodynamic focusing
  • 23.
    23 PE FL FITC FL 488nmSct Laminar Fluidic Sheath Core Sheath Outer Sheath
  • 24.
    • Each cellgenerates a quanta of fluorescence 24 PE FL FITC FL 488nm Sct Confocal LensDichroic Lenses Photomultiplier Tubes (PMT’s) Discriminating Filters Forward Light Scattering Detector
  • 25.
    Negative cells arealso detected 25 PE FL FITC FL 488nm Sct Confocal Lens Dichroic Lenses Forward Light Scatter
  • 26.
  • 27.
    From Fluorescence toComputer Display • Individual cell fluorescence quanta is picked up by the various detectors(PMT’s-photo multiplier tubes as detectors). • PMT’s convert light into electrical pulses. • These electrical signals are amplified and digitized using Analog to Digital Converters (ADC’s). • Each event is designated a channel number (based on the fluorescence intensity as originally detected by the PMT’s) on a 1 Parameter Histogram or 2 Parameter Histogram. • All events are individually correlated for all the parameters collected. 27
  • 28.
    Light Scattering, 2Parameter Histogram 28Forward Light Scatter (FLS) 90 degree Light Scatter Bigger More Granular Live Cells Bigger Cells Dead Cells Apoptotic Cells X Axis Y Axis
  • 29.
    2 Parameter Histogram 29 FITCFL PE FL Negative Population Single Positive FITC Population Single Positive PI Population Double Positive Population
  • 30.
    1 Parameter Histogram 30 12 3 4 6 7 150 160 170 .. 190 Channel Number Positive Negative BrighterDimmerCount 1 4 6 Fluorescence picked up from the FITC PMT
  • 31.
    Representative - FlowCytometry Data 31 Smaller Region, Live cells mostly Larger Region includes all cells