Downloaded 1,438 times

![Writing Up Results
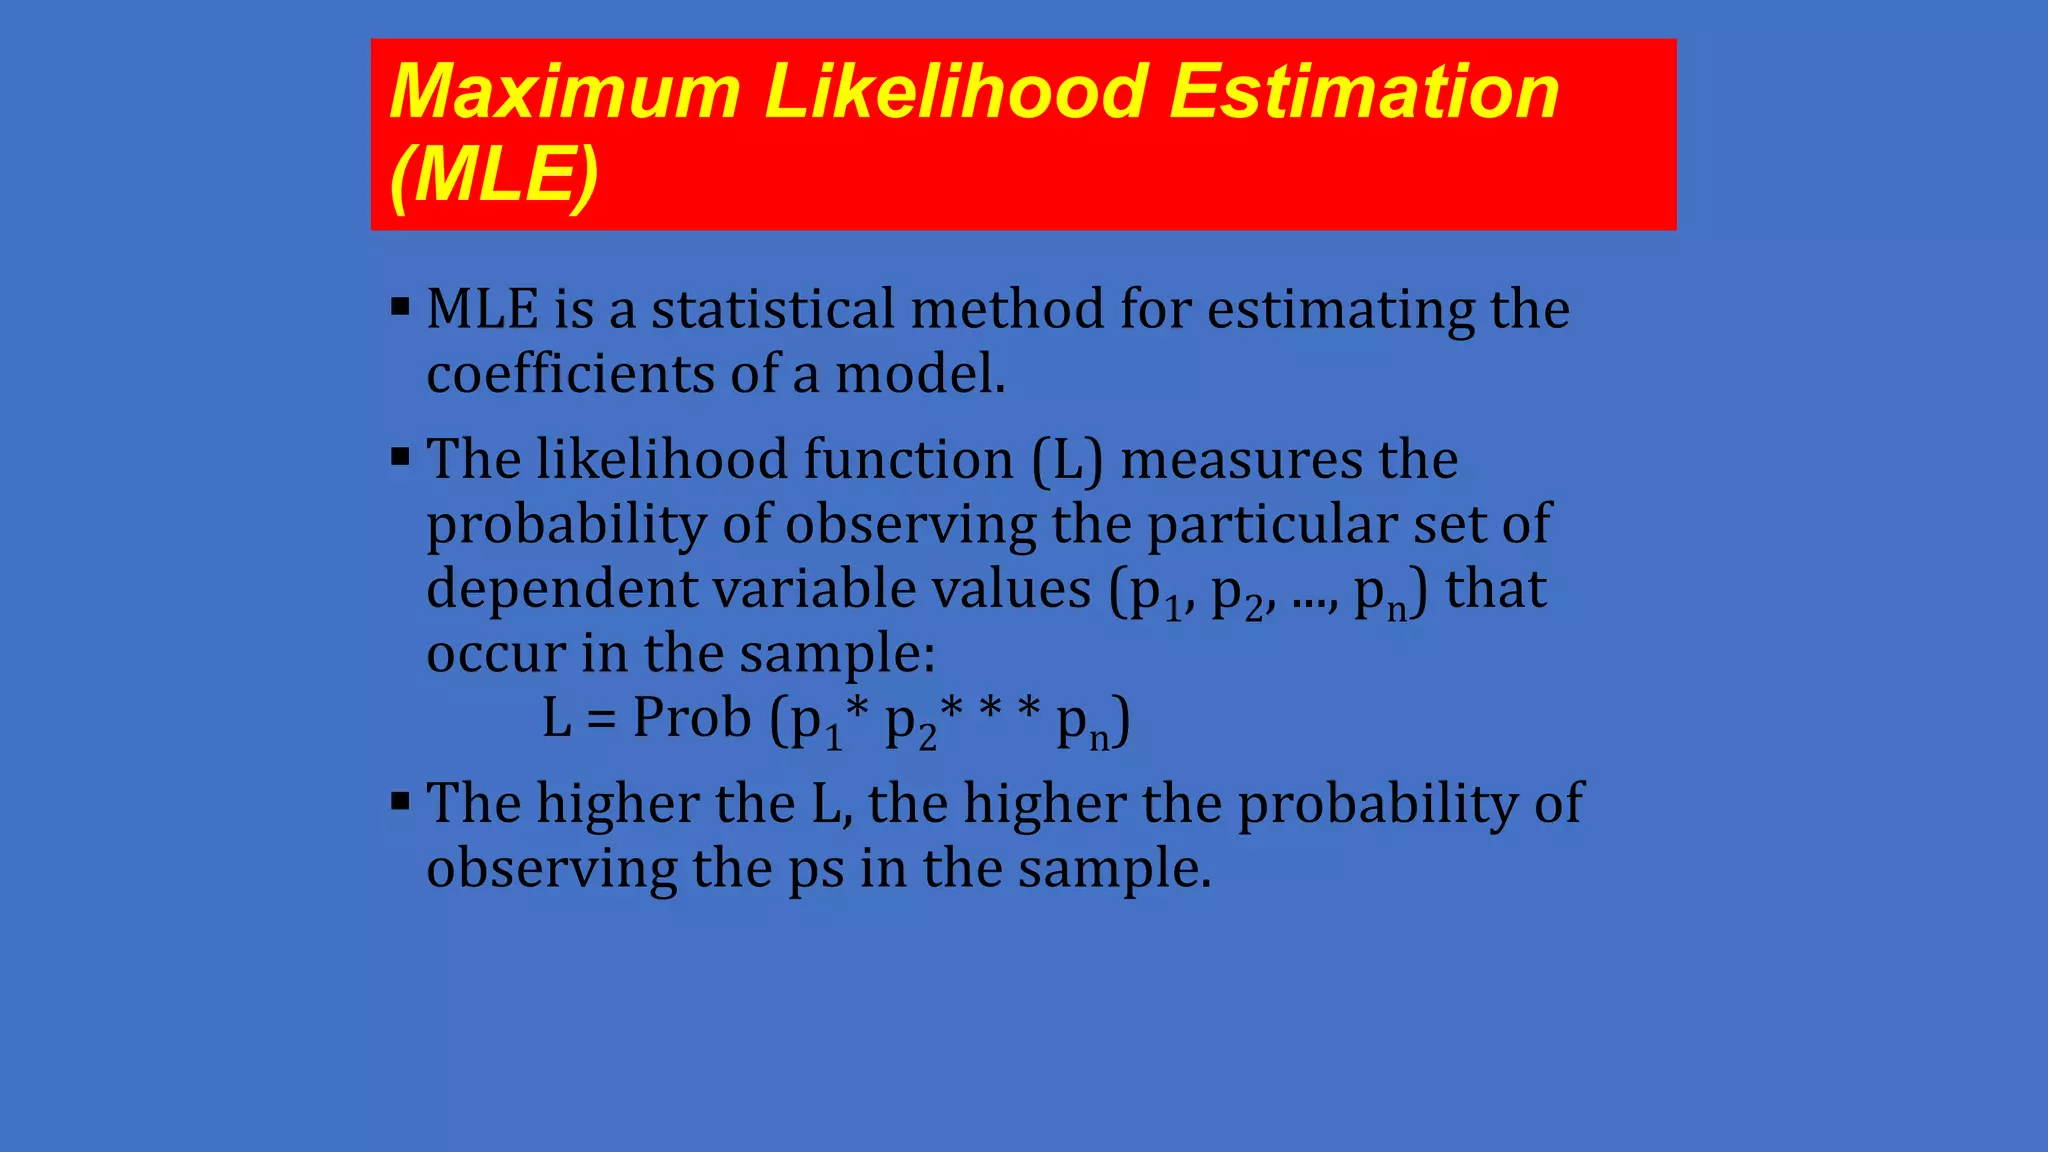
Present descriptive statistics in a table
Make it clear that the dependent variable is discrete (0, 1) and not
continuous and that you will use logistic regression.
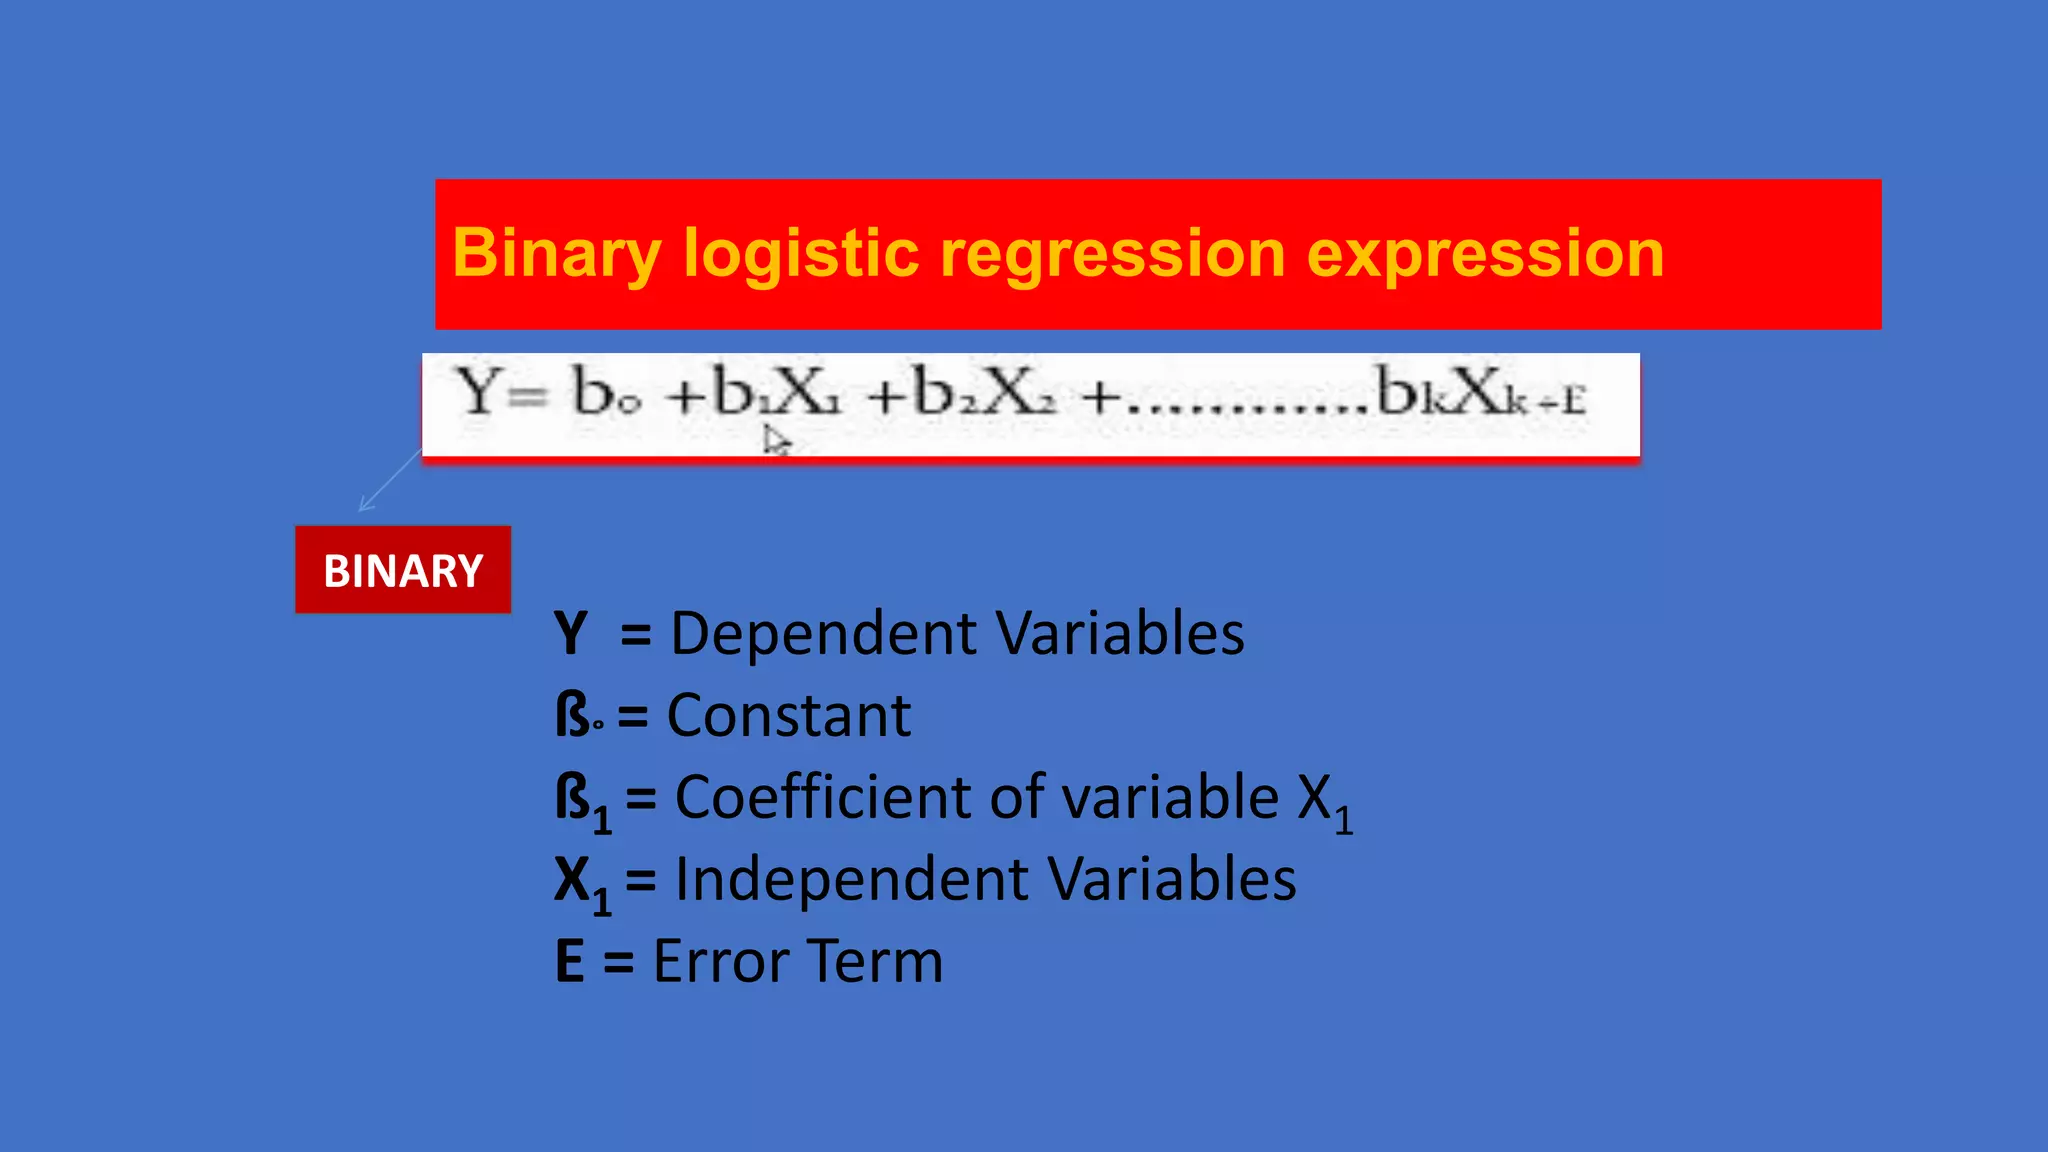
Logistic regression is a standard statistical procedure so you don't
(necessarily) need to write out the formula for it. You also (usually)
don't need to justify that you are using Logit instead of the LP model
or Probit (similar to Logit but based on the normal distribution [the
tails are less fat]).](https://image.slidesharecdn.com/logisticregression-131201155631-phpapp01/75/Logistic-regression-29-2048.jpg)


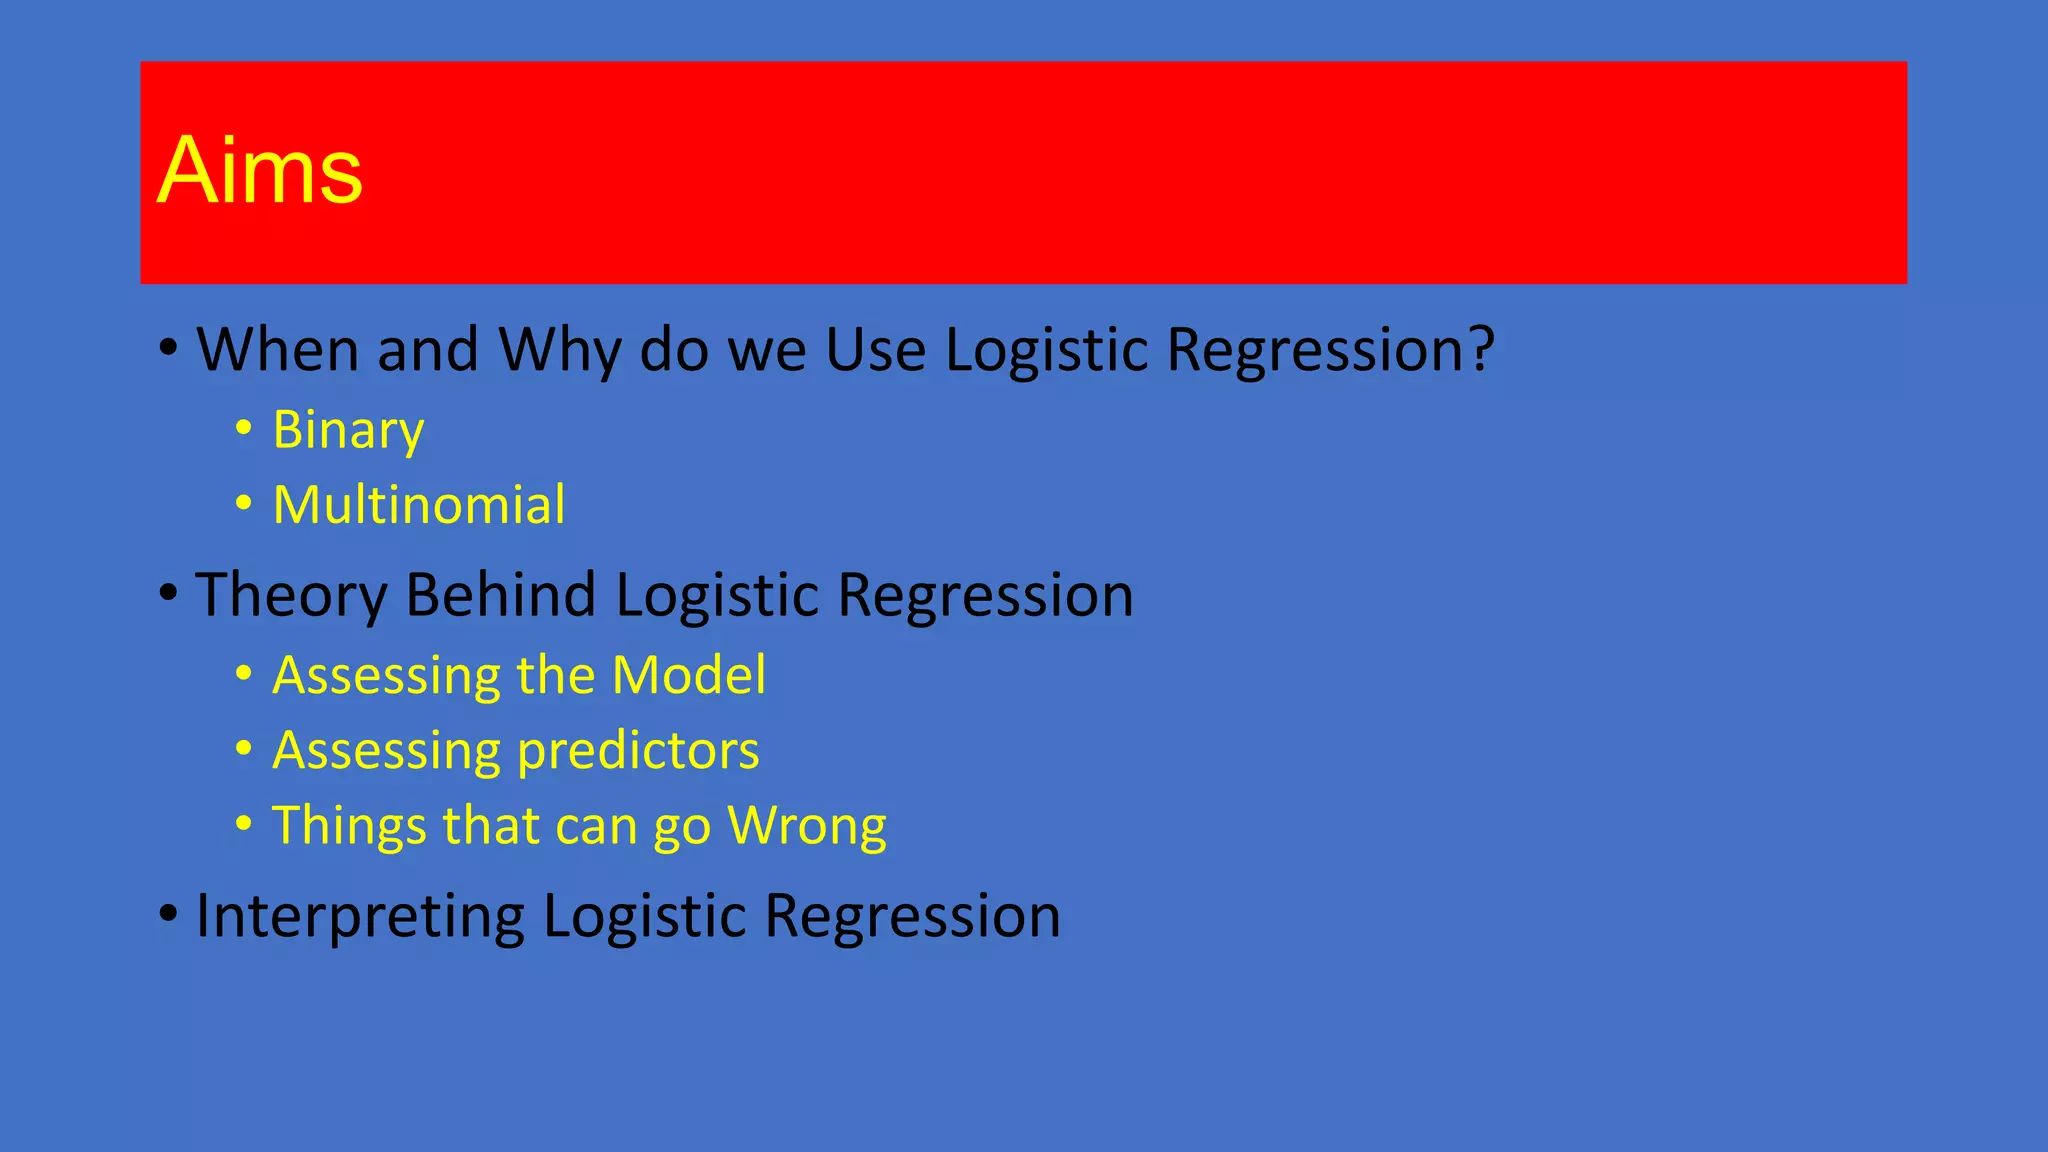
This document provides an overview of logistic regression, including when and why it is used, the theory behind it, and how to assess logistic regression models. Logistic regression predicts the probability of categorical outcomes given categorical or continuous predictor variables. It relaxes the normality and linearity assumptions of linear regression. The relationship between predictors and outcomes is modeled using an S-shaped logistic function. Model fit, predictors, and interpretations of coefficients are discussed.