Downloaded 468 times


![References
Harris M, Taylor G, Dunitz M. Medical Statistics Made Easy. London and New York: 3rd
edition; 2014.
Altman DG, Bland JM. Absence of evidence is not evidence of absence. BMJ
1995;311(7003):485.
Higgins JP, Thompson SG, Deeks JJ, Altman DG. Measuring inconsistency in meta-
analyses. BMJ 2003;327(7414):557-60.
Barratt A, Wyer PC, Hatala R, et al. Tips for learners of evidence-based medicine: 1.
Relative risk reduction, absolute risk reduction and number needed to treat. CMAJ
2004;171(4):353-8.
Cates C. P values and confidence intervals (Update Article 2005). [Full text
(http://www.nntonline.net/pvalues-and-confidence-intervals/)]
Guyatt G, Jaeschke R, Heddle N, Cook D, Shannon H, Walter S. Basic statistics for
clinicians: 1. Hypothesis testing. CMAJ 1995;152(1):27-32.](https://image.slidesharecdn.com/understandingclinicaltrialsstatestics-180109183336/85/Understanding-clinical-trial-s-statistics-36-320.jpg)


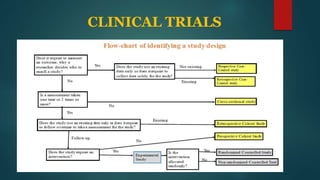
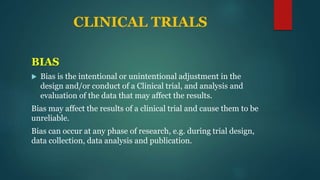
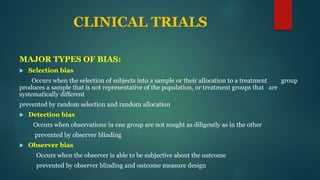
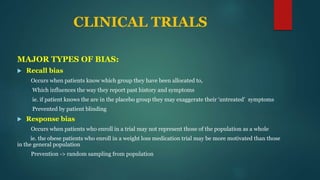
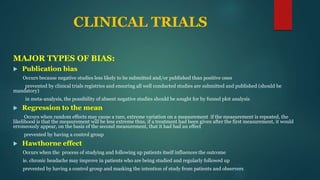
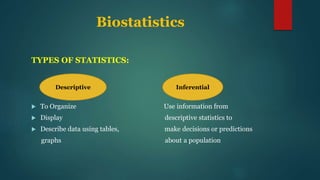
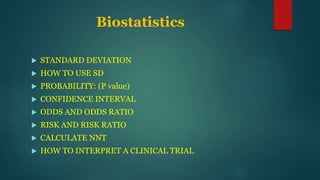
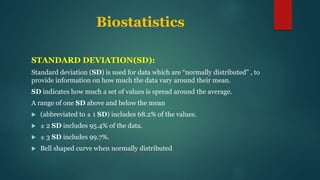
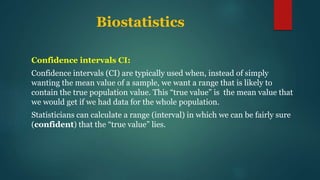
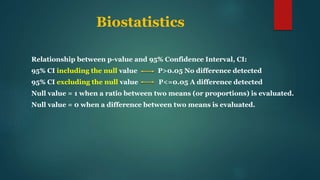
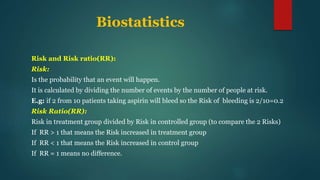
This document provides an overview of clinical trials and statistics. It discusses key concepts like randomized controlled trials, bias, standard deviation, p-values, confidence intervals, risk, odds ratios, and numbers needed to treat. The objectives are to help understand how to interpret clinical trial results and appreciate statistically significant versus clinically meaningful differences. Understanding basic statistics is important for critically evaluating the medical literature and making evidence-based clinical decisions.