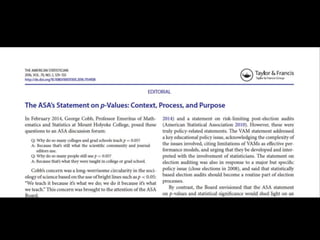
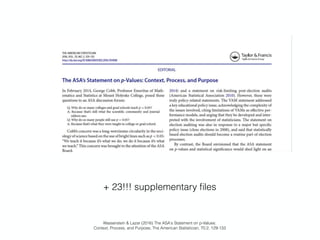
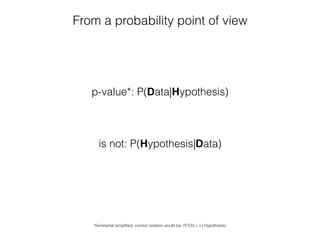
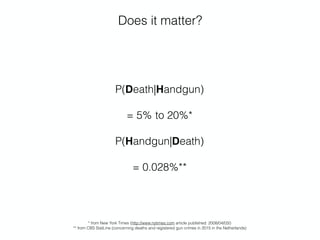
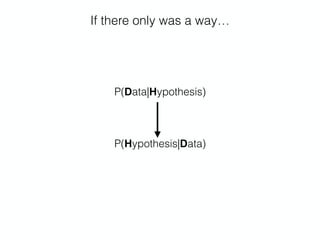
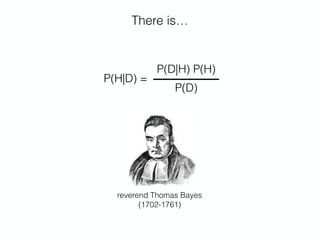
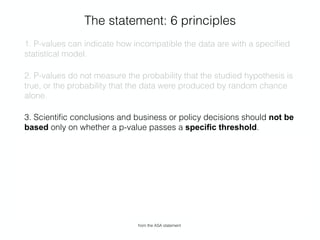
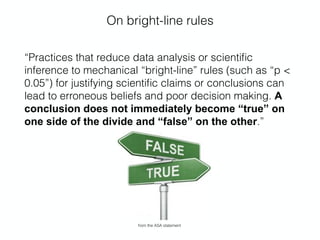
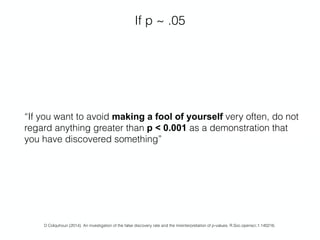
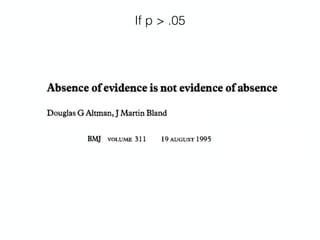
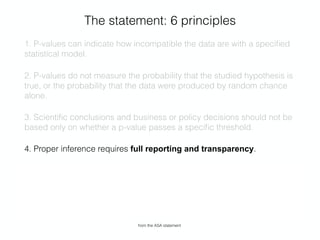
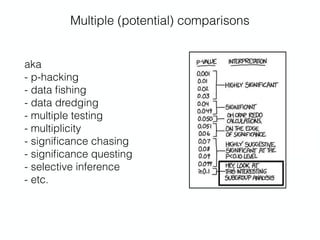
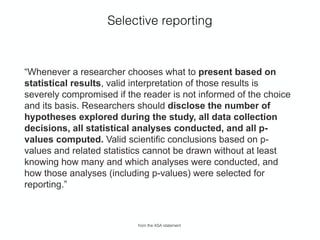
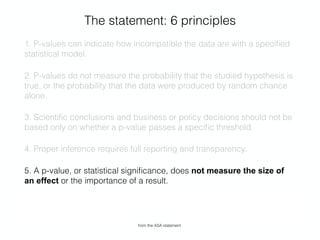
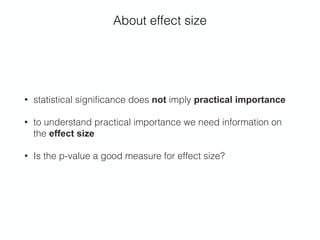
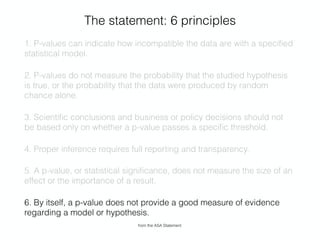
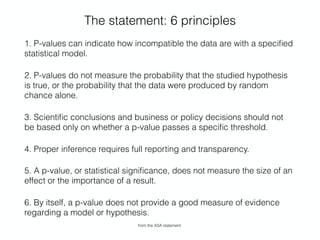
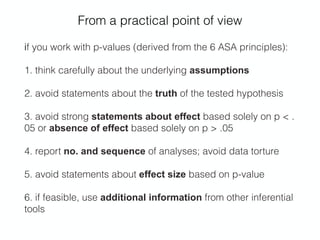
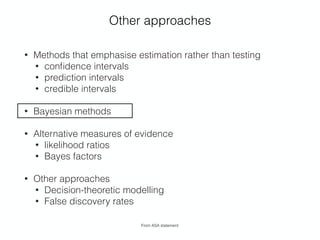
These slides were presented on November 22 2016 during the Annual Julius Symposium, organised by the Julius Center for Health Sciences and Primary Care, University Medical Hospital Utrecht.
Only a few months ago, the American Statistical Association authoritatively issued an official statement on significance and p-values (American Statistician, 2016, 70:2, 129-133), claiming that the p-value is: “commonly misused and misinterpreted.”
In this presentation I focus on the principles of the ASA statement.
When you perform a hypothesis test in statistics, a p-value helps you determine the significance of your results. ... The p-value is a number between 0 and 1 and interpreted in the following way: A small p-value (typically ≤ 0.05) indicates strong evidence against the null hypothesis, so you reject the null hypothesis.
Please Subscribe to this Channel for more solutions and lectures
http://www.youtube.com/onlineteaching
Chapter 8: Hypothesis Testing
8.4: Testing a Claim About a Standard Deviation or Variance
The test used to ascertain whether the difference between estimator & parameter or between two estimator are real or due to chance are called test of hypothesis.
T-test.
Chi-square (휒^2)- test.
F-Test.
ANOVA.
Statistical Data Analysis | Data Analysis | Statistics Services | Data Collec...Stats Statswork
The present article helps the USA, the UK and the Australian students pursuing their business and marketing postgraduate degree to identify right topic in the area of marketing in business. These topics are researched in-depth at the University of Columbia, brandies, Coventry, Idaho, and many more. Stats work offers UK Dissertation stats work Topics Services in business. When you Order stats work Dissertation Services at Tutors India, we promise you the following – Plagiarism free, Always on Time, outstanding customer support, written to Standard, Unlimited Revisions support and High-quality Subject Matter Experts.
Contact Us:
Website: www.statswork.com
Email: info@statswork.com
UnitedKingdom: +44-1143520021
India: +91-4448137070
WhatsApp: +91-8754446690
Chapter 6 part2-Introduction to Inference-Tests of Significance, Stating Hyp...nszakir
Mathematics, Statistics, Introduction to Inference, Tests of Significance, The Reasoning of Tests of Significance, Stating Hypotheses, Test Statistics, P-values, Statistical Significance, Test for a Population Mean, Two-Sided Significance Tests and Confidence Intervals
A non technical overview of sample size calculation and why it is necessary with some brief examples of how to approach the problem and why it is useful to actually think of these calculations.
Overviews non-parametric and parametric approaches to (bivariate) linear correlation. See also: http://en.wikiversity.org/wiki/Survey_research_and_design_in_psychology/Lectures/Correlation
Statistical tests of significance and Student`s T-TestVasundhraKakkar
Statistical tests of significance is explained along with steps involve in Statistical tests of significance and types of significance test are also mentioned. Student`s T-Test is explained
"The Statistical Replication Crisis: Paradoxes and Scapegoats”jemille6
D. G. Mayo LSE Popper talk, May 10, 2016.
Abstract: Mounting failures of replication in the social and biological sciences give a practical spin to statistical foundations in the form of the question: How can we attain reliability when Big Data methods make illicit cherry-picking and significance seeking so easy? Researchers, professional societies, and journals are increasingly getting serious about methodological reforms to restore scientific integrity – some are quite welcome (e.g., preregistration), while others are quite radical. Recently, the American Statistical Association convened members from differing tribes of frequentists, Bayesians, and likelihoodists to codify misuses of P-values. Largely overlooked are the philosophical presuppositions of both criticisms and proposed reforms. Paradoxically, alternative replacement methods may enable rather than reveal illicit inferences due to cherry-picking, multiple testing, and other biasing selection effects. Popular appeals to “diagnostic testing” that aim to improve replication rates may (unintentionally) permit the howlers and cookbook statistics we are at pains to root out. Without a better understanding of the philosophical issues, we can expect the latest reforms to fail.
Statistical skepticism: How to use significance tests effectively jemille6
Prof. D. Mayo, presentation Oct. 12, 2017 at the ASA Symposium on Statistical Inference : “A World Beyond p < .05” in the session: “What are the best uses for P-values?“
Slides given for Deborah G. Mayo talk at Minnesota Center for Philosophy of Science at University of Minnesota on the ASA 2016 statement on P-values and Error Statistics
Controversy Over the Significance Test Controversyjemille6
Deborah Mayo (Professor of Philosophy, Virginia Tech, Blacksburg, Virginia) in PSA 2016 Symposium: Philosophy of Statistics in the Age of Big Data and Replication Crises
Dichotomania and other challenges for the collaborating biostatisticianLaure Wynants
Conference presentation at ISCB 41 in the session
"Biostatistical inference in practice: moving beyond false
dichotomies"
A comment in Nature, signed by over 800 researchers, called for the scientific community to “retire statistical significance”. The responses included a call to halt the use of the term „statistically significant”, and changes in journal’s author guidelines. The leading discourse among statisticians is that inadequate statistical training of clinical researchers and publishing practices are to blame for the misuse of statistical testing. In this presentation, we search our collective conscience by reviewing ethical guidelines for statisticians in light of the p-value crisis, examine what this implies for us when conducting analyses in collaborative work and teaching, and whether the ATOM (accept uncertainty; be thoughtful, open and modest) principles can guide us.
The ASA president Task Force Statement on Statistical Significance and Replic...jemille6
Yoav Benjamini's slides "The ASA president Task Force Statement on Statistical Significance and Replicability” for Special Session of the (remote) Phil Stat Forum: “Statistical Significance Test Anxiety” on 11 January 2022
Most medical research around the world is
empirical and uses data to derive a result. Many
researchers substantially depend on statistical
evidence such as P values to decide that an effect
of a specific factor is present or not. Now, there is a
storm around the world, and the P value, particularly
the resulting statistical significance, has been not
just questioned but also sought to be abolished
altogether. Abandoning statistical significance has
the potential to change research in empirical sciences
such as medicine forever. This article discusses the
arguments in favour and against this contention and
pleads that medical scientists present a balanced
picture in their articles where P values have a role
but not as dominant as is currently seen in most
publications. The following discussion would also
make medical researchers aware of this raging
controversy, help them to understand the involved
nuances and equip them to prepare a better report of
their research
Get ready to face Data Science interviews with this set of Statistics questions. This will help you have insight upon the important statistics concepts that are frequently asked in interviews.
D. Mayo: Replication Research Under an Error Statistical Philosophy jemille6
D. Mayo (Virginia Tech) slides from her talk June 3 at the "Preconference Workshop on Replication in the Sciences" at the 2015 Society for Philosophy and Psychology meeting.
Recent position statements on the misuse of p-values and significance testing have led to a reassessment of how study results are reported in journals. Increased use of point
estimates and confidence intervals can help avoid the misinterpretation encountered with significance testing. Greater use of confidence intervals can lead to more criticallyand clinically-relevant discussions of study results
Improving epidemiological research: avoiding the statistical paradoxes and fa...Maarten van Smeden
Keynote at Norwegian Epidemiological Association conference, October 26 2022. Discussing absence of evidence fallacy, Table 2 fallacy, Winner's curse and Stein's paradox.
Development and evaluation of prediction models: pitfalls and solutionsMaarten van Smeden
Slides for the statistics in practice session for the Biometrisches Kolloqium (organized by the Deutsche Region der Internationalen Biometrischen Gesellschaft), 18 March 2021
Flu Vaccine Alert in Bangalore Karnatakaaddon Scans
As flu season approaches, health officials in Bangalore, Karnataka, are urging residents to get their flu vaccinations. The seasonal flu, while common, can lead to severe health complications, particularly for vulnerable populations such as young children, the elderly, and those with underlying health conditions.
Dr. Vidisha Kumari, a leading epidemiologist in Bangalore, emphasizes the importance of getting vaccinated. "The flu vaccine is our best defense against the influenza virus. It not only protects individuals but also helps prevent the spread of the virus in our communities," he says.
This year, the flu season is expected to coincide with a potential increase in other respiratory illnesses. The Karnataka Health Department has launched an awareness campaign highlighting the significance of flu vaccinations. They have set up multiple vaccination centers across Bangalore, making it convenient for residents to receive their shots.
To encourage widespread vaccination, the government is also collaborating with local schools, workplaces, and community centers to facilitate vaccination drives. Special attention is being given to ensuring that the vaccine is accessible to all, including marginalized communities who may have limited access to healthcare.
Residents are reminded that the flu vaccine is safe and effective. Common side effects are mild and may include soreness at the injection site, mild fever, or muscle aches. These side effects are generally short-lived and far less severe than the flu itself.
Healthcare providers are also stressing the importance of continuing COVID-19 precautions. Wearing masks, practicing good hand hygiene, and maintaining social distancing are still crucial, especially in crowded places.
Protect yourself and your loved ones by getting vaccinated. Together, we can help keep Bangalore healthy and safe this flu season. For more information on vaccination centers and schedules, residents can visit the Karnataka Health Department’s official website or follow their social media pages.
Stay informed, stay safe, and get your flu shot today!
New Drug Discovery and Development .....NEHA GUPTA
The "New Drug Discovery and Development" process involves the identification, design, testing, and manufacturing of novel pharmaceutical compounds with the aim of introducing new and improved treatments for various medical conditions. This comprehensive endeavor encompasses various stages, including target identification, preclinical studies, clinical trials, regulatory approval, and post-market surveillance. It involves multidisciplinary collaboration among scientists, researchers, clinicians, regulatory experts, and pharmaceutical companies to bring innovative therapies to market and address unmet medical needs.
- Video recording of this lecture in English language: https://youtu.be/kqbnxVAZs-0
- Video recording of this lecture in Arabic language: https://youtu.be/SINlygW1Mpc
- Link to download the book free: https://nephrotube.blogspot.com/p/nephrotube-nephrology-books.html
- Link to NephroTube website: www.NephroTube.com
- Link to NephroTube social media accounts: https://nephrotube.blogspot.com/p/join-nephrotube-on-social-media.html
Basavarajeeyam is an important text for ayurvedic physician belonging to andhra pradehs. It is a popular compendium in various parts of our country as well as in andhra pradesh. The content of the text was presented in sanskrit and telugu language (Bilingual). One of the most famous book in ayurvedic pharmaceutics and therapeutics. This book contains 25 chapters called as prakaranas. Many rasaoushadis were explained, pioneer of dhatu druti, nadi pareeksha, mutra pareeksha etc. Belongs to the period of 15-16 century. New diseases like upadamsha, phiranga rogas are explained.
Title: Sense of Taste
Presenter: Dr. Faiza, Assistant Professor of Physiology
Qualifications:
MBBS (Best Graduate, AIMC Lahore)
FCPS Physiology
ICMT, CHPE, DHPE (STMU)
MPH (GC University, Faisalabad)
MBA (Virtual University of Pakistan)
Learning Objectives:
Describe the structure and function of taste buds.
Describe the relationship between the taste threshold and taste index of common substances.
Explain the chemical basis and signal transduction of taste perception for each type of primary taste sensation.
Recognize different abnormalities of taste perception and their causes.
Key Topics:
Significance of Taste Sensation:
Differentiation between pleasant and harmful food
Influence on behavior
Selection of food based on metabolic needs
Receptors of Taste:
Taste buds on the tongue
Influence of sense of smell, texture of food, and pain stimulation (e.g., by pepper)
Primary and Secondary Taste Sensations:
Primary taste sensations: Sweet, Sour, Salty, Bitter, Umami
Chemical basis and signal transduction mechanisms for each taste
Taste Threshold and Index:
Taste threshold values for Sweet (sucrose), Salty (NaCl), Sour (HCl), and Bitter (Quinine)
Taste index relationship: Inversely proportional to taste threshold
Taste Blindness:
Inability to taste certain substances, particularly thiourea compounds
Example: Phenylthiocarbamide
Structure and Function of Taste Buds:
Composition: Epithelial cells, Sustentacular/Supporting cells, Taste cells, Basal cells
Features: Taste pores, Taste hairs/microvilli, and Taste nerve fibers
Location of Taste Buds:
Found in papillae of the tongue (Fungiform, Circumvallate, Foliate)
Also present on the palate, tonsillar pillars, epiglottis, and proximal esophagus
Mechanism of Taste Stimulation:
Interaction of taste substances with receptors on microvilli
Signal transduction pathways for Umami, Sweet, Bitter, Sour, and Salty tastes
Taste Sensitivity and Adaptation:
Decrease in sensitivity with age
Rapid adaptation of taste sensation
Role of Saliva in Taste:
Dissolution of tastants to reach receptors
Washing away the stimulus
Taste Preferences and Aversions:
Mechanisms behind taste preference and aversion
Influence of receptors and neural pathways
Impact of Sensory Nerve Damage:
Degeneration of taste buds if the sensory nerve fiber is cut
Abnormalities of Taste Detection:
Conditions: Ageusia, Hypogeusia, Dysgeusia (parageusia)
Causes: Nerve damage, neurological disorders, infections, poor oral hygiene, adverse drug effects, deficiencies, aging, tobacco use, altered neurotransmitter levels
Neurotransmitters and Taste Threshold:
Effects of serotonin (5-HT) and norepinephrine (NE) on taste sensitivity
Supertasters:
25% of the population with heightened sensitivity to taste, especially bitterness
Increased number of fungiform papillae
NVBDCP.pptx Nation vector borne disease control programSapna Thakur
NVBDCP was launched in 2003-2004 . Vector-Borne Disease: Disease that results from an infection transmitted to humans and other animals by blood-feeding arthropods, such as mosquitoes, ticks, and fleas. Examples of vector-borne diseases include Dengue fever, West Nile Virus, Lyme disease, and malaria.
Ozempic: Preoperative Management of Patients on GLP-1 Receptor Agonists Saeid Safari
Preoperative Management of Patients on GLP-1 Receptor Agonists like Ozempic and Semiglutide
ASA GUIDELINE
NYSORA Guideline
2 Case Reports of Gastric Ultrasound
The Gram stain is a fundamental technique in microbiology used to classify bacteria based on their cell wall structure. It provides a quick and simple method to distinguish between Gram-positive and Gram-negative bacteria, which have different susceptibilities to antibiotics
Adv. biopharm. APPLICATION OF PHARMACOKINETICS : TARGETED DRUG DELIVERY SYSTEMSAkankshaAshtankar
MIP 201T & MPH 202T
ADVANCED BIOPHARMACEUTICS & PHARMACOKINETICS : UNIT 5
APPLICATION OF PHARMACOKINETICS : TARGETED DRUG DELIVERY SYSTEMS By - AKANKSHA ASHTANKAR
Local Advanced Lung Cancer: Artificial Intelligence, Synergetics, Complex Sys...Oleg Kshivets
Overall life span (LS) was 1671.7±1721.6 days and cumulative 5YS reached 62.4%, 10 years – 50.4%, 20 years – 44.6%. 94 LCP lived more than 5 years without cancer (LS=2958.6±1723.6 days), 22 – more than 10 years (LS=5571±1841.8 days). 67 LCP died because of LC (LS=471.9±344 days). AT significantly improved 5YS (68% vs. 53.7%) (P=0.028 by log-rank test). Cox modeling displayed that 5YS of LCP significantly depended on: N0-N12, T3-4, blood cell circuit, cell ratio factors (ratio between cancer cells-CC and blood cells subpopulations), LC cell dynamics, recalcification time, heparin tolerance, prothrombin index, protein, AT, procedure type (P=0.000-0.031). Neural networks, genetic algorithm selection and bootstrap simulation revealed relationships between 5YS and N0-12 (rank=1), thrombocytes/CC (rank=2), segmented neutrophils/CC (3), eosinophils/CC (4), erythrocytes/CC (5), healthy cells/CC (6), lymphocytes/CC (7), stick neutrophils/CC (8), leucocytes/CC (9), monocytes/CC (10). Correct prediction of 5YS was 100% by neural networks computing (error=0.000; area under ROC curve=1.0).
2. About
• statistician by training
• phd (2016): diagnostic research in absence gold standard
(JC)
• post-doc: biostatistics / epidemiological methods (JC)
12. … the p-value fails
“arguably significant” (P = 0.07)
“direction heading to significance” (P = 0.10)
“flirting with conventional levels of significance” (P > 0.1)
“marginally significant” (P ≥ 0.1)
convenient sample from: https://mchankins.wordpress.com/2013/04/21/still-not-significant-2/
listing 509 expressions for non-significant results at α = .05 level (24 October 2016)
13. + 23!!! supplementary files
Wasserstein & Lazar (2016) The ASA's Statement on p-Values:
Context, Process, and Purpose, The American Statistician, 70:2, 129-133
14. A few quotes (1)
“The ASA has not previously taken positions on specific
matters of statistical practice.”
nb. founded in 1839
“Nothing in the ASA statement is new.”
from the ASA Statement
15. A few quotes (2)
“… process was lengthier and more controversial than
anticipated.”
“… the statement articulates in non-technical terms a few select
principles that could improve the conduct or interpretation of
quantitative science, according to widespread consensus in the
statistical community."
from the ASA Statement
18. Why do we need a statement?
‘“It’s science’s dirtiest secret: The ‘scientific method’ of testing
hypotheses by statistical analysis stands on a flimsy
foundation.”’
Quoting Siegfried (2010), Odds Are, It’s Wrong: Science Fails to Face the Shortcomings of Statistics, Science News, 177, 26.
from the ASA Statement: Wasserstein & Lazar (2016) The ASA's Statement on p-Values:
Context, Process, and Purpose, The American Statistician, 70:2, 129-133
19. OK, but why now?
“… highly visible discussions over the last few years”
“The statistical community has been deeply concerned about
issues of reproducibility and replicability …”
from the ASA statement
24. P-value increasingly central in reporting
From: Chavalarias et al. JAMA. 2016;315(11):1141-1148, doi:10.1001/jama.2016.1952
Using text-mining >1.6 million abstracts
25. In the large (‘big’) data era
“With a combination of large datasets, confounding, flexibility in
analytical choices …, and superimposed selective reporting
bias, using a P < 0.05 threshold to declare “success,” ….
means next to nothing.”
From ASA supplementary material, response by Ioannidis.
26. To summarise: why?
• p-values and the P < .05 rule are at the core of inference in
today’s science (social, biomedical, …)
• there is growing concern that these inference are often wrong
• perhaps, if we understand p-values better, we’ll be less
often wrong
28. The statement: 6 principles
1. P-values can indicate how incompatible the data are with a specified
statistical model.
2. P-values do not measure the probability that the studied hypothesis is
true, or the probability that the data were produced by random chance
alone.
3. Scientific conclusions and business or policy decisions should not be
based only on whether a p-value passes a specific threshold.
4. Proper inference requires full reporting and transparency.
5. A p-value, or statistical significance, does not measure the size of an
effect or the importance of a result.
6. By itself, a p-value does not provide a good measure of evidence
regarding a model or hypothesis.
from the ASA statement
29. Statistical model?
• every method of statistical inference relies on a web of
assumptions which together can be viewed as a ‘statistical
model’
• the tested hypothesis is one of these assumptions. Often a
‘zero-effect’ called ‘null hypothesis’
30. About assumptions
the calculation of p-values always relies on assumptions
besides the hypothesis tested. It is easy to ignore/forget those
assumptions while analysing.
Your assumptions are your windows on the world.
Scrub them off every once in a while, or the light
won't come in.
Alan Alda
31. The statement: 6 principles
1. P-values can indicate how incompatible the data are with a specified
statistical model.
2. P-values do not measure the probability that the studied hypothesis
is true, or the probability that the data were produced by random
chance alone.
3. Scientific conclusions and business or policy decisions should not be
based only on whether a p-value passes a specific threshold.
4. Proper inference requires full reporting and transparency.
5. A p-value, or statistical significance, does not measure the size of an
effect or the importance of a result.
6. By itself, a p-value does not provide a good measure of evidence
regarding a model or hypothesis.
from the ASA statement
32. From a probability point of view
p-value*: P(Data|Hypothesis)
is not: P(Hypothesis|Data)
*Somewhat simplified, correct notation would be: P(T(X) ≥ x | Hypothesis)
33. Does it matter?
P(Death|Handgun)
= 5% to 20%*
P(Handgun|Death)
= 0.028%**
* from New York Times (http://www.nytimes.com article published: 2008/04/03/)
** from CBS StatLine (concerning deaths and registered gun crimes in 2015 in the Netherlands)
34. If there only was a way…
P(Data|Hypothesis)
P(Hypothesis|Data)
36. The statement: 6 principles
1. P-values can indicate how incompatible the data are with a specified
statistical model.
2. P-values do not measure the probability that the studied hypothesis is
true, or the probability that the data were produced by random chance
alone.
3. Scientific conclusions and business or policy decisions should not be
based only on whether a p-value passes a specific threshold.
4. Proper inference requires full reporting and transparency.
5. A p-value, or statistical significance, does not measure the size of an
effect or the importance of a result.
6. By itself, a p-value does not provide a good measure of evidence
regarding a model or hypothesis.
from the ASA statement
37. On bright-line rules
“Practices that reduce data analysis or scientific
inference to mechanical “bright-line” rules (such as “p <
0.05”) for justifying scientific claims or conclusions can
lead to erroneous beliefs and poor decision making. A
conclusion does not immediately become “true” on
one side of the divide and “false” on the other.”
from the ASA statement
38. If p ~ .05
D Colquhoun (2014). An investigation of the false discovery rate and the misinterpretation of p-values. R.Soc.opensci.1:140216.
“If you want to avoid making a fool of yourself very often, do not
regard anything greater than p < 0.001 as a demonstration that
you have discovered something”
40. The statement: 6 principles
1. P-values can indicate how incompatible the data are with a specified
statistical model.
2. P-values do not measure the probability that the studied hypothesis is
true, or the probability that the data were produced by random chance
alone.
3. Scientific conclusions and business or policy decisions should not be
based only on whether a p-value passes a specific threshold.
4. Proper inference requires full reporting and transparency.
5. A p-value, or statistical significance, does not measure the size of an
effect or the importance of a result.
6. By itself, a p-value does not provide a good measure of evidence
regarding a model or hypothesis.
from the ASA statement
41. The issue of pre-specified hypotheses
From: http://compare-trials.org/ accessed on November 20 2016
42. Ed Yong (2012). Replication studies: Bad copy, Nature. Data credits to: D Fanelli.
43. Why is this enormous positivity?
If you torture the data long enough,
it will confess to anything
Ronald Coase
besides journal editors requirement for p < .05
44. Multiple (potential) comparisons
aka
- p-hacking
- data fishing
- data dredging
- multiple testing
- multiplicity
- significance chasing
- significance questing
- selective inference
- etc.
45. Selective reporting
“Whenever a researcher chooses what to present based on
statistical results, valid interpretation of those results is
severely compromised if the reader is not informed of the choice
and its basis. Researchers should disclose the number of
hypotheses explored during the study, all data collection
decisions, all statistical analyses conducted, and all p-
values computed. Valid scientific conclusions based on p-
values and related statistics cannot be drawn without at least
knowing how many and which analyses were conducted, and
how those analyses (including p-values) were selected for
reporting.”
from the ASA statement
46. The statement: 6 principles
1. P-values can indicate how incompatible the data are with a specified
statistical model.
2. P-values do not measure the probability that the studied hypothesis is
true, or the probability that the data were produced by random chance
alone.
3. Scientific conclusions and business or policy decisions should not be
based only on whether a p-value passes a specific threshold.
4. Proper inference requires full reporting and transparency.
5. A p-value, or statistical significance, does not measure the size of
an effect or the importance of a result.
6. By itself, a p-value does not provide a good measure of evidence
regarding a model or hypothesis.
from the ASA statement
47. About effect size
• statistical significance does not imply practical importance
• to understand practical importance we need information on
the effect size
• Is the p-value a good measure for effect size?
48. Dance of the p-values
https://www.youtube.com/watch?v=5OL1RqHrZQ8&t=10s
Credits to Professor Geoff Cumming
49. The statement: 6 principles
1. P-values can indicate how incompatible the data are with a specified
statistical model.
2. P-values do not measure the probability that the studied hypothesis
is true, or the probability that the data were produced by random
chance alone.
3. Scientific conclusions and business or policy decisions should not
be based only on whether a p-value passes a specific threshold.
4. Proper inference requires full reporting and transparency.
5. A p-value, or statistical significance, does not measure the size of an
effect or the importance of a result.
6. By itself, a p-value does not provide a good measure of evidence
regarding a model or hypothesis.
from the ASA Statement
50. P-values in isolation
“Researchers should recognize that a p-value without context
or other evidence provides limited information. For example, a
p-value near 0.05 taken by itself offers only weak evidence
against the null hypothesis. Likewise, a relatively large p-value
does not imply evidence in favour of the null hypothesis; many
other hypotheses may be equally or more consistent with the
observed data. For these reasons, data analysis should not
end with the calculation of a p-value when other approaches
are appropriate and feasible.”
from the ASA statement
51. The statement: 6 principles
1. P-values can indicate how incompatible the data are with a specified
statistical model.
2. P-values do not measure the probability that the studied hypothesis
is true, or the probability that the data were produced by random
chance alone.
3. Scientific conclusions and business or policy decisions should not
be based only on whether a p-value passes a specific threshold.
4. Proper inference requires full reporting and transparency.
5. A p-value, or statistical significance, does not measure the size of an
effect or the importance of a result.
6. By itself, a p-value does not provide a good measure of evidence
regarding a model or hypothesis.
from the ASA statement
52. Agreement reached?
“you can believe me that had it been any stronger, then all but
one of the statisticians would have resigned.”
“If only the rest could have agreed with me, we would have a
much stronger statement.”
from SlideShare, by Stephen Senn: P Values and the art of herding cats (accessed on Oct 30 2016)
Stephen Senn, involved in the ASA statement
53. From a practical point of view
if you work with p-values (derived from the 6 ASA principles):
1. think carefully about the underlying assumptions
2. avoid statements about the truth of the tested hypothesis
3. avoid strong statements about effect based solely on p < .
05 or absence of effect based solely on p > .05
4. report no. and sequence of analyses; avoid data torture
5. avoid statements about effect size based on p-value
6. if feasible, use additional information from other inferential
tools
58. Rational for Bayesian inference
the posterior distribution (θ|D) is “more informative” than the
likelihood (D|θ)
However:
“Proponents of the “Bayesian revolution” should be wary of
chasing het another chimera: an apparently universal inference
procedure. A better path would be to promote both an
understanding of various devices in the “statistical toolbox” and
informed judgment to select among these.”
Gigerenzer and Marewski (2015), Surrogate Science: The Idol of a Universal Method for Scientific Inference. Journal of Management
60. The words of the pioneer
No scientific worker has a fixed level of
significance at which from year to year, and in
all circumstances, he rejects hypotheses; he rather
gives his mind to each particular case in the light of
his evidence and his ideas.
Ronald Fisher
61. Many initiatives to improve science…
see: http://www.scienceintransition.nl/english
62. and reduce waste
~ 85% of all health research is being avoidably “wasted”
see also: http://blogs.bmj.com/bmj/2016/01/14/paul-glasziou-and-iain-chalmers-is-85-of-health-research-really-wasted/,
and: Lancet’s 2014 series on increasing value, reducing waste (incl video’s etc.): http://www.thelancet.com/series/research
63. Conclusion
• statistical inference is inherently difficult; we should avoid
making a fool of ourselves too often
• p-values can be useful tools for inference; most often, p-
values should not be the ‘star of the inference show’
• bright line rules such as p < .05 give a false sense of
scientific objectivity
• like to play around with data? Me too! Think twice before you
publish such explorations; if you do, be honest and
transparent in reporting
64. Some random thoughts
• inference is thought as a primarily mathematical or
computational problem, it should not.
• we should ban the term “significant” from scientific output
for describing effects that are accompanied with p < .05.
• in applied statistics education, we should invest more time
in discussing various forms of inference (e.g., Bayesian
inference) and their merits and pitfalls
66. Points for discussion
• is there a need for changing the way we do inference?
• if so, how and what do we change?
• education?
• journals?
• should we downplay the role of p < .05 in scientific output?