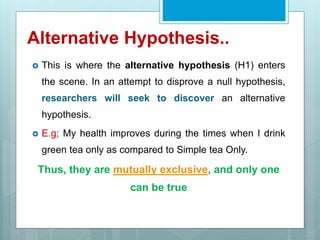
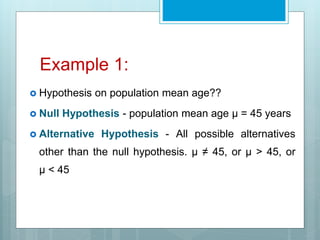
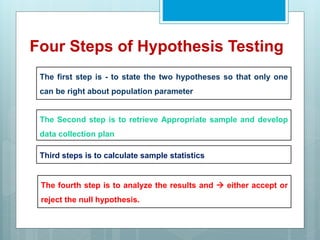
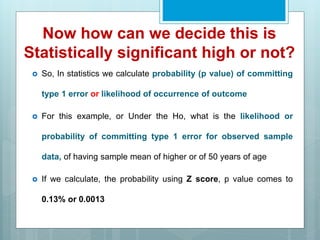
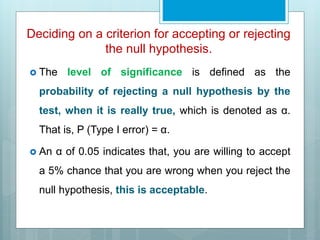
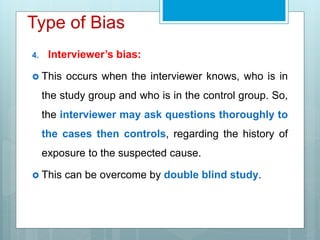
Learning objective
 To understand about Hypothesis
 To know the types of hypothesis
 Process of hypothesis testing
 Error in Research
 Research Bias
What Is Hypothesis??
 Tentative assumption of population parameter
 Conditional statement
 Concession made for the sake of argument
 A prediction from theory for something happen
What is Hypothesis?
It need to be statistically tested to see, it is in
real, true or not
The six most common forms of
hypotheses are:
 Simple Hypothesis
 Complex Hypothesis
 Empirical Hypothesis
 Null Hypothesis (Denoted by "HO")
 Alternative Hypothesis (Denoted by "H1")
 Logical Hypothesis
Null hypothesis
 A null hypothesis (H0) exists, when a researcher
believes, there is no relationship between the two
variables, or there is a lack of information to state a
scientific hypothesis. This is something, Researcher try
to attempt to disprove or Reject.
 E.g; There is no significant change in my health, during
the times when I drink green tea only or simple tea only.
Alternative Hypothesis..
 This is where the alternative hypothesis (H1) enters
the scene. In an attempt to disprove a null hypothesis,
researchers will seek to discover an alternative
hypothesis.
 E.g; My health improves during the times when I drink
green tea only as compared to Simple tea Only.
Thus, they are mutually exclusive, and only one
can be true
Example 1:
 Hypothesis on population mean age??
 Null Hypothesis - population mean age μ = 45 years
 Alternative Hypothesis - All possible alternatives
other than the null hypothesis. μ ≠ 45, or μ > 45, or
μ < 45
Example 2:
 For example, in a clinical trial of a new drug for
Disease A,
 the null hypothesis might be that, the new drug is
no better, than the current drug.
 H0: there is no difference between the two drugs
on an average.
 The alternative hypothesis might be that, the new drug
has a different effect, on average, compared to that of the
current drug.
 Ha: the two drugs have different effects, on average.
or
 Ha: the new drug is better than the current drug, on
average.
The result of a hypothesis test:
‘Reject H0 in favour of Ha’ OR ‘Do not reject H0’
 The best way to determine, whether a our
hypothesis is true or not, would be to examine the
entire population.
 Since, that is often impractical, resource and time
consuming.
Research
Process..
If sample data are not consistent with the our
hypothesis, the hypothesis is rejected.
Research
Process..
Inference
What Is Hypothesis Testing?
 Hypothesis testing is an act in statistics, whereby, an
analyst test an assumption/ Hypothesis, regarding a
population parameter.
 Hypothesis testing is used, to infer the result of a
hypothesis performed on sample data from a larger
population.
Four Steps of Hypothesis Testing
The first step is - to state the two hypotheses so that only one
can be right about population parameter
The Second step is to retrieve Appropriate sample and develop
data collection plan
Third steps is to calculate sample statistics
The fourth step is to analyze the results and  either accept or
reject the null hypothesis.
How can we, Accept or Reject H0??
Concept of p-value, Level of Significance and
confidence level
 P- value is used in hypothesis testing process..
 It is the probability of Obtaining, the observed results
in sample testing, when the null hypothesis (H0) of a
study question is true.
 Probability of “False rejection of Null Hypothesis,
when actually it was true”.
Example:
Ho= Mean age of Population is 45 years of age
Ha = Mean age of population not 45 years of age
Now to prove the statement, we will take sample collect
data from that sample  analyse it and decide which one
is true
Logic is that, if Ho is true, than sample mean ( x̄ ) should
be near or equal to 45 years of age
But It has to be proved Statistically Significant, that
we have taken correct decision, and chance of error if
exist, it is less (mostly less than 5%)
Lets suppose, we collect data, n=100 and found sample
mean ( x̄ ), is 50 years with SD of 4 years
It is obvious from sample data, Mean is Higher than accepted
in Null Hypothesis, and we reject the Null Hypothesis
Now how can we decide this is
Statistically significant high or not?
 So, In statistics we calculate probability (p value) of committing
type 1 error or likelihood of occurrence of outcome
 For this example, or Under the Ho, what is the likelihood or
probability of committing type 1 error for observed sample
data, of having sample mean of higher or of 50 years of age
 If we calculate, the probability using Z score, p value comes to
0.13% or 0.0013
 So, it means probability of committing type 1 Error is low,
under Ho true, is 0.0013 or 0.13%.
 Under the Ho, what we have observed is highly
unlikely..
 Null hypothesis and what we have observed that don’t
match
 We Reject the Null Hypothesis, and accept Ha; that
Mean age of population is not 45 years of age
Now the ? Is, how do we know
our probability is low…??
 In general speaking if;
 If Probability of observed outcome (commiting type 1
error) should be < 5% or 0.05
 We consider to that probability is LOW and we
Reject the Null Hypothesis
 Level of significance
Deciding on a criterion for accepting or rejecting
the null hypothesis.
 The level of significance is defined as the
probability of rejecting a null hypothesis by the
test, when it is really true, which is denoted as α.
That is, P (Type I error) = α.
 An α of 0.05 indicates that, you are willing to accept
a 5% chance that you are wrong when you reject the
null hypothesis, this is acceptable.
Deciding on a criterion for accepting or
rejecting the null hypothesis
 Confidence level refers to the possibility of a
parameter, that lies within a specified range of
values, which is denoted as c.
 The relationship between level of significance and
the confidence level is c=1−α.
Level of Significance..
The common level of significance and the
corresponding confidence level
 The level of significance 0.0,1or 1% is related to the
99% confidence level
 The level of significance 0.05 or 5%, is related to
the 95% confidence level.
 The level of significance 0.10 or 10%, is related to
the 90% confidence level.
Example to understand p-value:
Suppose my significant level/ threshold is 0.05 or
5%
1) Suppose calculated P=0.50 –
Than we would have 50% chance of getting result in
favor of Null hypothesis. In that situation it is higher
than significant level 5%, I wouldn’t reject my Null
Hypothesis.
Suppose my significant level/ threshold is 0.05 or
5%
1) Suppose calculated P=0.03 –
P= 0.03 - If we assume null hypothesis is true, I would
have 3% chance of getting observed result and it is less
than the even my level of significance/ or decided
threshold. So I can reject my Null Hypothesis
 The rejection rule is as follows:
Web of Statistical test
Type of ERROR
 Error in statistics, are related to, accepting or
rejecting null hypothesis, when vice versa is
true.
 There are 4 possibilities:
1. The researcher’s decision to accept the null
hypothesis could be correct
2. The researcher’s decision to accept the null
hypothesis could be incorrect
3. The researcher’s decision to Reject the null
hypothesis could be correct
4. The researcher’s decision to Reject the null
hypothesis could be incorrect
Type of error..
Type 1 Error: Probability of Rejecting Null Hypothesis, when it is
actually true. Researcher directly control the probability of committing
type 1 error.
Null Hypothesis
Decision of
Researcher
True False
Accept
Reject
Correct decision
Type I Error (alpha)
Type II Error
Correct Decision
 So, when you decide your level of significance 0.05
or 5%, that means probability of committing this
error is maximum up to 5 %.
 Type II error (beta): probability of accepting Null
Hypothesis that is actually not true.
 Power: denote by 1- beta; probability of rejecting
Null Hypothesis, when it is actually false.
Bias in Research..
 Bias is an kind of an error, often occurring in
research works, resulting in contradictory
results, and thus leading to wrong conclusions.
Type of Bias
1. Selection bias: This occurs when the selected sample
does not represent the universe or whole population
from which it is drawn. This can be overcome by proper
sampling technique and Sufficient the sample size
2. Memory or recall bias: Since there is collection of
retrospective data, the recall of events would be better
among the cases than controls, because the cases are
more likely to remember the past events better.
Overcome by taking Biological Marker.
Type of Bias
3. Confounding bias: Since the confounding factor
itself independently can result in the disease,
care must be taken while selecting the controls
that they must be free from the confounding
factors also. That means there must be proper
“matching” between cases and controls.
Type of Bias
4. Interviewer’s bias:
 This occurs when the interviewer knows, who is in
the study group and who is in the control group. So,
the interviewer may ask questions thoroughly to
the cases then controls, regarding the history of
exposure to the suspected cause.
 This can be overcome by double blind study.
Thank you..

Hypothesis testing, error and bias

  • 2.
    Learning objective  Tounderstand about Hypothesis  To know the types of hypothesis  Process of hypothesis testing  Error in Research  Research Bias
  • 3.
    What Is Hypothesis?? Tentative assumption of population parameter  Conditional statement  Concession made for the sake of argument  A prediction from theory for something happen
  • 4.
    What is Hypothesis? Itneed to be statistically tested to see, it is in real, true or not
  • 5.
    The six mostcommon forms of hypotheses are:  Simple Hypothesis  Complex Hypothesis  Empirical Hypothesis  Null Hypothesis (Denoted by "HO")  Alternative Hypothesis (Denoted by "H1")  Logical Hypothesis
  • 6.
    Null hypothesis  Anull hypothesis (H0) exists, when a researcher believes, there is no relationship between the two variables, or there is a lack of information to state a scientific hypothesis. This is something, Researcher try to attempt to disprove or Reject.  E.g; There is no significant change in my health, during the times when I drink green tea only or simple tea only.
  • 7.
    Alternative Hypothesis..  Thisis where the alternative hypothesis (H1) enters the scene. In an attempt to disprove a null hypothesis, researchers will seek to discover an alternative hypothesis.  E.g; My health improves during the times when I drink green tea only as compared to Simple tea Only. Thus, they are mutually exclusive, and only one can be true
  • 8.
    Example 1:  Hypothesison population mean age??  Null Hypothesis - population mean age μ = 45 years  Alternative Hypothesis - All possible alternatives other than the null hypothesis. μ ≠ 45, or μ > 45, or μ < 45
  • 9.
    Example 2:  Forexample, in a clinical trial of a new drug for Disease A,  the null hypothesis might be that, the new drug is no better, than the current drug.  H0: there is no difference between the two drugs on an average.
  • 10.
     The alternativehypothesis might be that, the new drug has a different effect, on average, compared to that of the current drug.  Ha: the two drugs have different effects, on average. or  Ha: the new drug is better than the current drug, on average. The result of a hypothesis test: ‘Reject H0 in favour of Ha’ OR ‘Do not reject H0’
  • 11.
     The bestway to determine, whether a our hypothesis is true or not, would be to examine the entire population.  Since, that is often impractical, resource and time consuming. Research Process..
  • 12.
    If sample dataare not consistent with the our hypothesis, the hypothesis is rejected. Research Process.. Inference
  • 13.
    What Is HypothesisTesting?  Hypothesis testing is an act in statistics, whereby, an analyst test an assumption/ Hypothesis, regarding a population parameter.  Hypothesis testing is used, to infer the result of a hypothesis performed on sample data from a larger population.
  • 14.
    Four Steps ofHypothesis Testing The first step is - to state the two hypotheses so that only one can be right about population parameter The Second step is to retrieve Appropriate sample and develop data collection plan Third steps is to calculate sample statistics The fourth step is to analyze the results and  either accept or reject the null hypothesis.
  • 15.
    How can we,Accept or Reject H0?? Concept of p-value, Level of Significance and confidence level  P- value is used in hypothesis testing process..  It is the probability of Obtaining, the observed results in sample testing, when the null hypothesis (H0) of a study question is true.  Probability of “False rejection of Null Hypothesis, when actually it was true”.
  • 16.
    Example: Ho= Mean ageof Population is 45 years of age Ha = Mean age of population not 45 years of age Now to prove the statement, we will take sample collect data from that sample  analyse it and decide which one is true Logic is that, if Ho is true, than sample mean ( x̄ ) should be near or equal to 45 years of age
  • 17.
    But It hasto be proved Statistically Significant, that we have taken correct decision, and chance of error if exist, it is less (mostly less than 5%) Lets suppose, we collect data, n=100 and found sample mean ( x̄ ), is 50 years with SD of 4 years It is obvious from sample data, Mean is Higher than accepted in Null Hypothesis, and we reject the Null Hypothesis
  • 18.
    Now how canwe decide this is Statistically significant high or not?  So, In statistics we calculate probability (p value) of committing type 1 error or likelihood of occurrence of outcome  For this example, or Under the Ho, what is the likelihood or probability of committing type 1 error for observed sample data, of having sample mean of higher or of 50 years of age  If we calculate, the probability using Z score, p value comes to 0.13% or 0.0013
  • 19.
     So, itmeans probability of committing type 1 Error is low, under Ho true, is 0.0013 or 0.13%.  Under the Ho, what we have observed is highly unlikely..  Null hypothesis and what we have observed that don’t match  We Reject the Null Hypothesis, and accept Ha; that Mean age of population is not 45 years of age
  • 20.
    Now the ?Is, how do we know our probability is low…??  In general speaking if;  If Probability of observed outcome (commiting type 1 error) should be < 5% or 0.05  We consider to that probability is LOW and we Reject the Null Hypothesis  Level of significance
  • 21.
    Deciding on acriterion for accepting or rejecting the null hypothesis.  The level of significance is defined as the probability of rejecting a null hypothesis by the test, when it is really true, which is denoted as α. That is, P (Type I error) = α.  An α of 0.05 indicates that, you are willing to accept a 5% chance that you are wrong when you reject the null hypothesis, this is acceptable.
  • 22.
    Deciding on acriterion for accepting or rejecting the null hypothesis  Confidence level refers to the possibility of a parameter, that lies within a specified range of values, which is denoted as c.  The relationship between level of significance and the confidence level is c=1−α.
  • 23.
  • 24.
    The common levelof significance and the corresponding confidence level  The level of significance 0.0,1or 1% is related to the 99% confidence level  The level of significance 0.05 or 5%, is related to the 95% confidence level.  The level of significance 0.10 or 10%, is related to the 90% confidence level.
  • 25.
    Example to understandp-value: Suppose my significant level/ threshold is 0.05 or 5% 1) Suppose calculated P=0.50 – Than we would have 50% chance of getting result in favor of Null hypothesis. In that situation it is higher than significant level 5%, I wouldn’t reject my Null Hypothesis.
  • 26.
    Suppose my significantlevel/ threshold is 0.05 or 5% 1) Suppose calculated P=0.03 – P= 0.03 - If we assume null hypothesis is true, I would have 3% chance of getting observed result and it is less than the even my level of significance/ or decided threshold. So I can reject my Null Hypothesis
  • 27.
     The rejectionrule is as follows:
  • 28.
  • 29.
    Type of ERROR Error in statistics, are related to, accepting or rejecting null hypothesis, when vice versa is true.  There are 4 possibilities: 1. The researcher’s decision to accept the null hypothesis could be correct 2. The researcher’s decision to accept the null hypothesis could be incorrect
  • 30.
    3. The researcher’sdecision to Reject the null hypothesis could be correct 4. The researcher’s decision to Reject the null hypothesis could be incorrect
  • 31.
    Type of error.. Type1 Error: Probability of Rejecting Null Hypothesis, when it is actually true. Researcher directly control the probability of committing type 1 error. Null Hypothesis Decision of Researcher True False Accept Reject Correct decision Type I Error (alpha) Type II Error Correct Decision
  • 32.
     So, whenyou decide your level of significance 0.05 or 5%, that means probability of committing this error is maximum up to 5 %.  Type II error (beta): probability of accepting Null Hypothesis that is actually not true.  Power: denote by 1- beta; probability of rejecting Null Hypothesis, when it is actually false.
  • 33.
    Bias in Research.. Bias is an kind of an error, often occurring in research works, resulting in contradictory results, and thus leading to wrong conclusions.
  • 34.
    Type of Bias 1.Selection bias: This occurs when the selected sample does not represent the universe or whole population from which it is drawn. This can be overcome by proper sampling technique and Sufficient the sample size 2. Memory or recall bias: Since there is collection of retrospective data, the recall of events would be better among the cases than controls, because the cases are more likely to remember the past events better. Overcome by taking Biological Marker.
  • 35.
    Type of Bias 3.Confounding bias: Since the confounding factor itself independently can result in the disease, care must be taken while selecting the controls that they must be free from the confounding factors also. That means there must be proper “matching” between cases and controls.
  • 36.
    Type of Bias 4.Interviewer’s bias:  This occurs when the interviewer knows, who is in the study group and who is in the control group. So, the interviewer may ask questions thoroughly to the cases then controls, regarding the history of exposure to the suspected cause.  This can be overcome by double blind study.
  • 37.