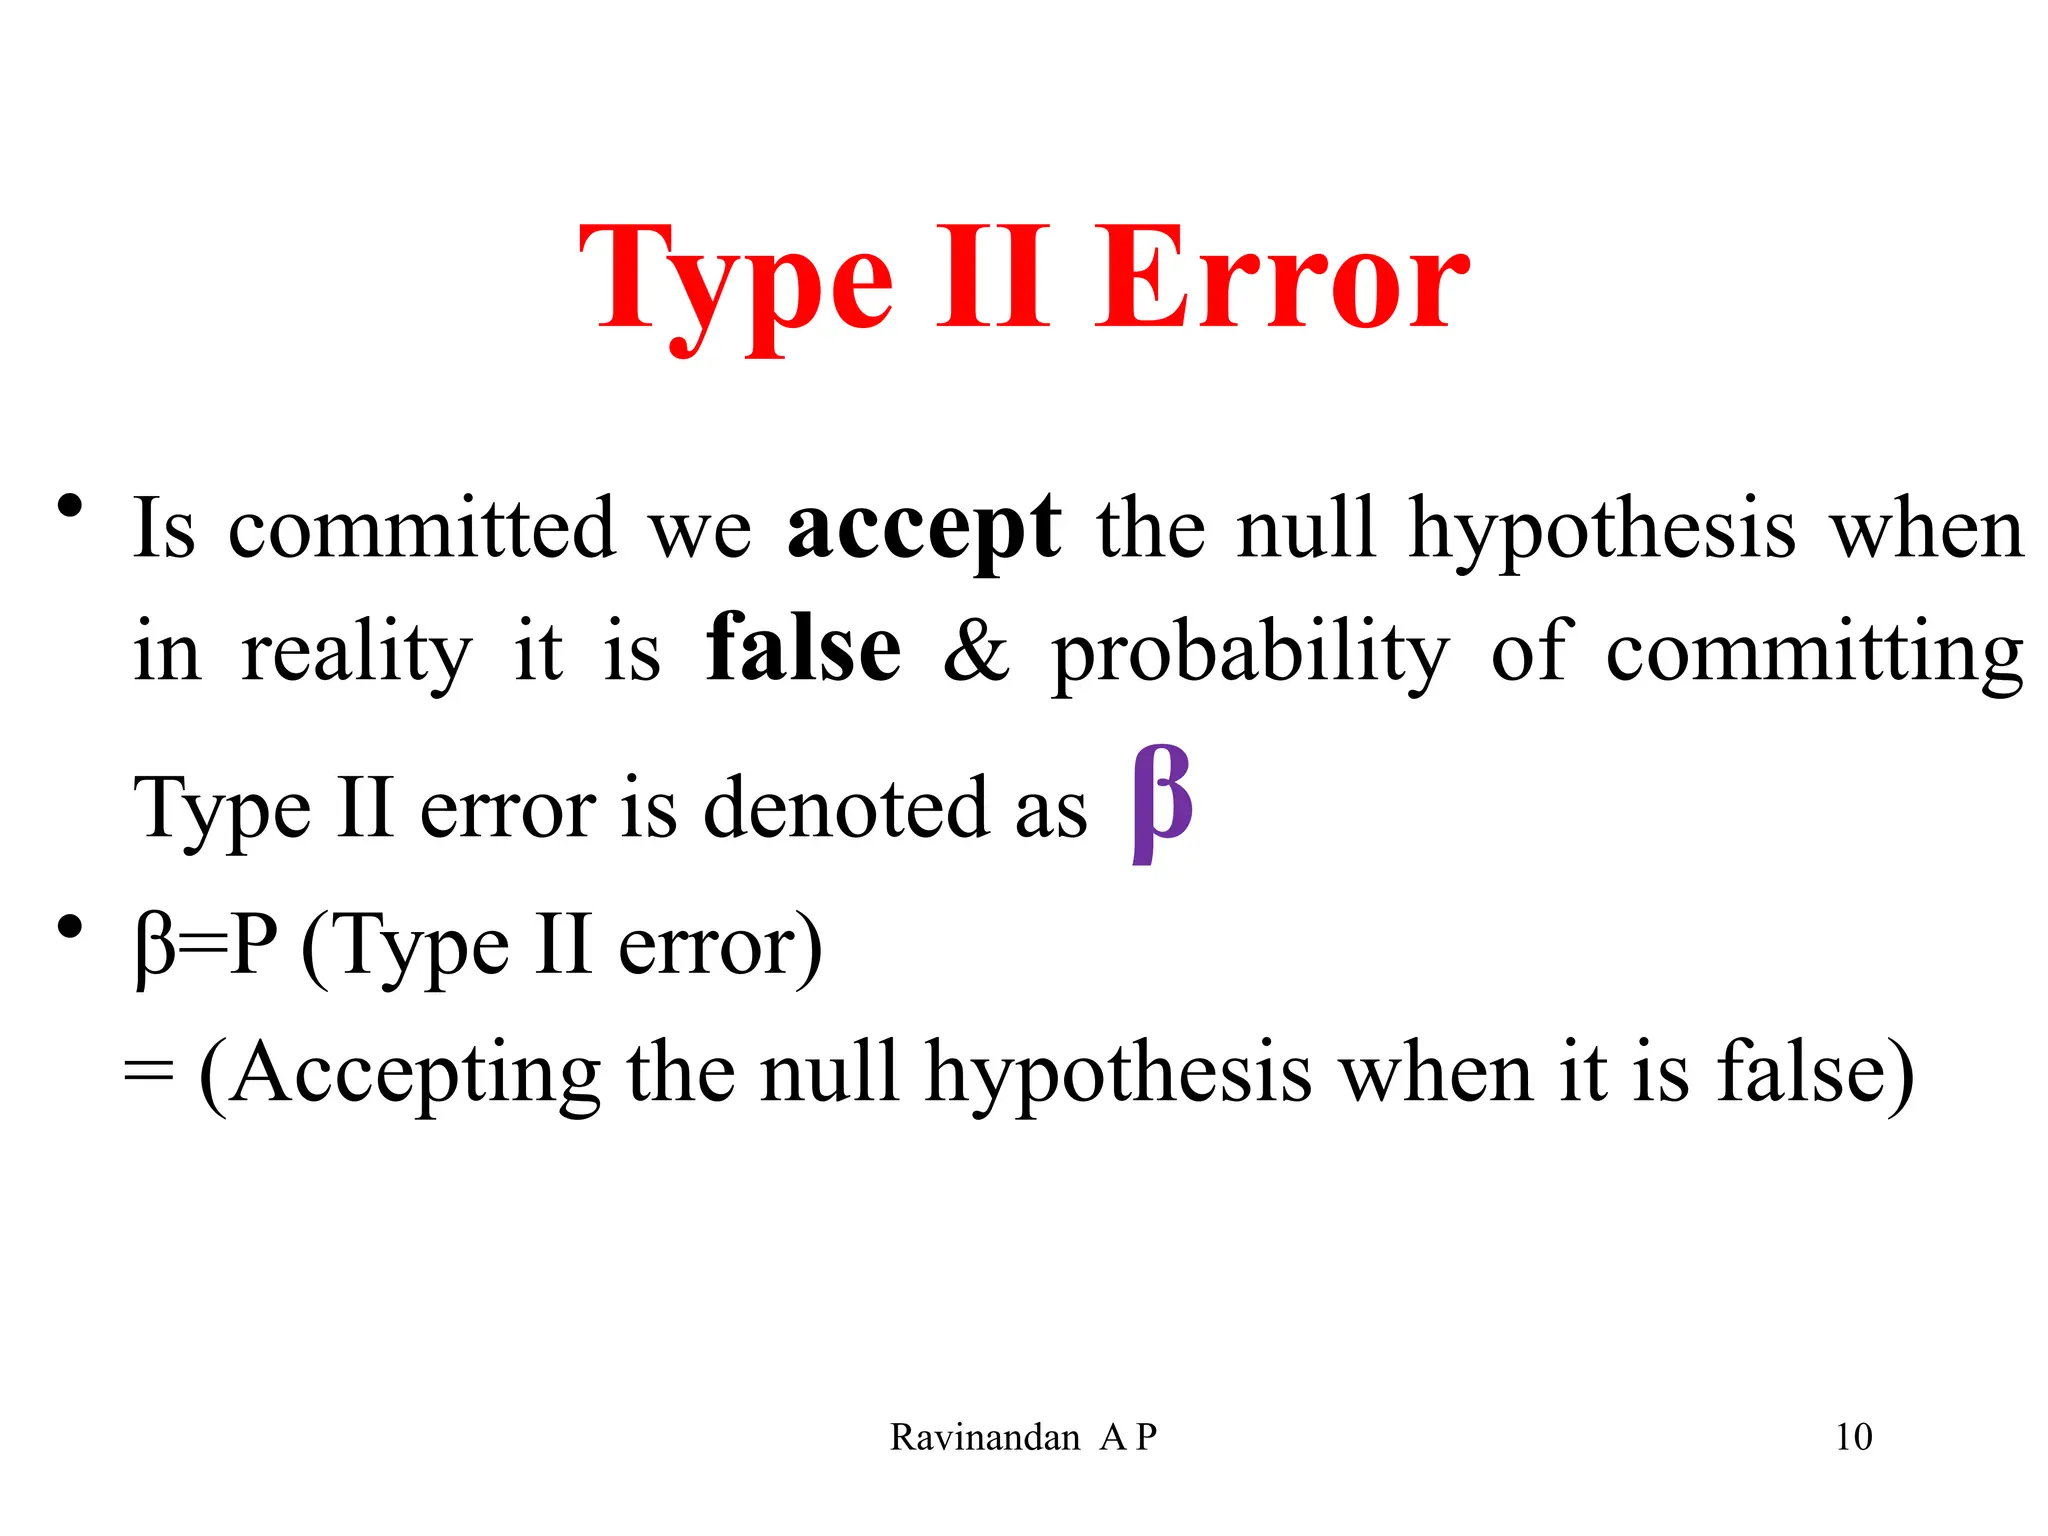
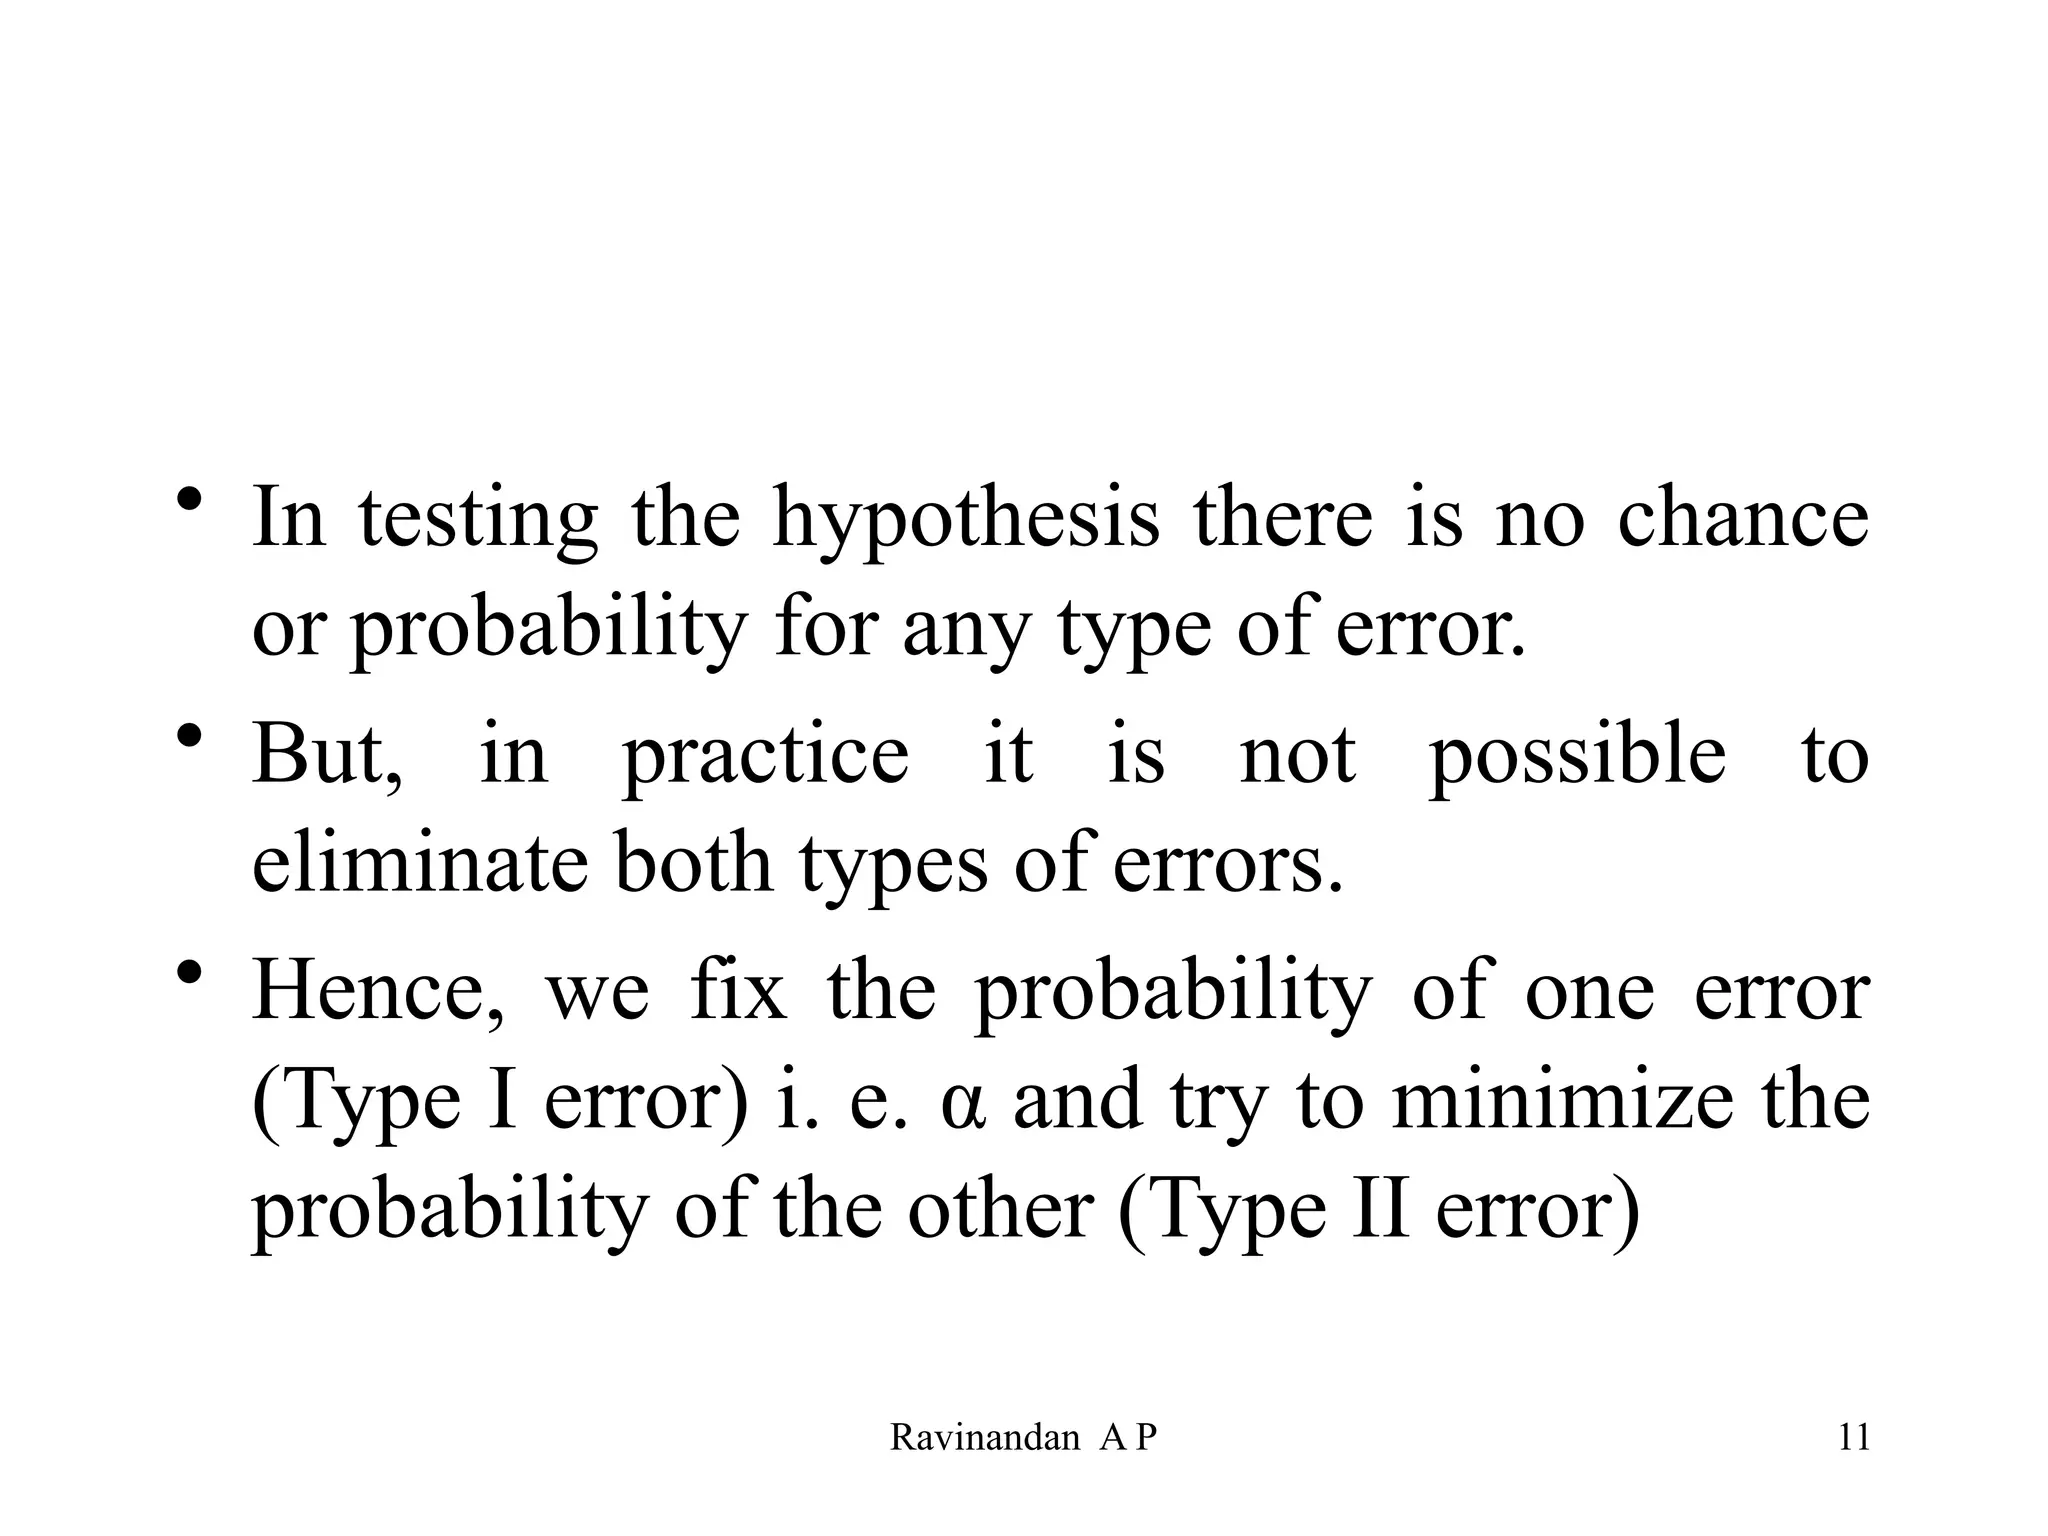
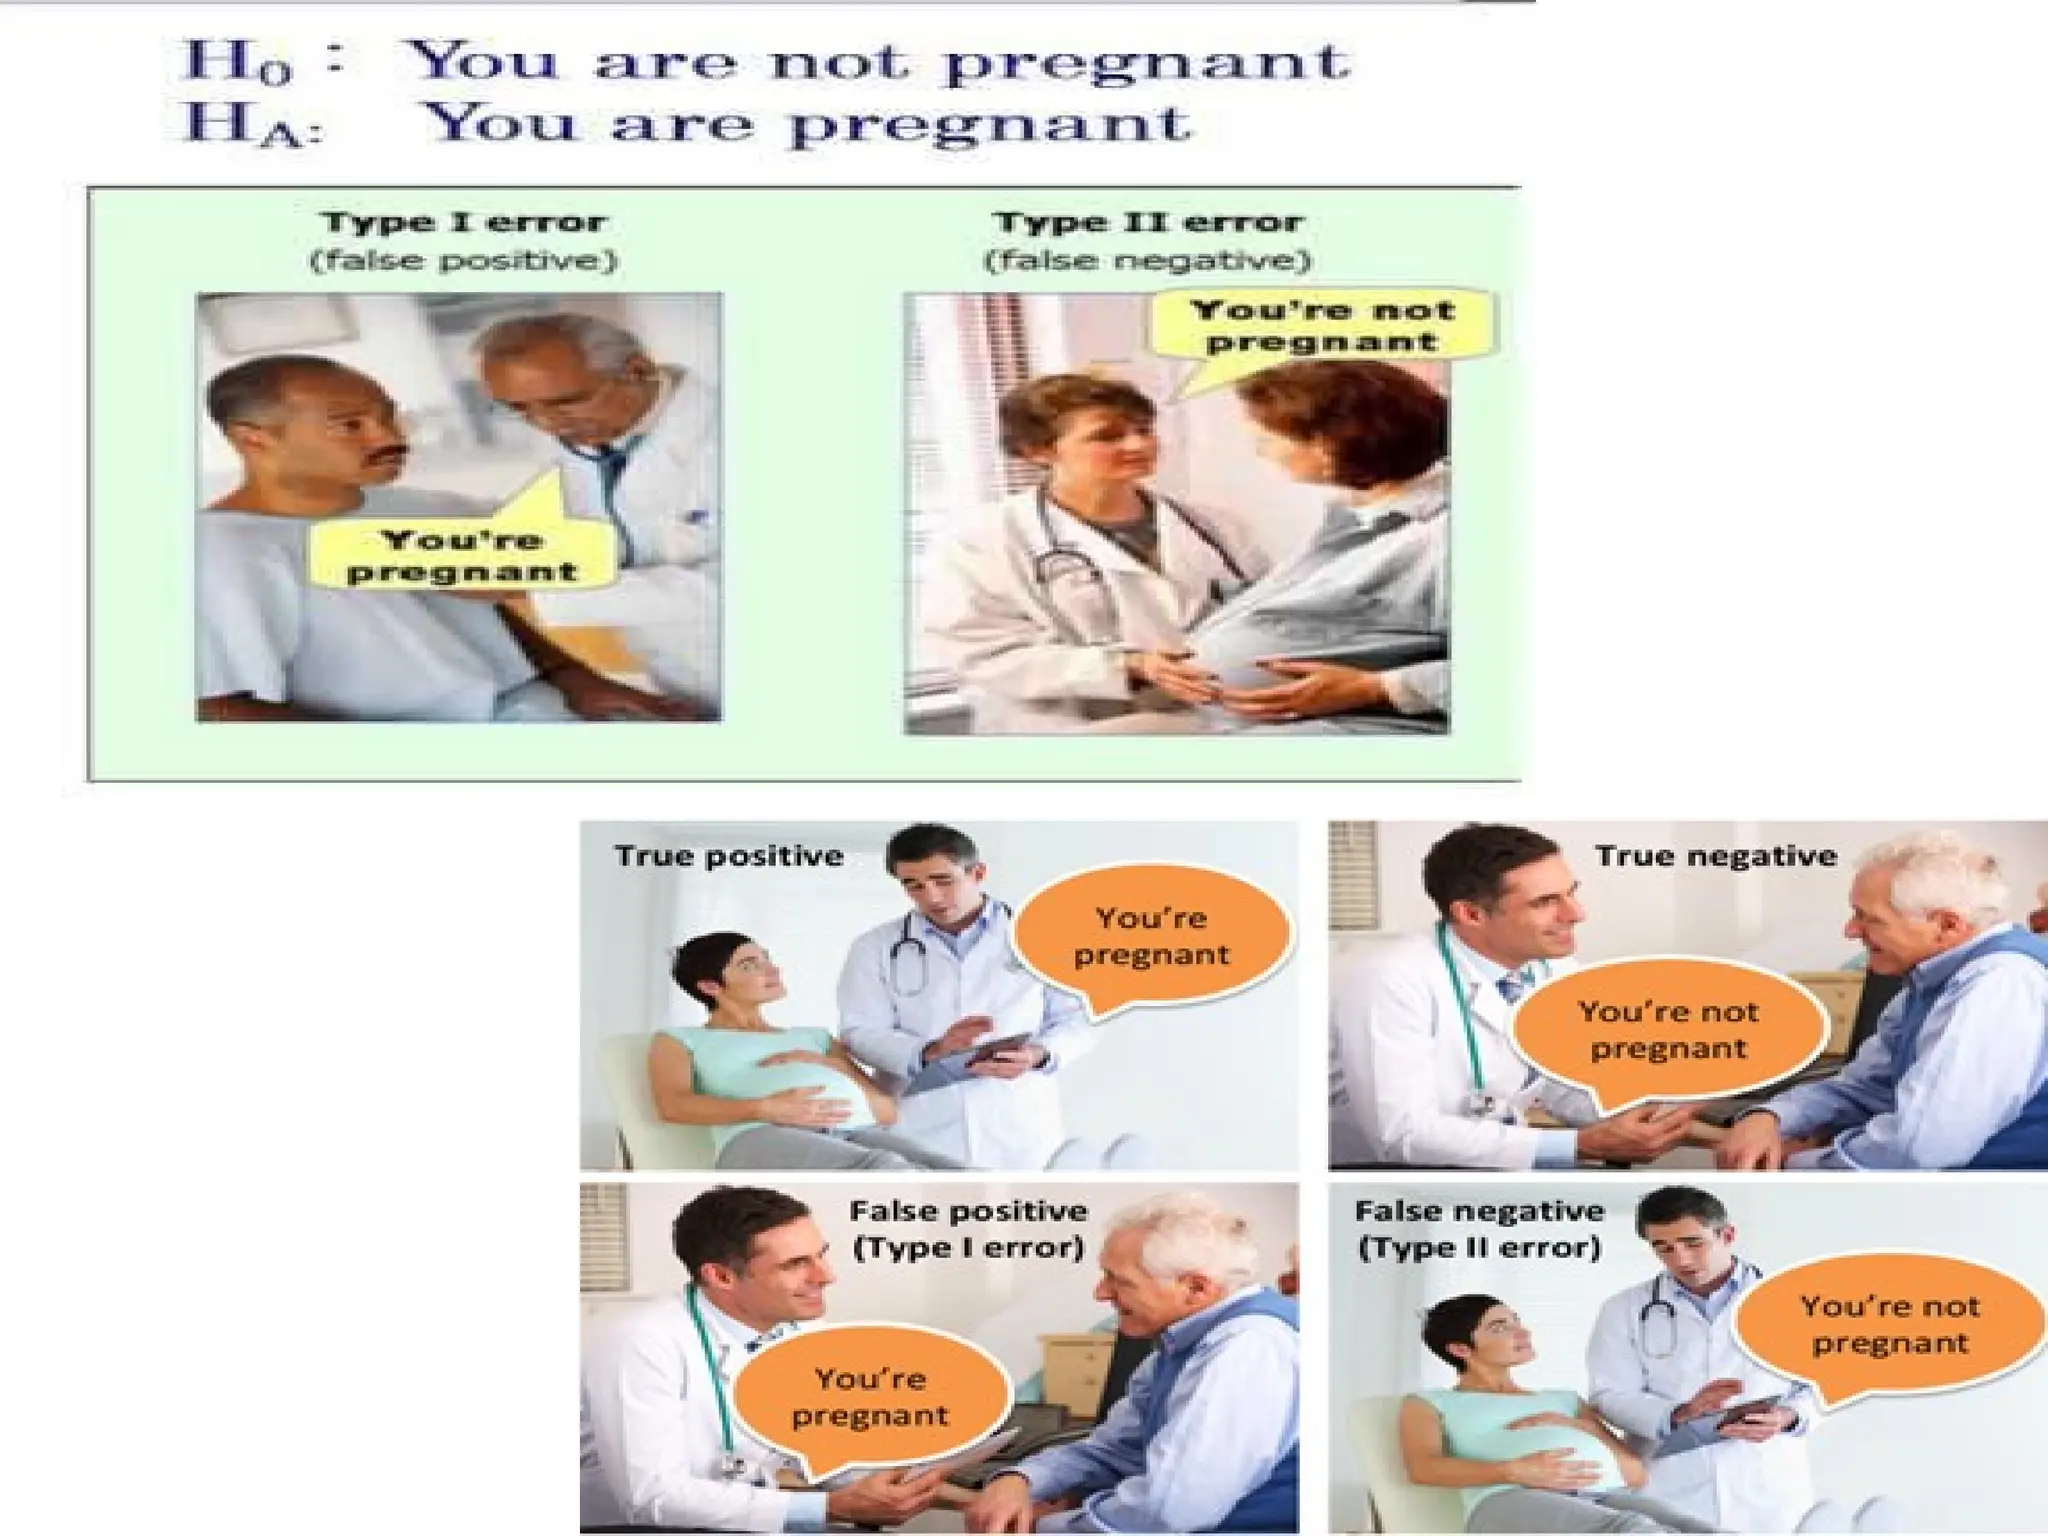
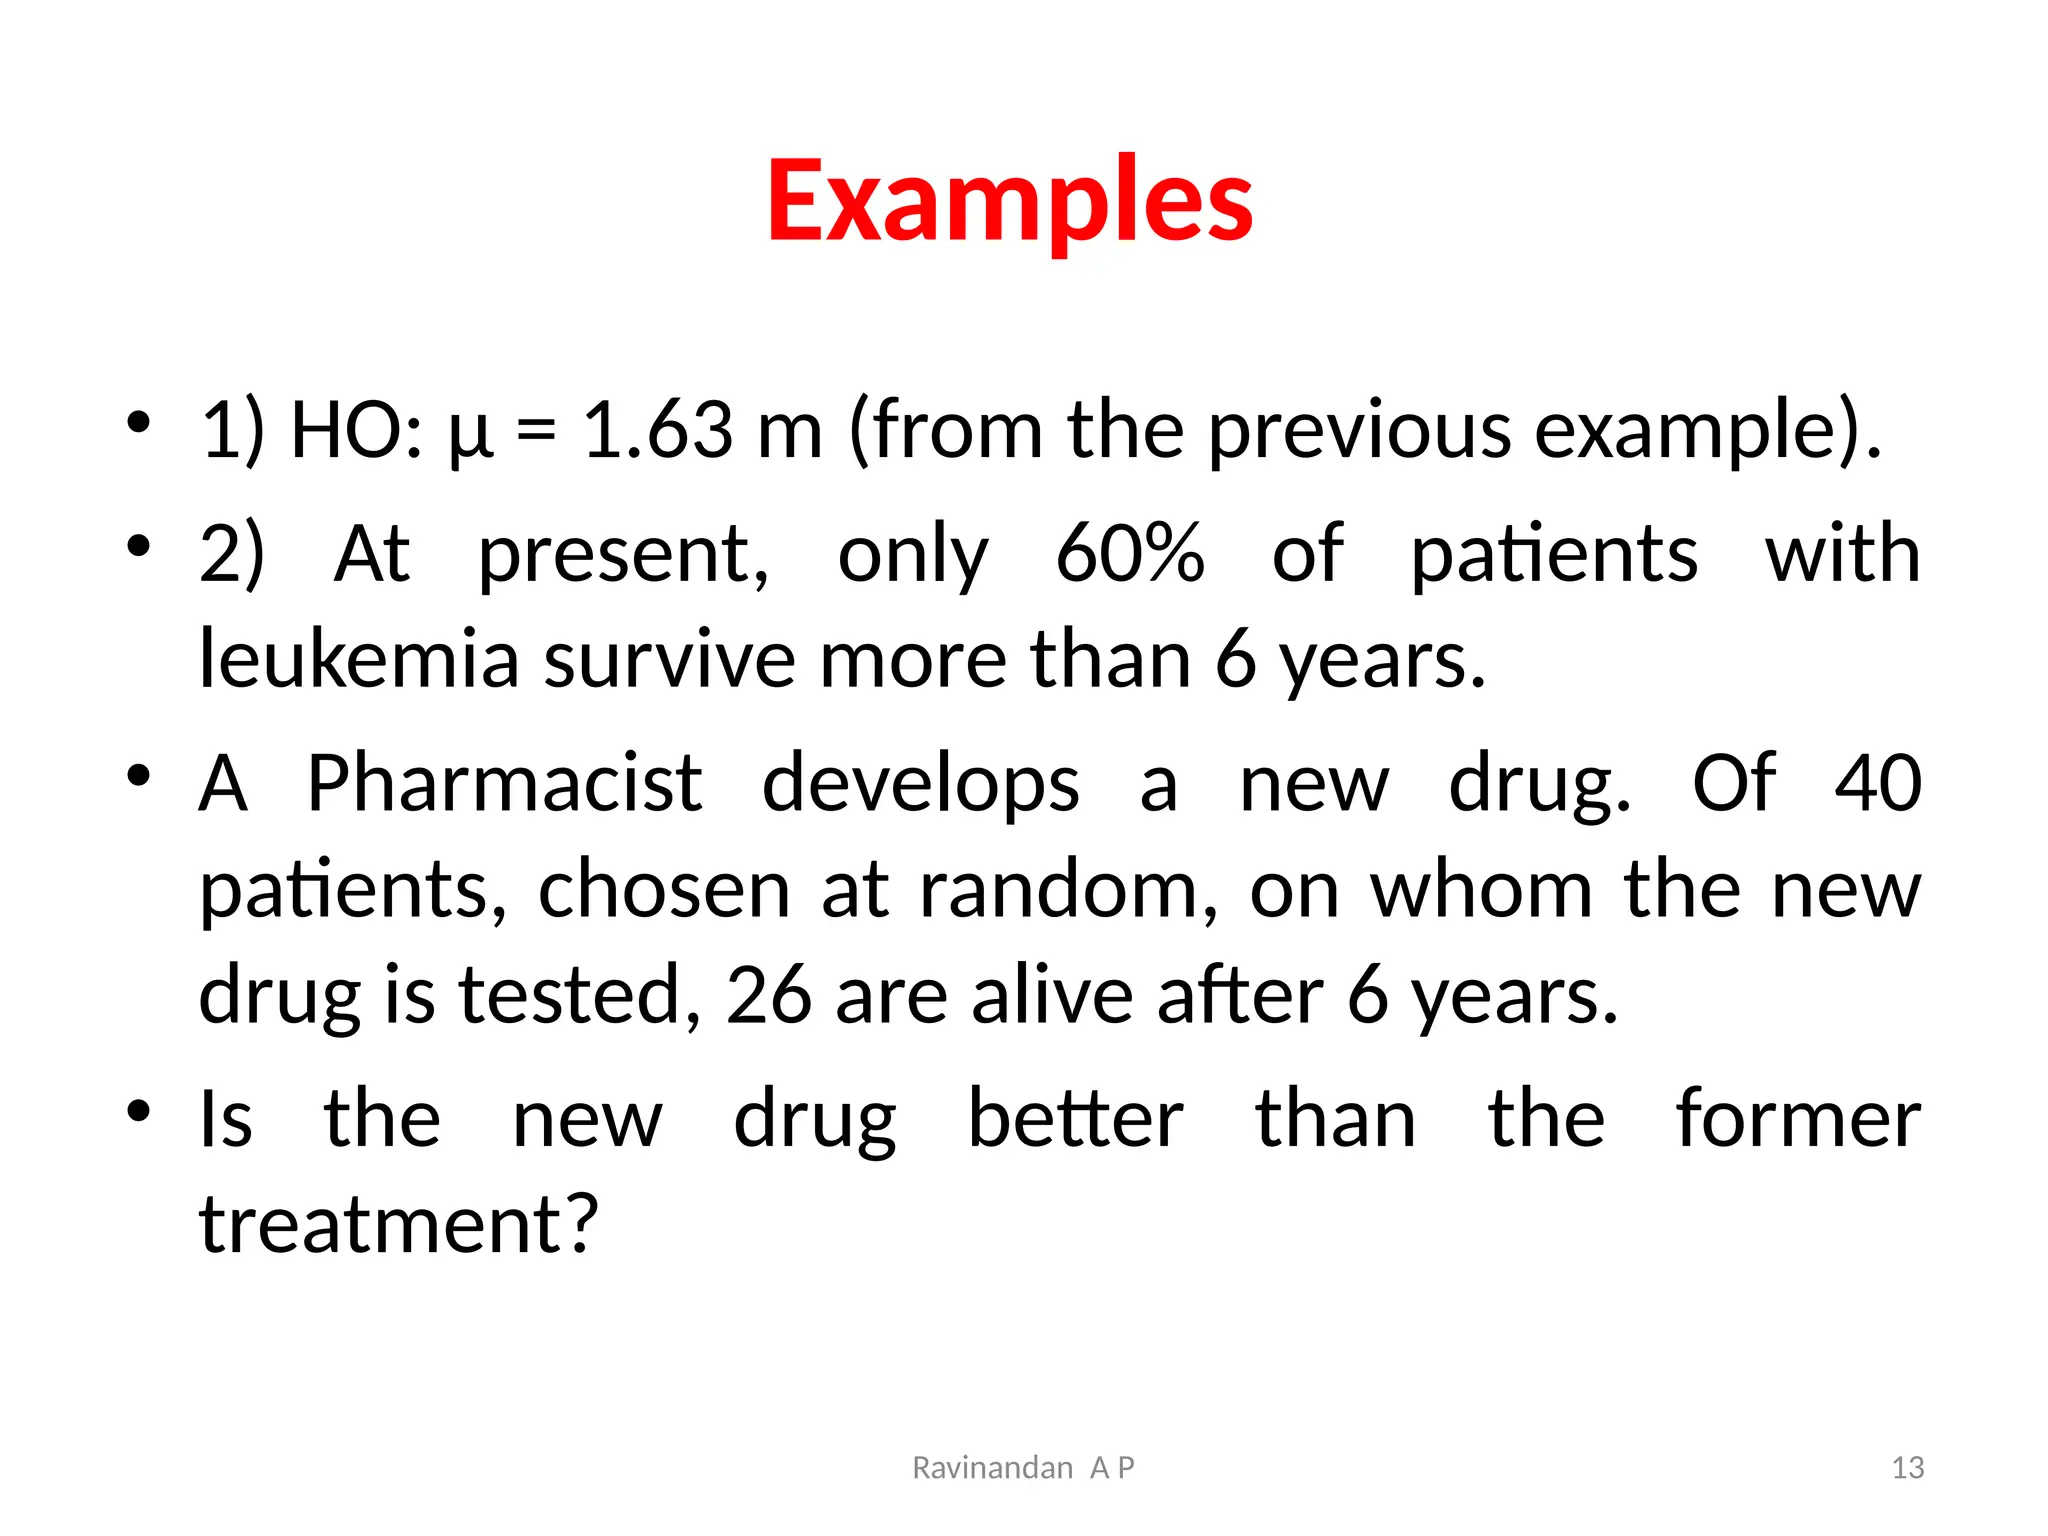
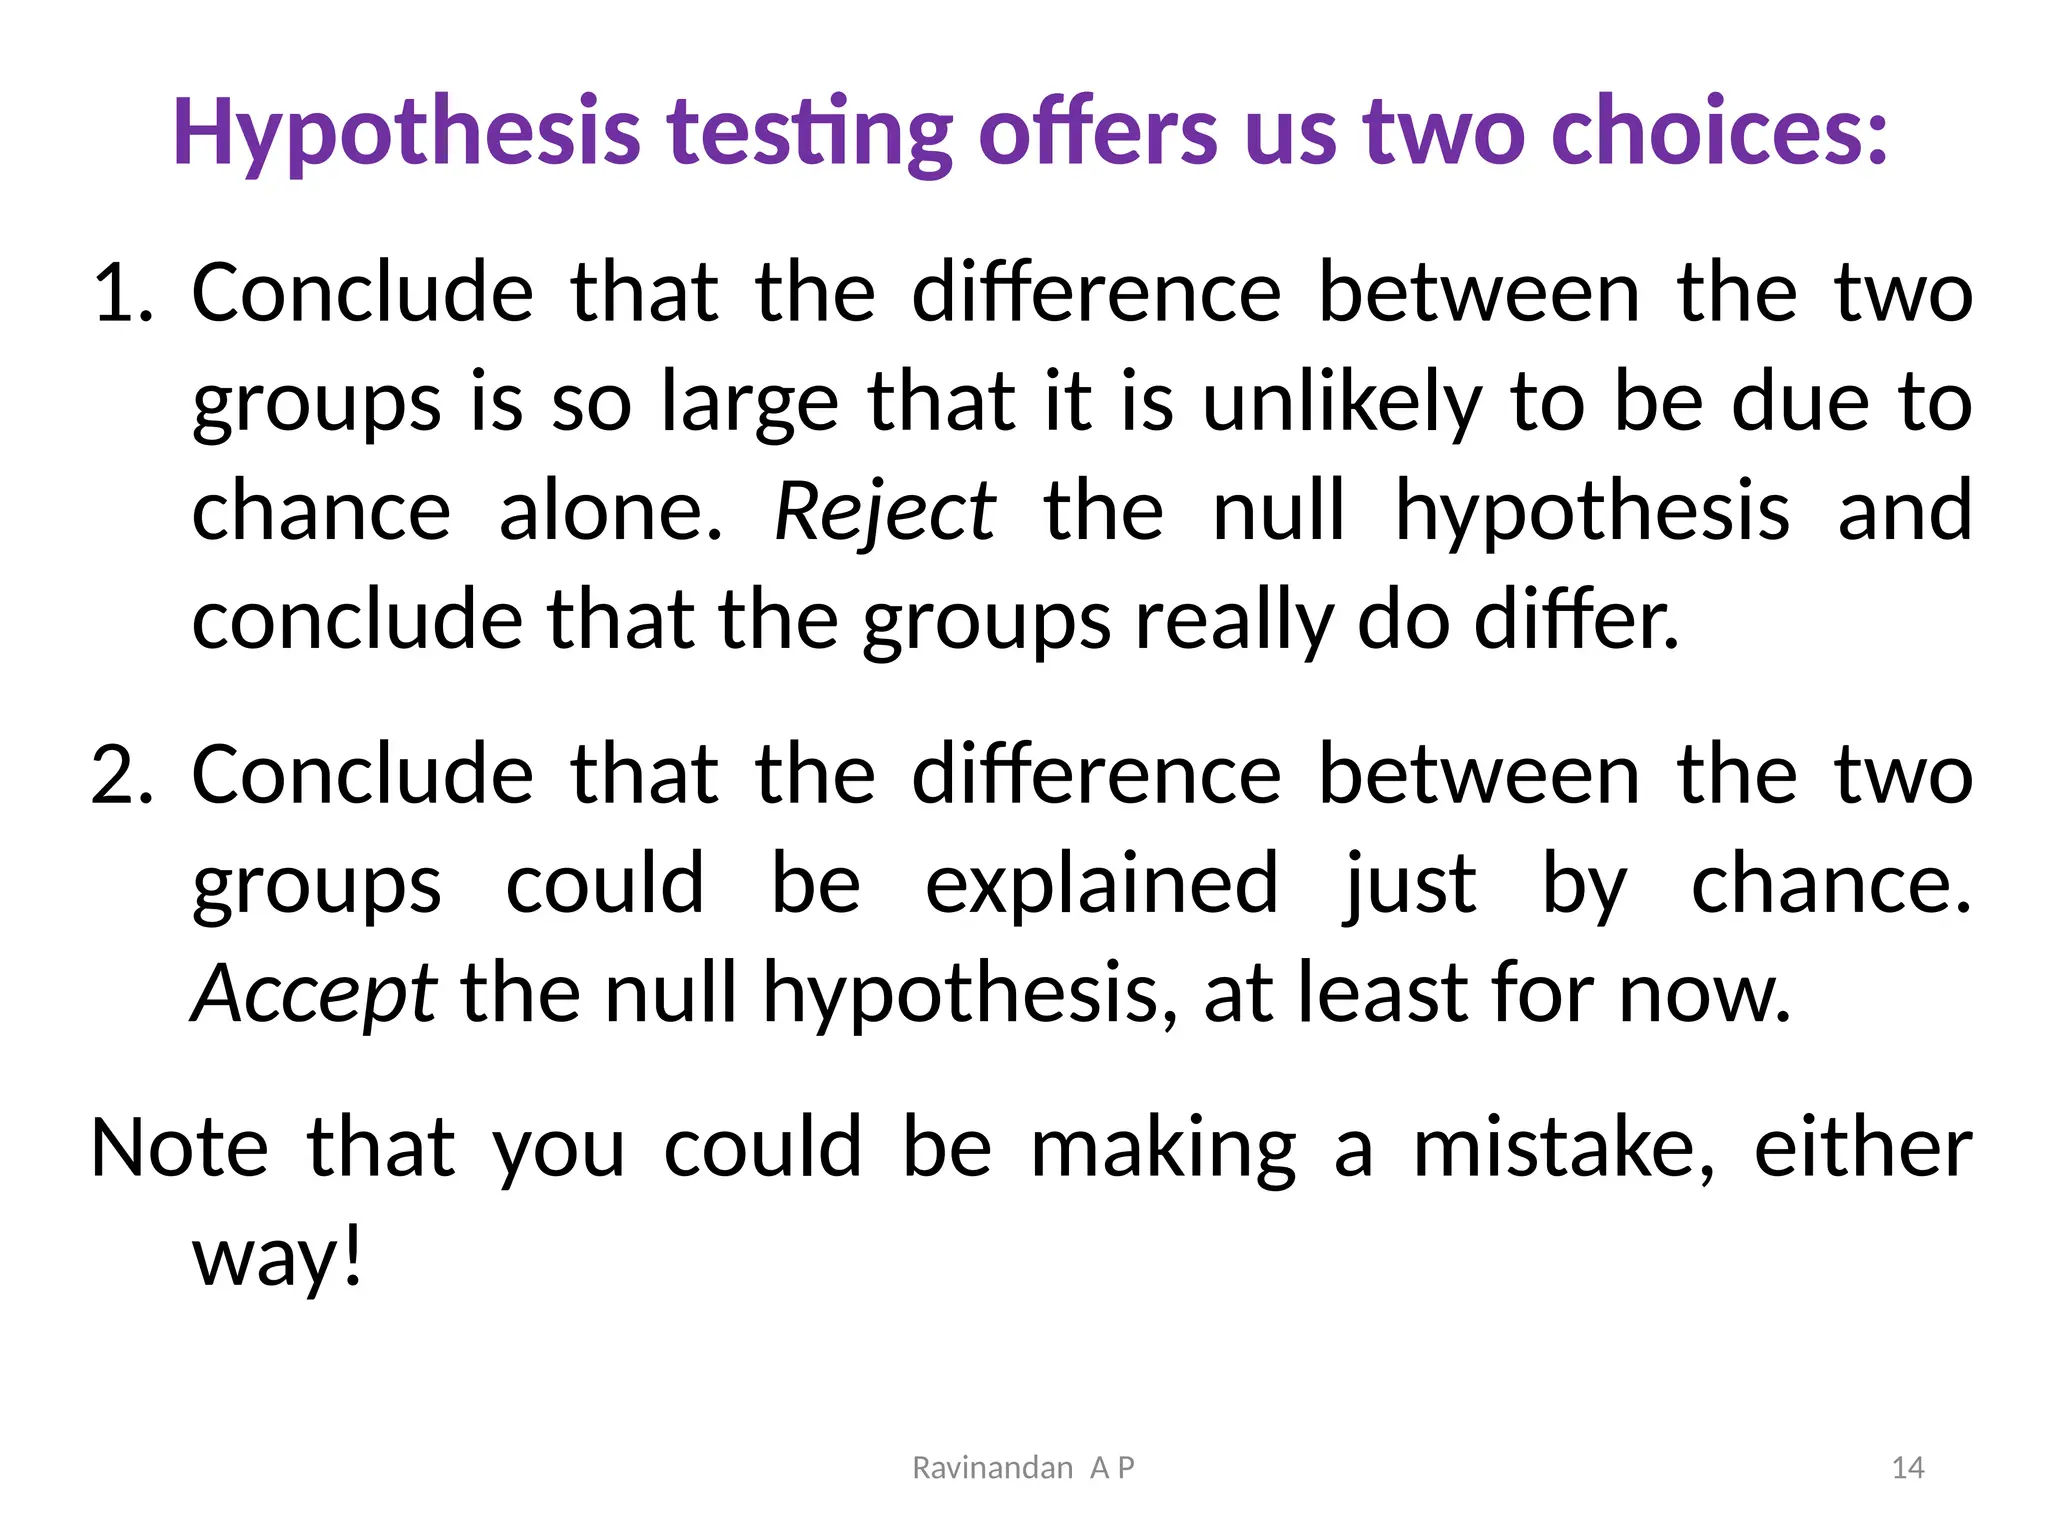
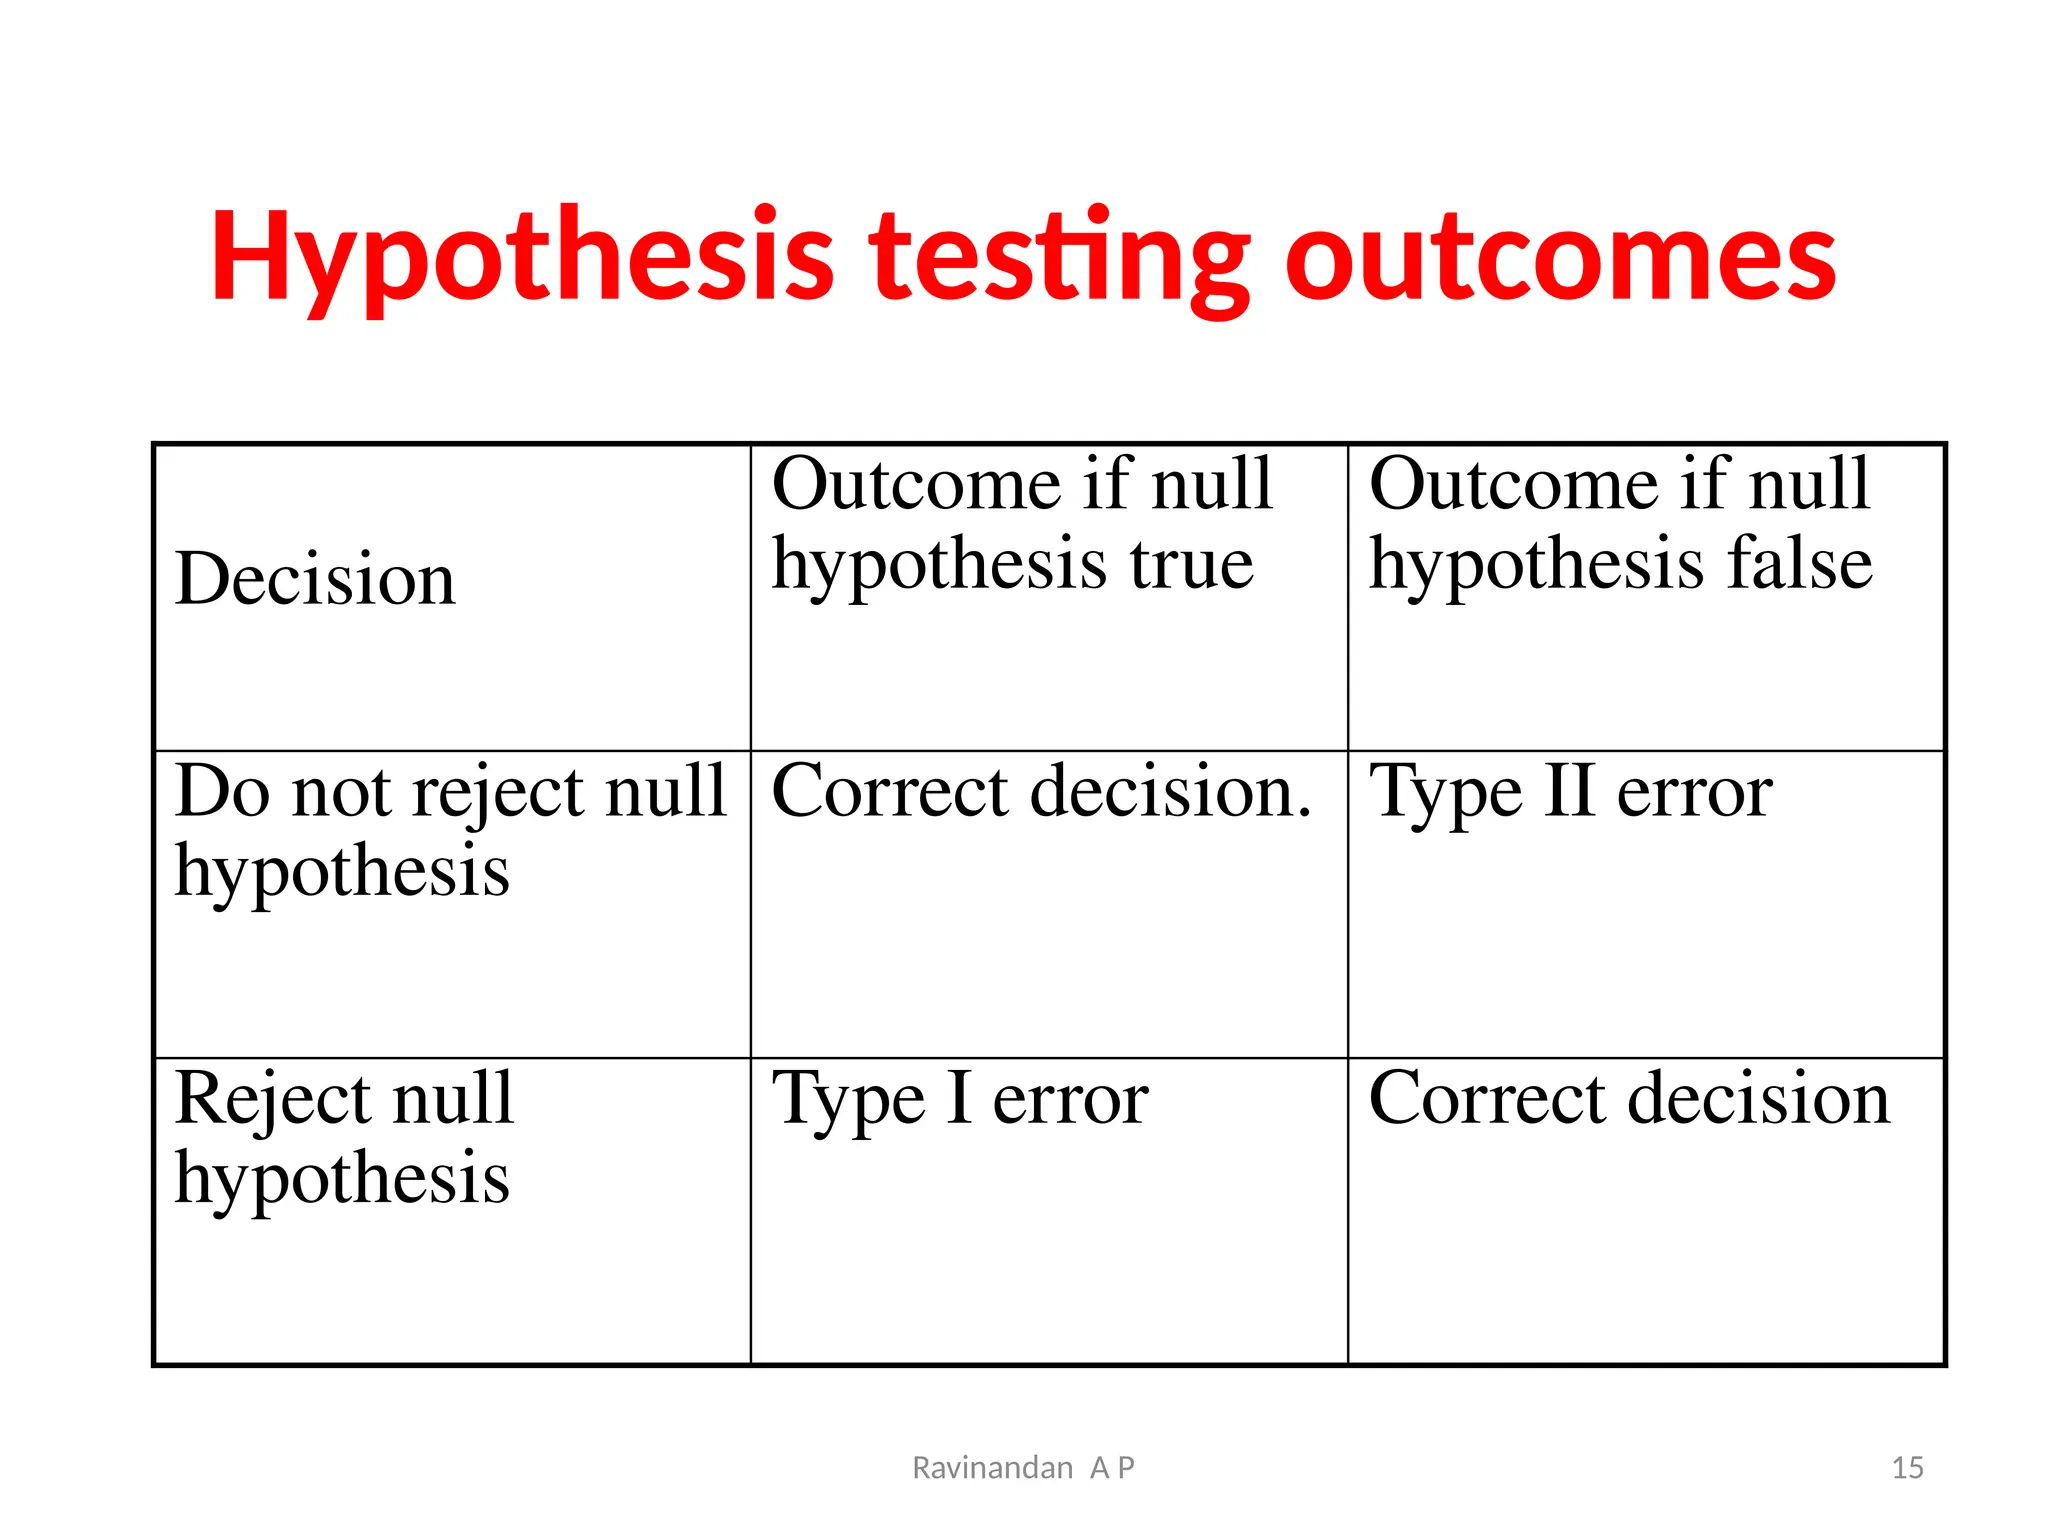
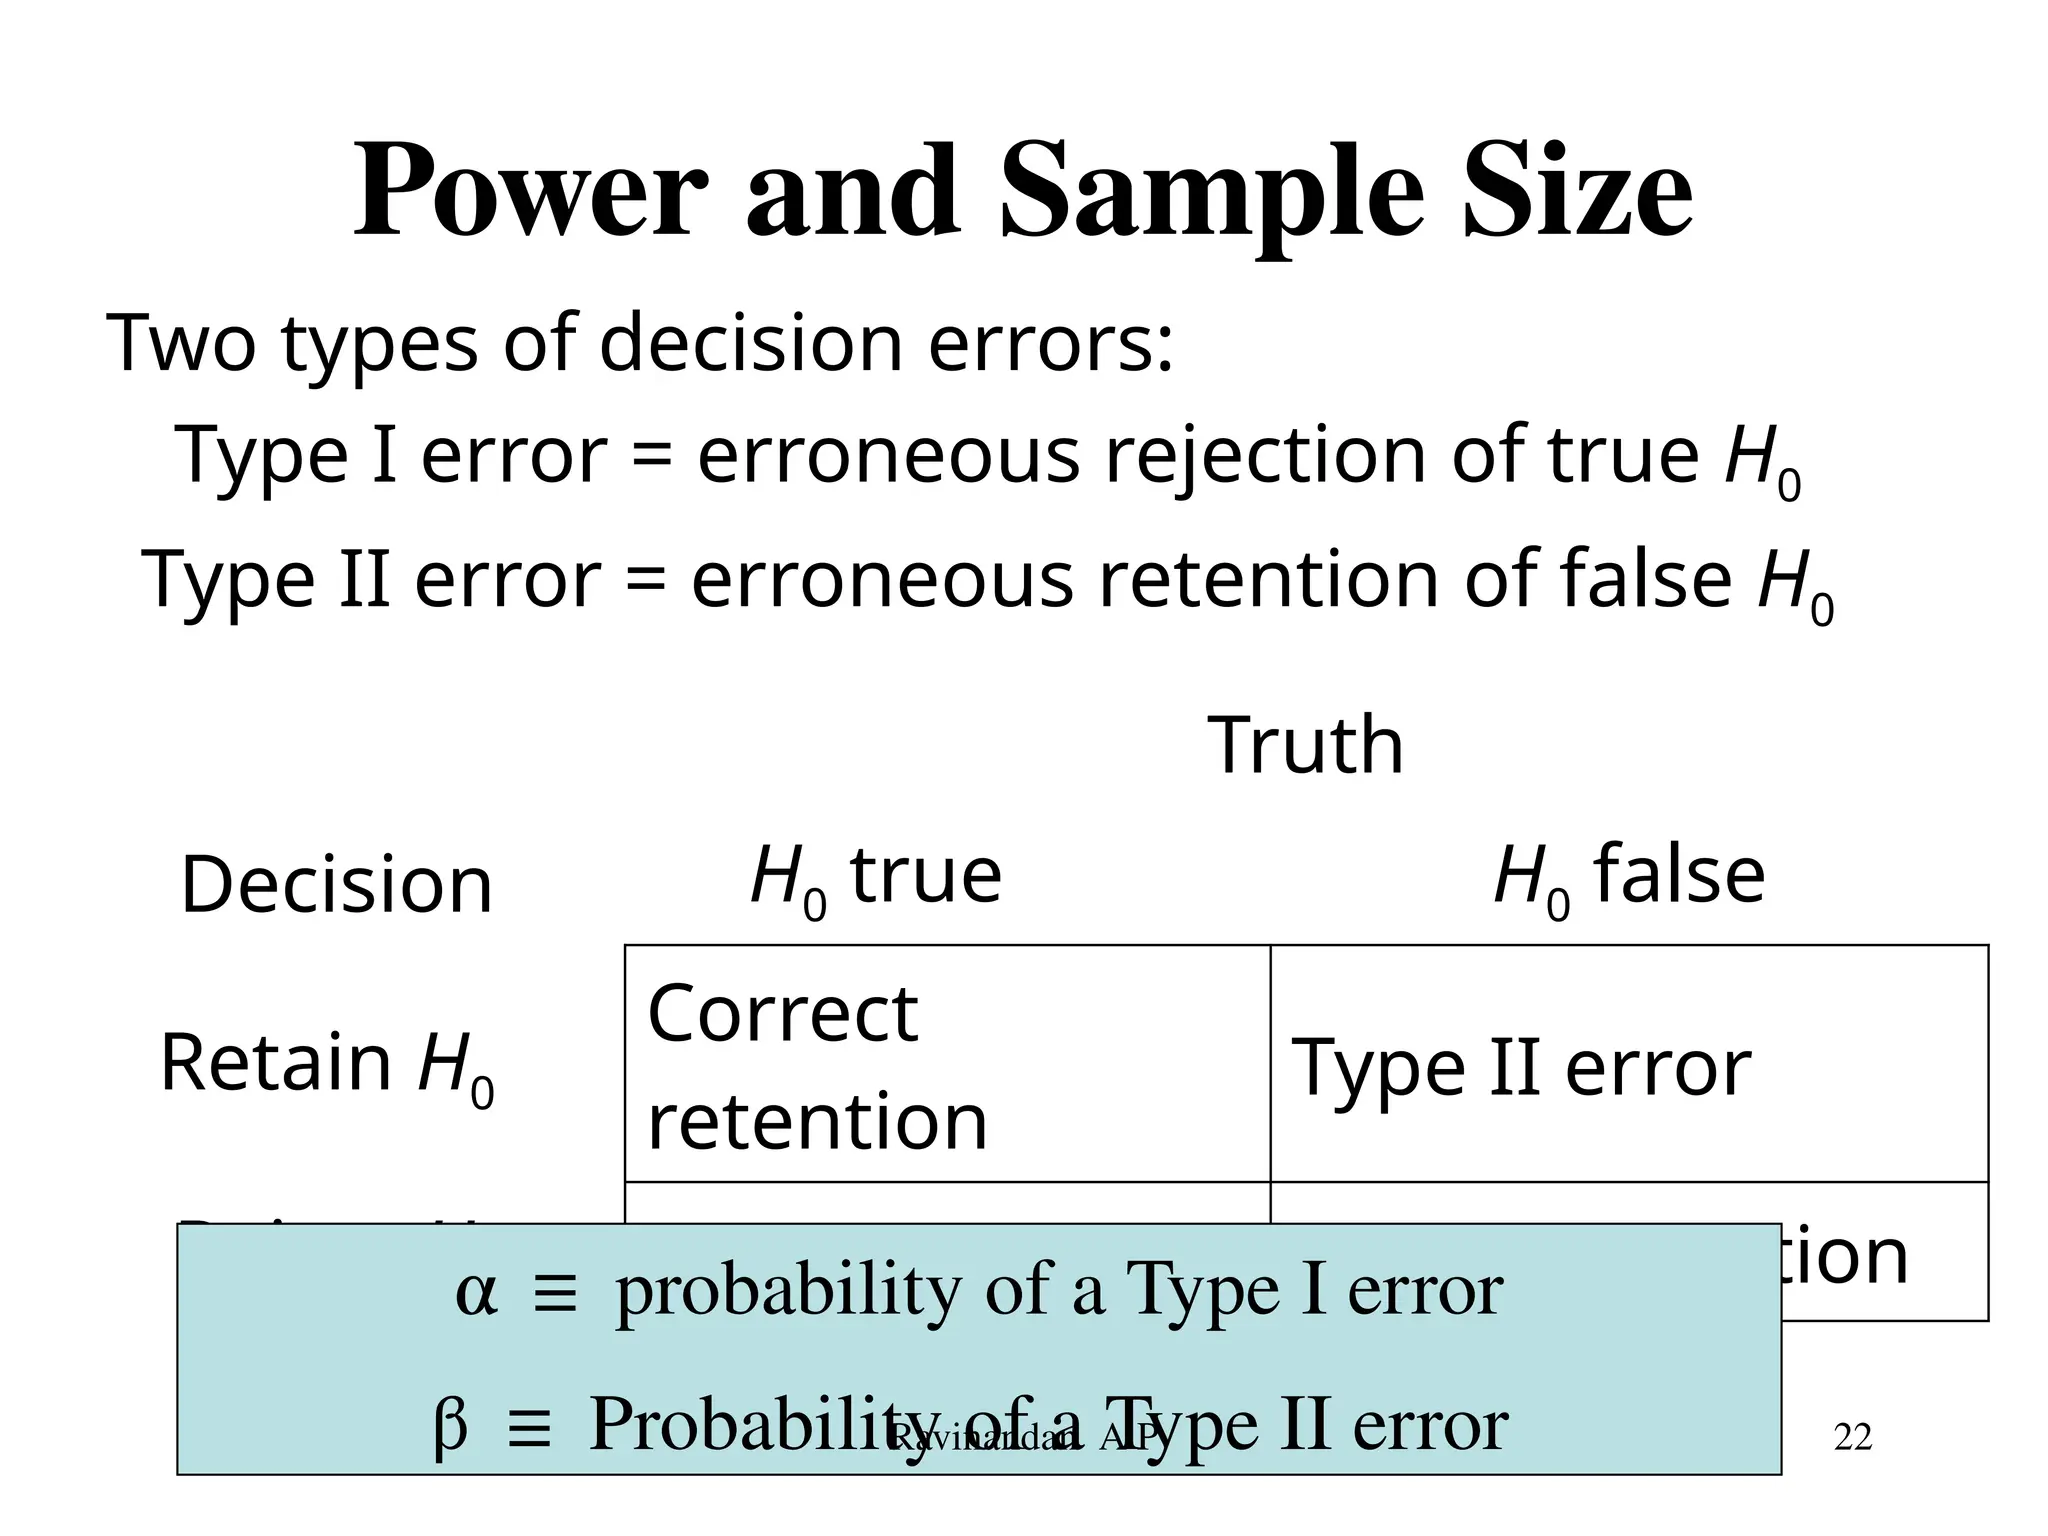
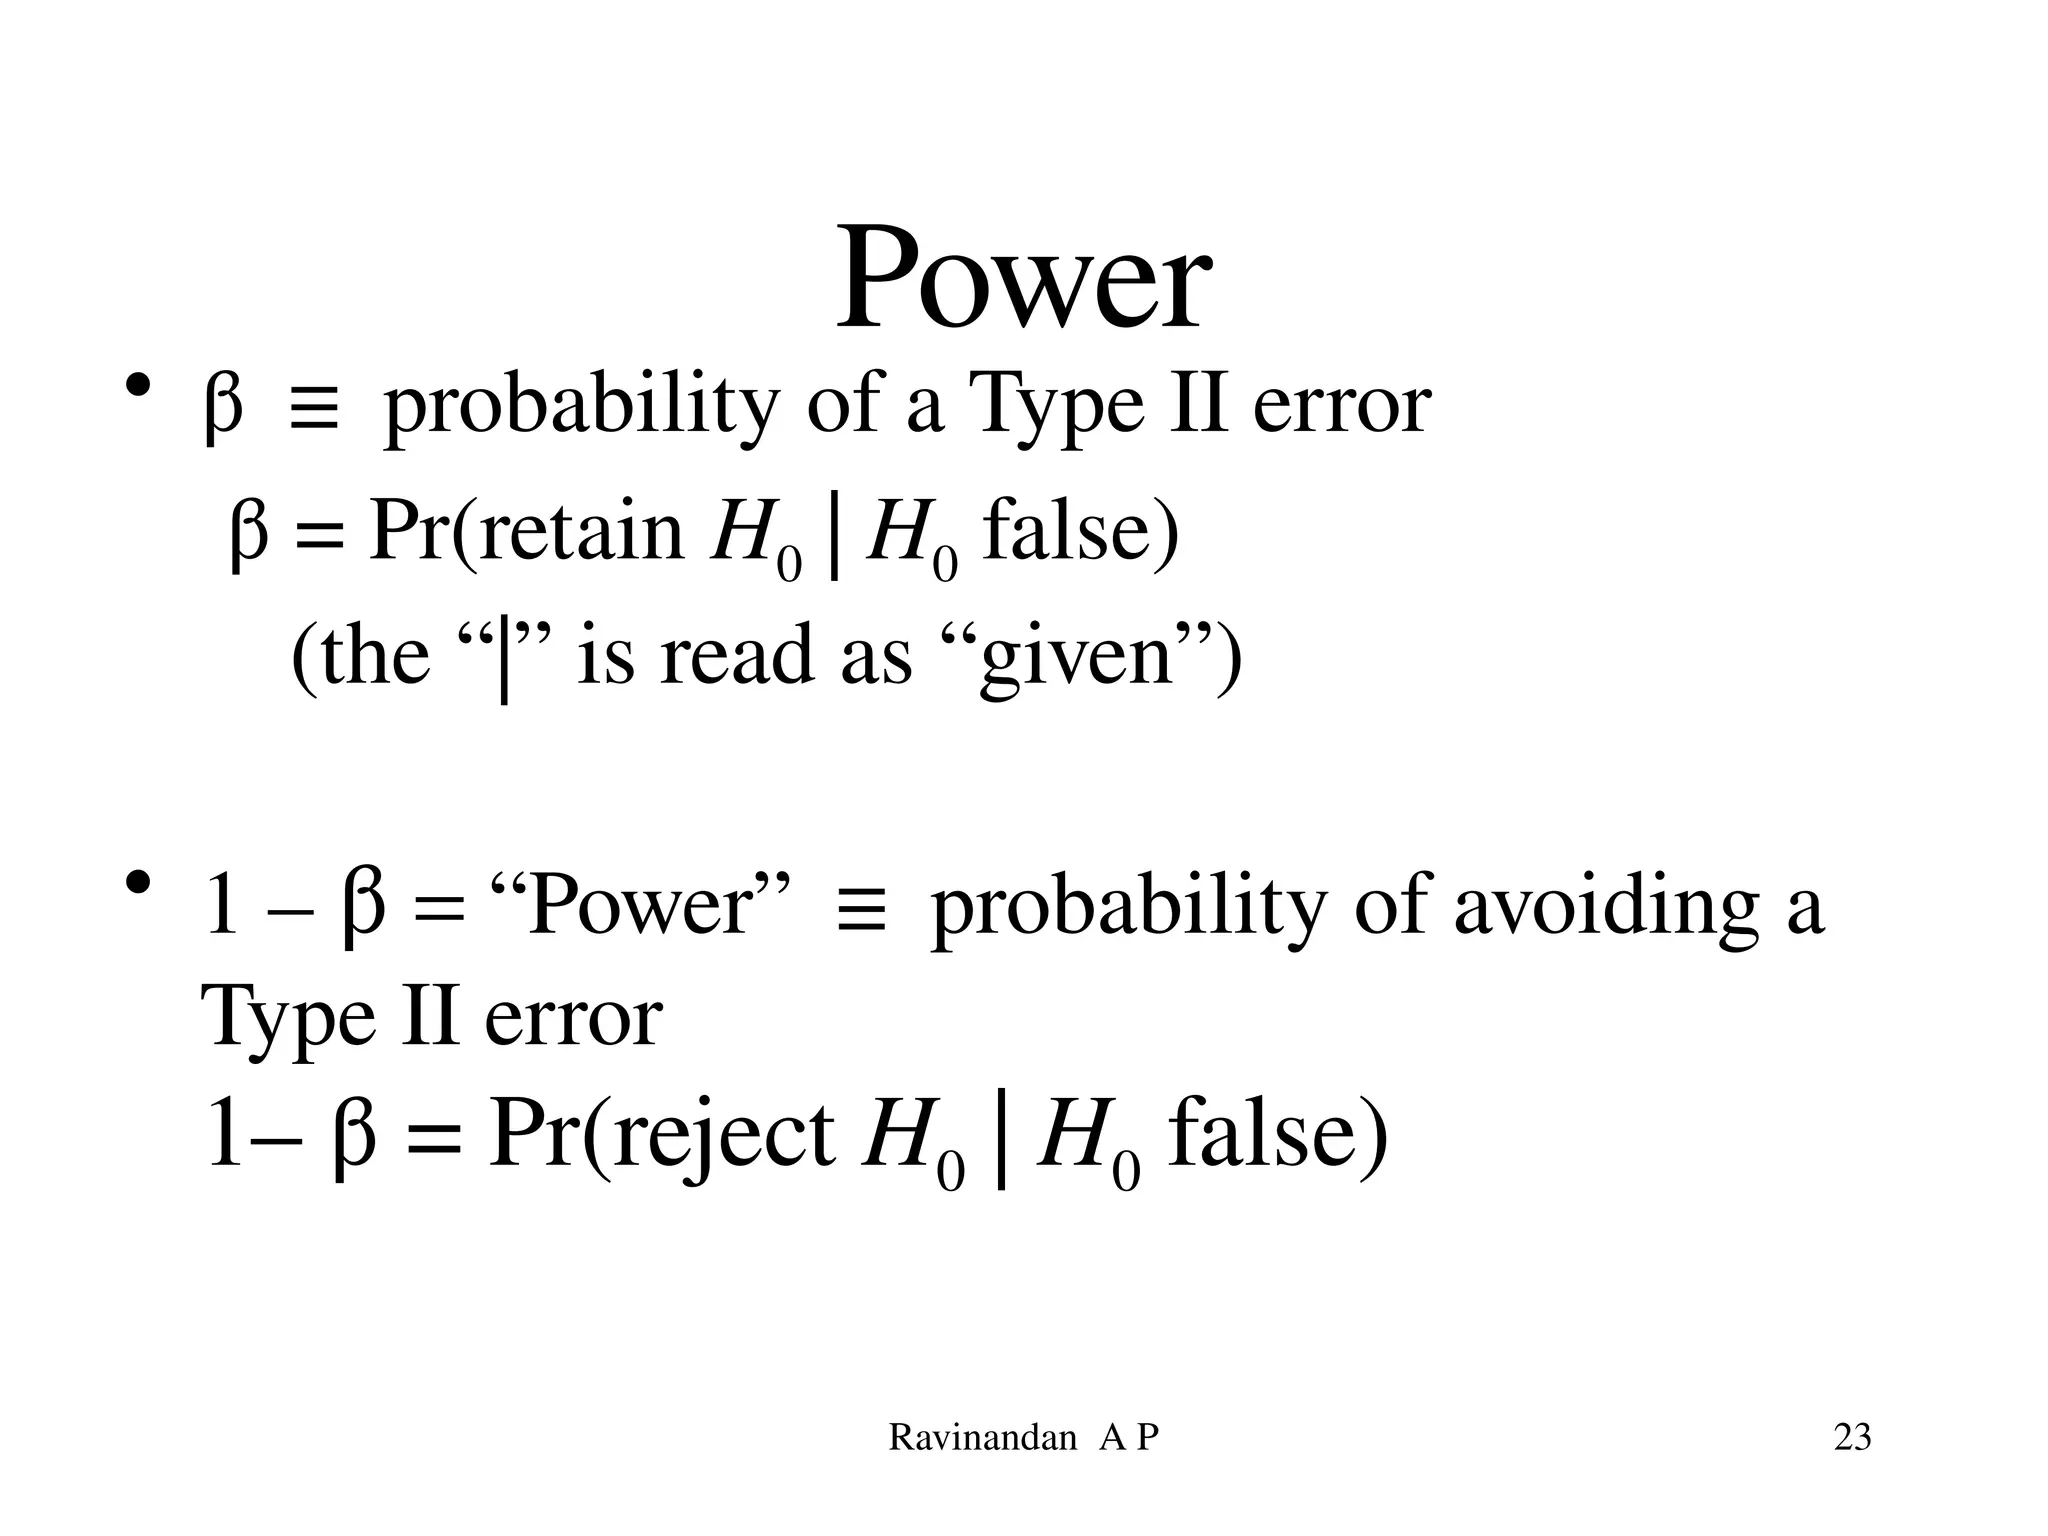
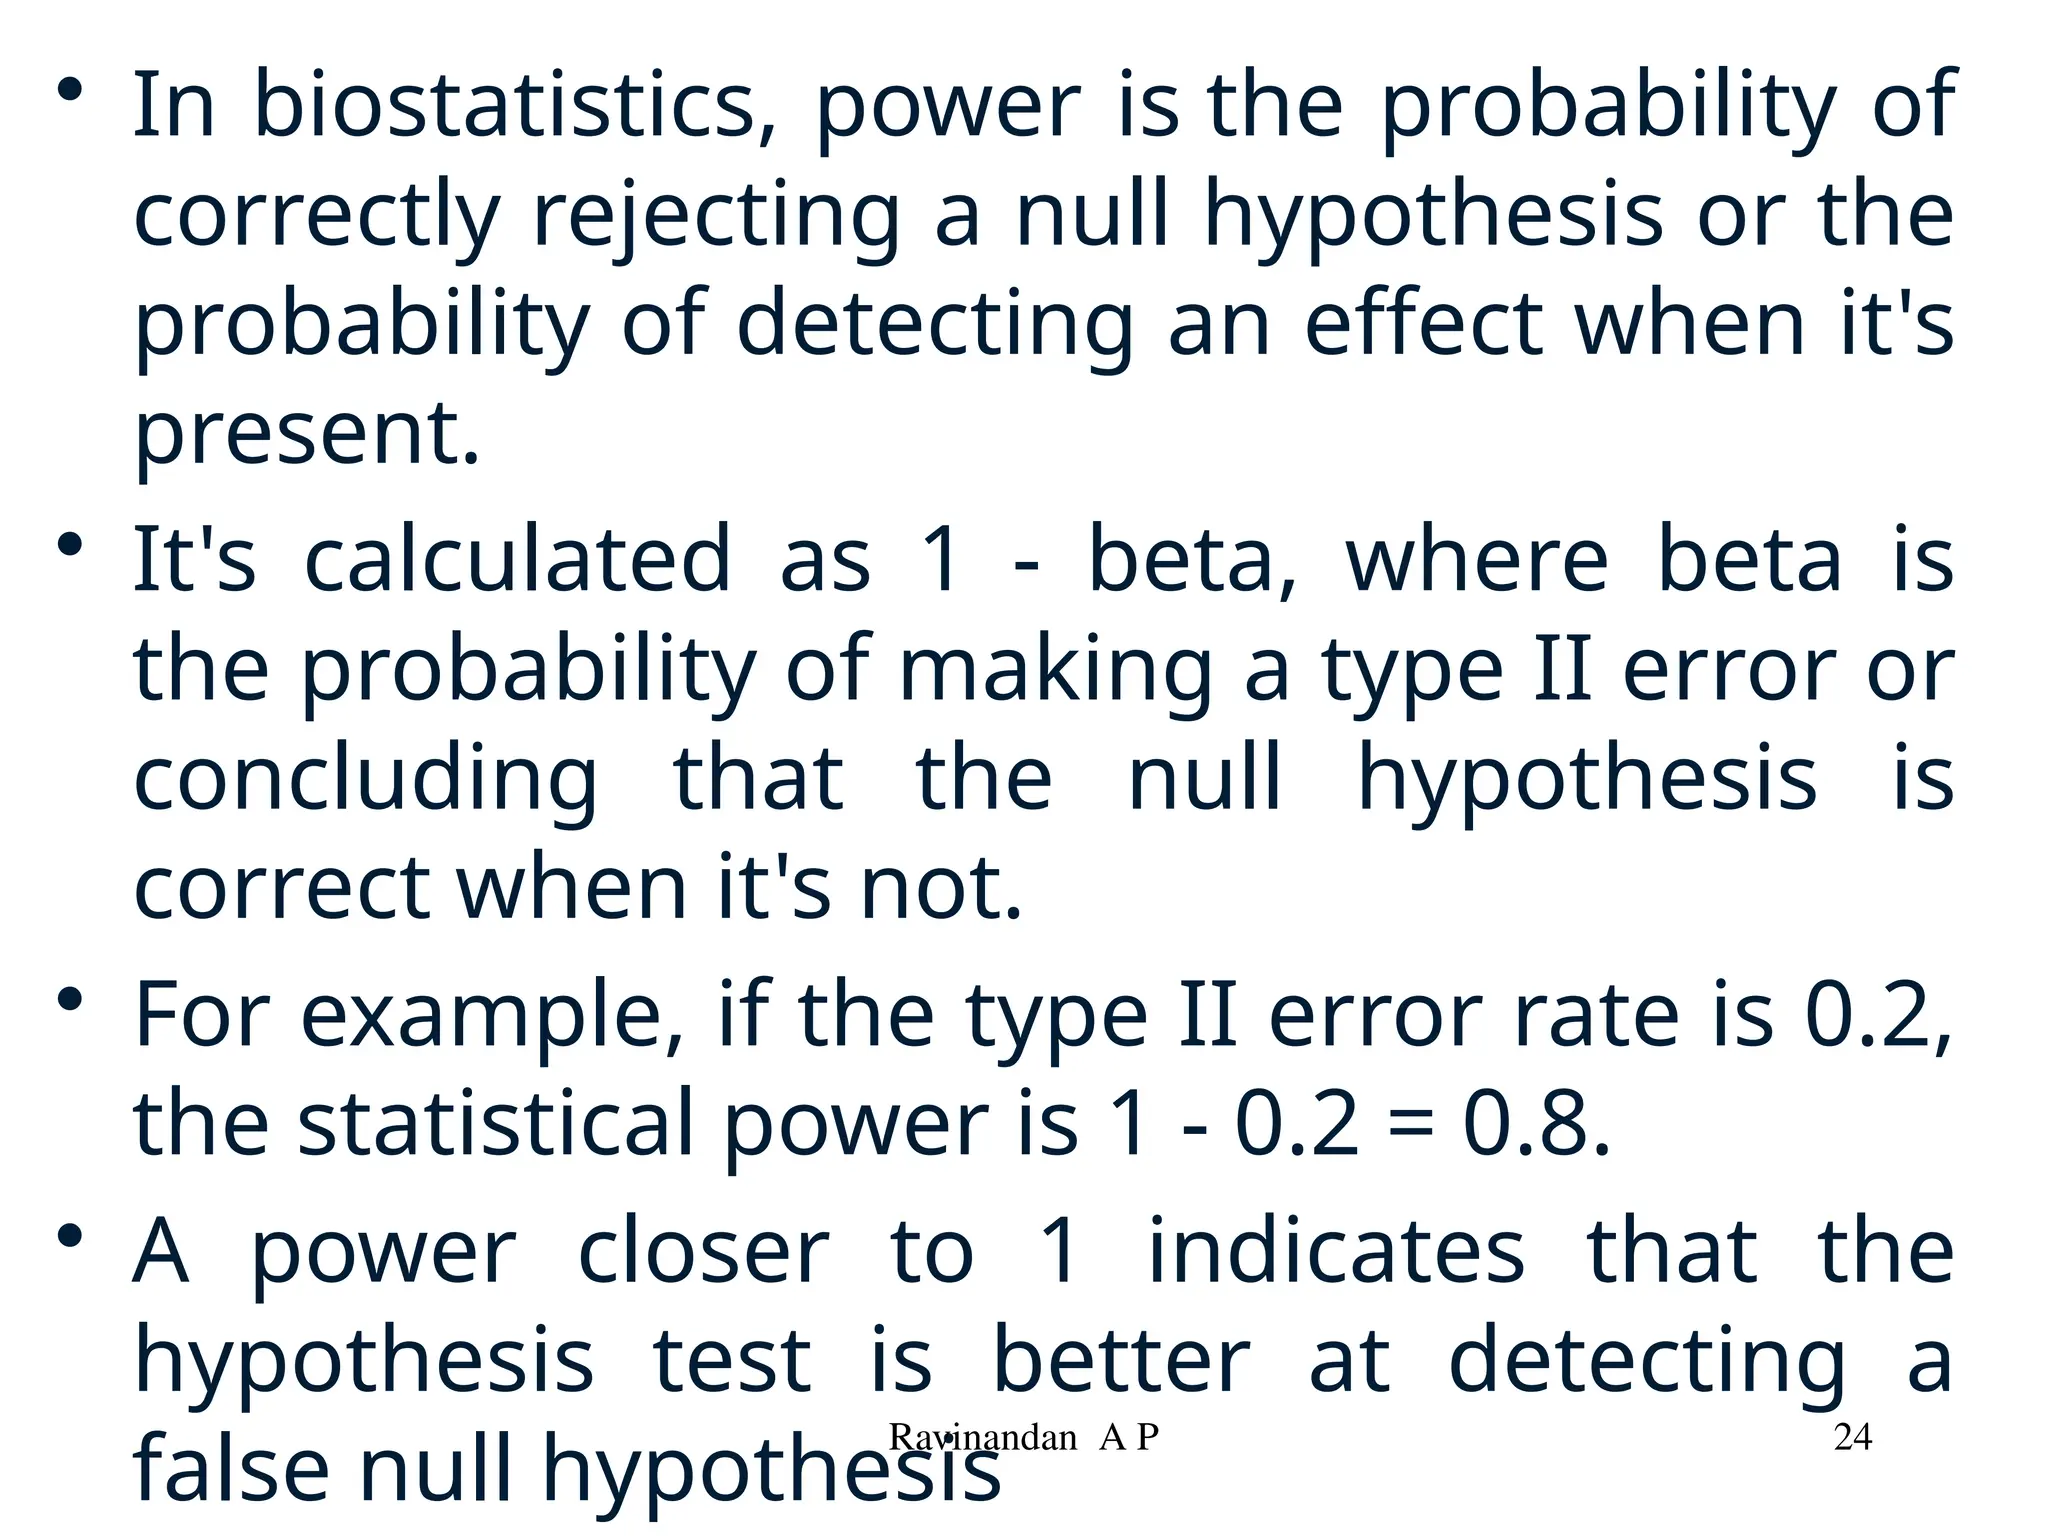
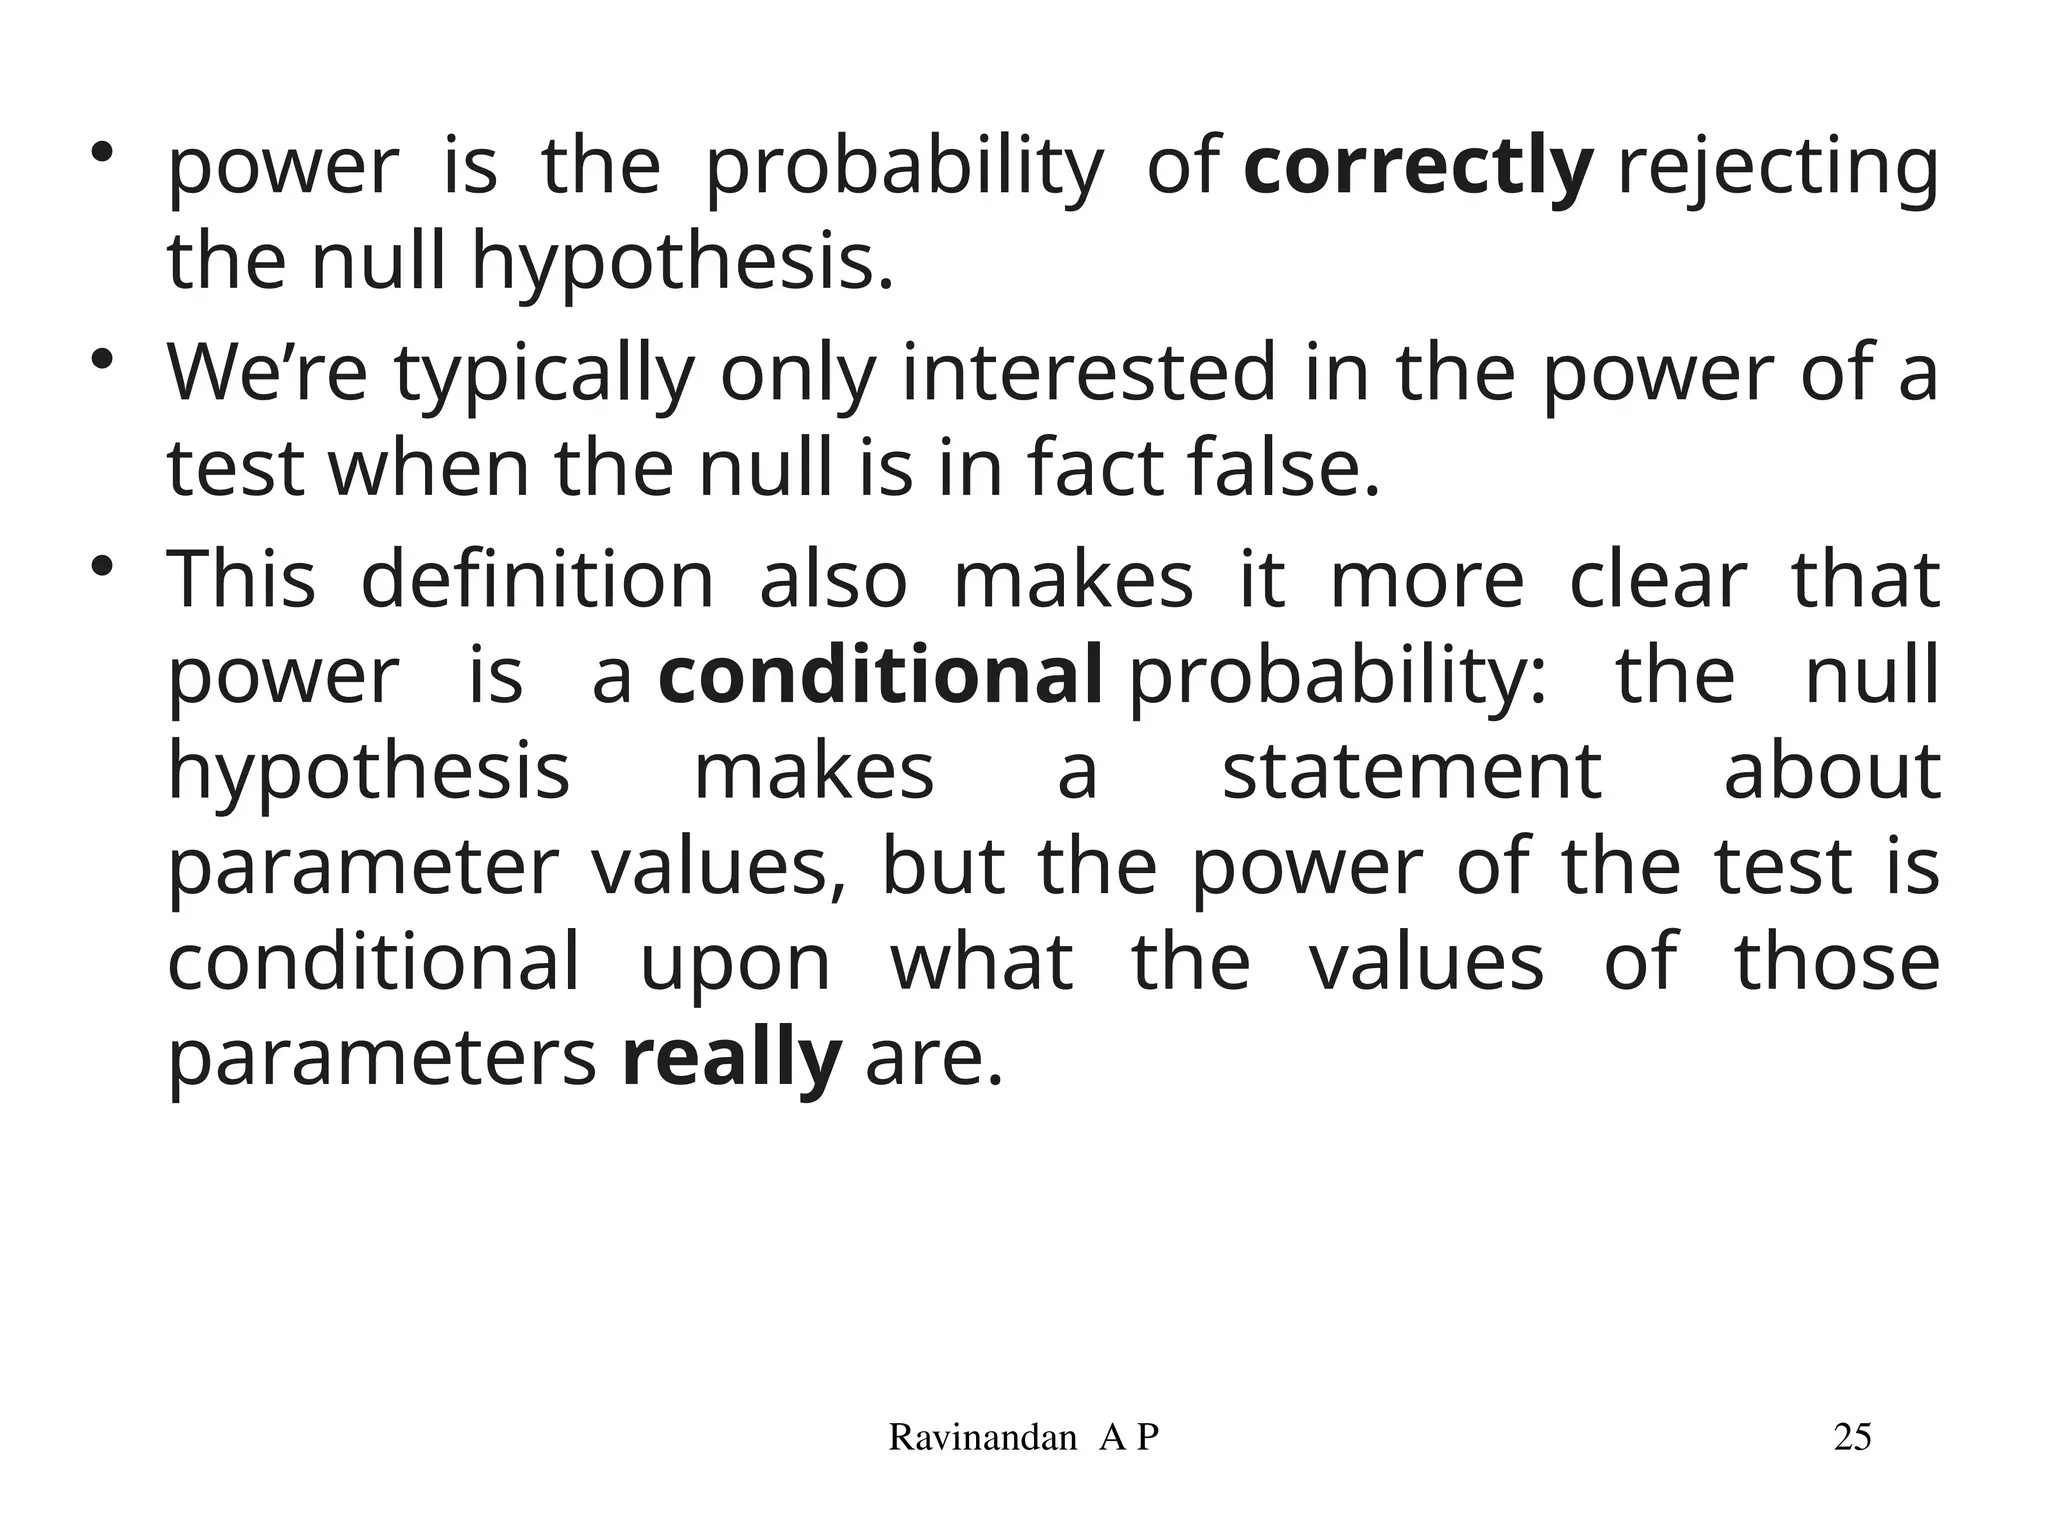
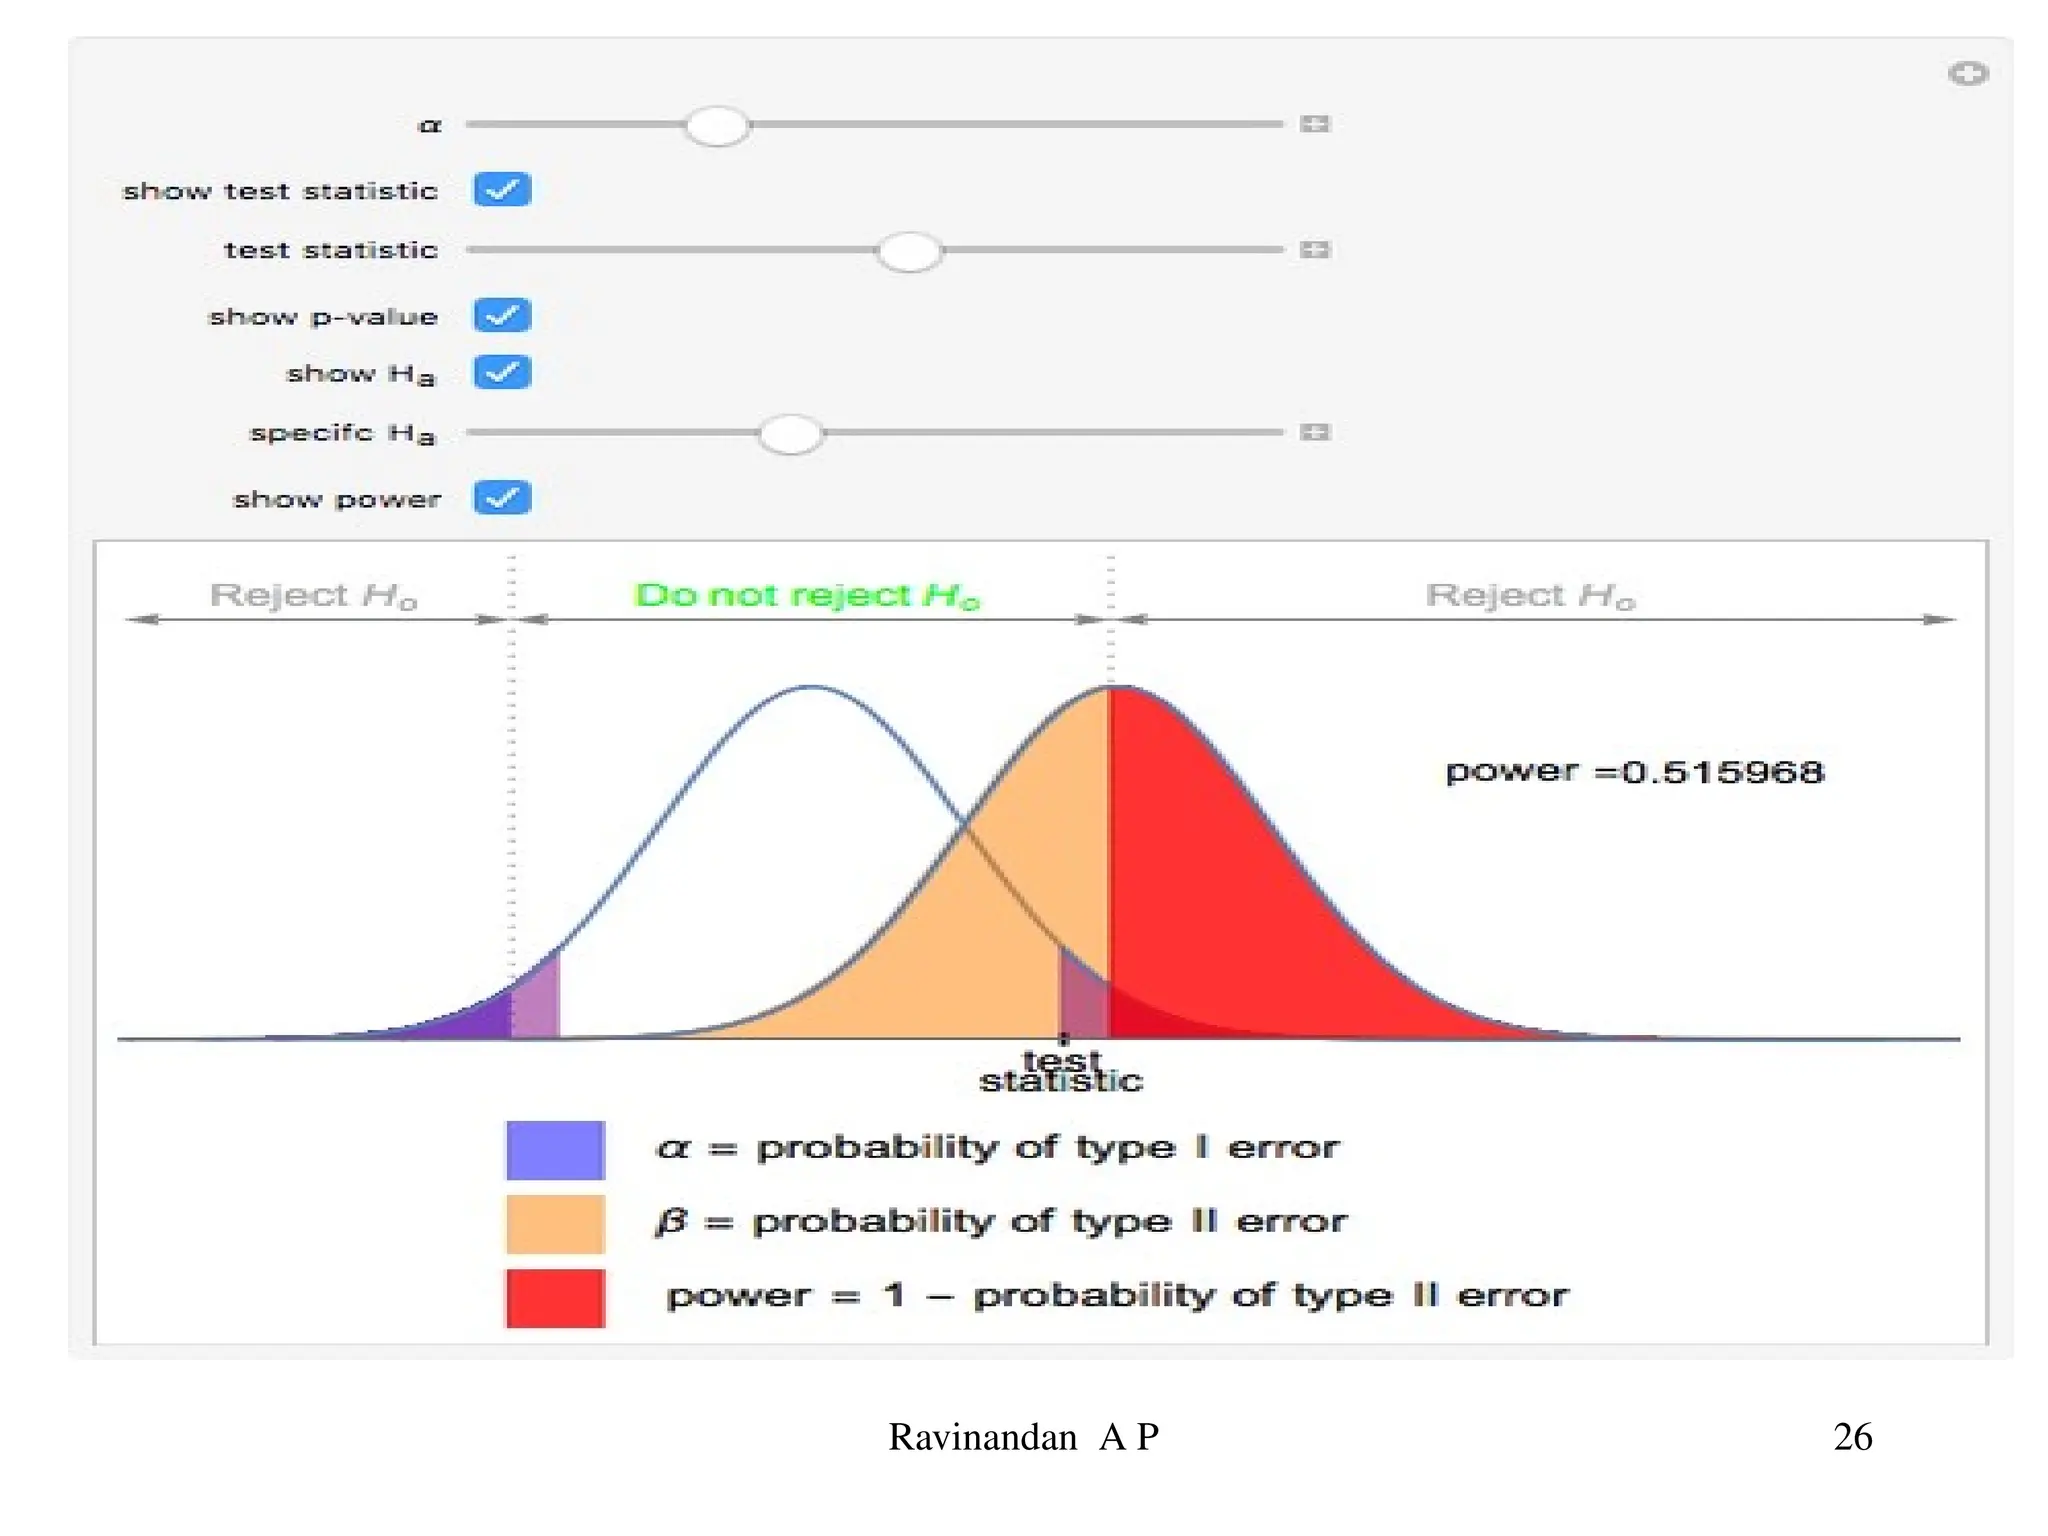
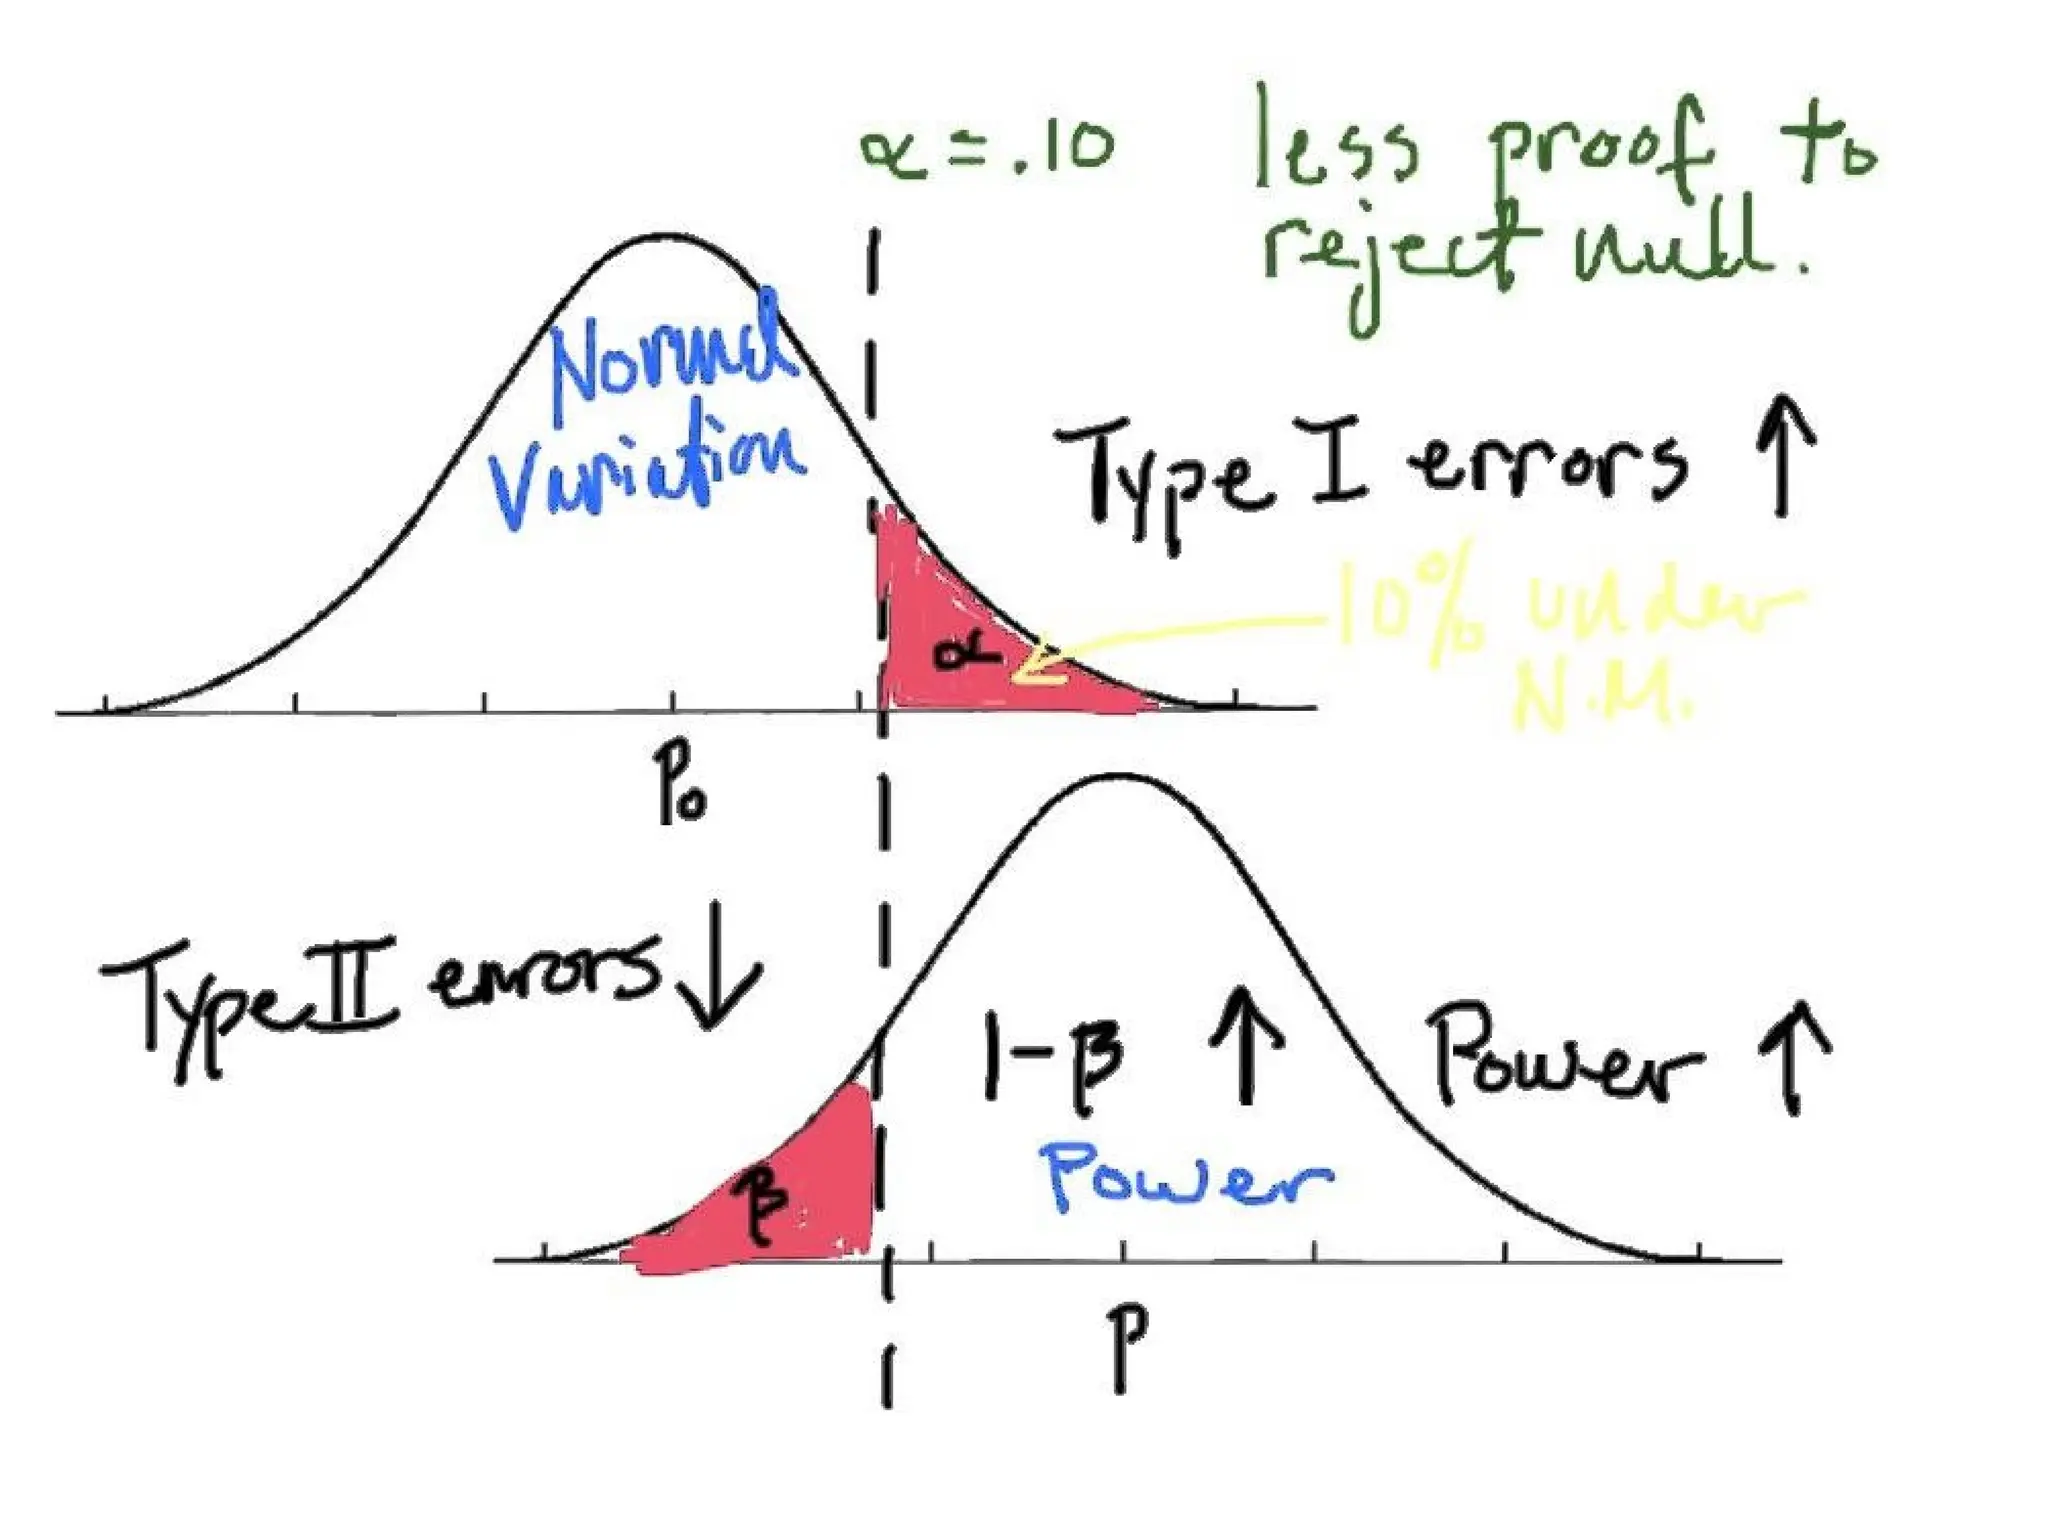
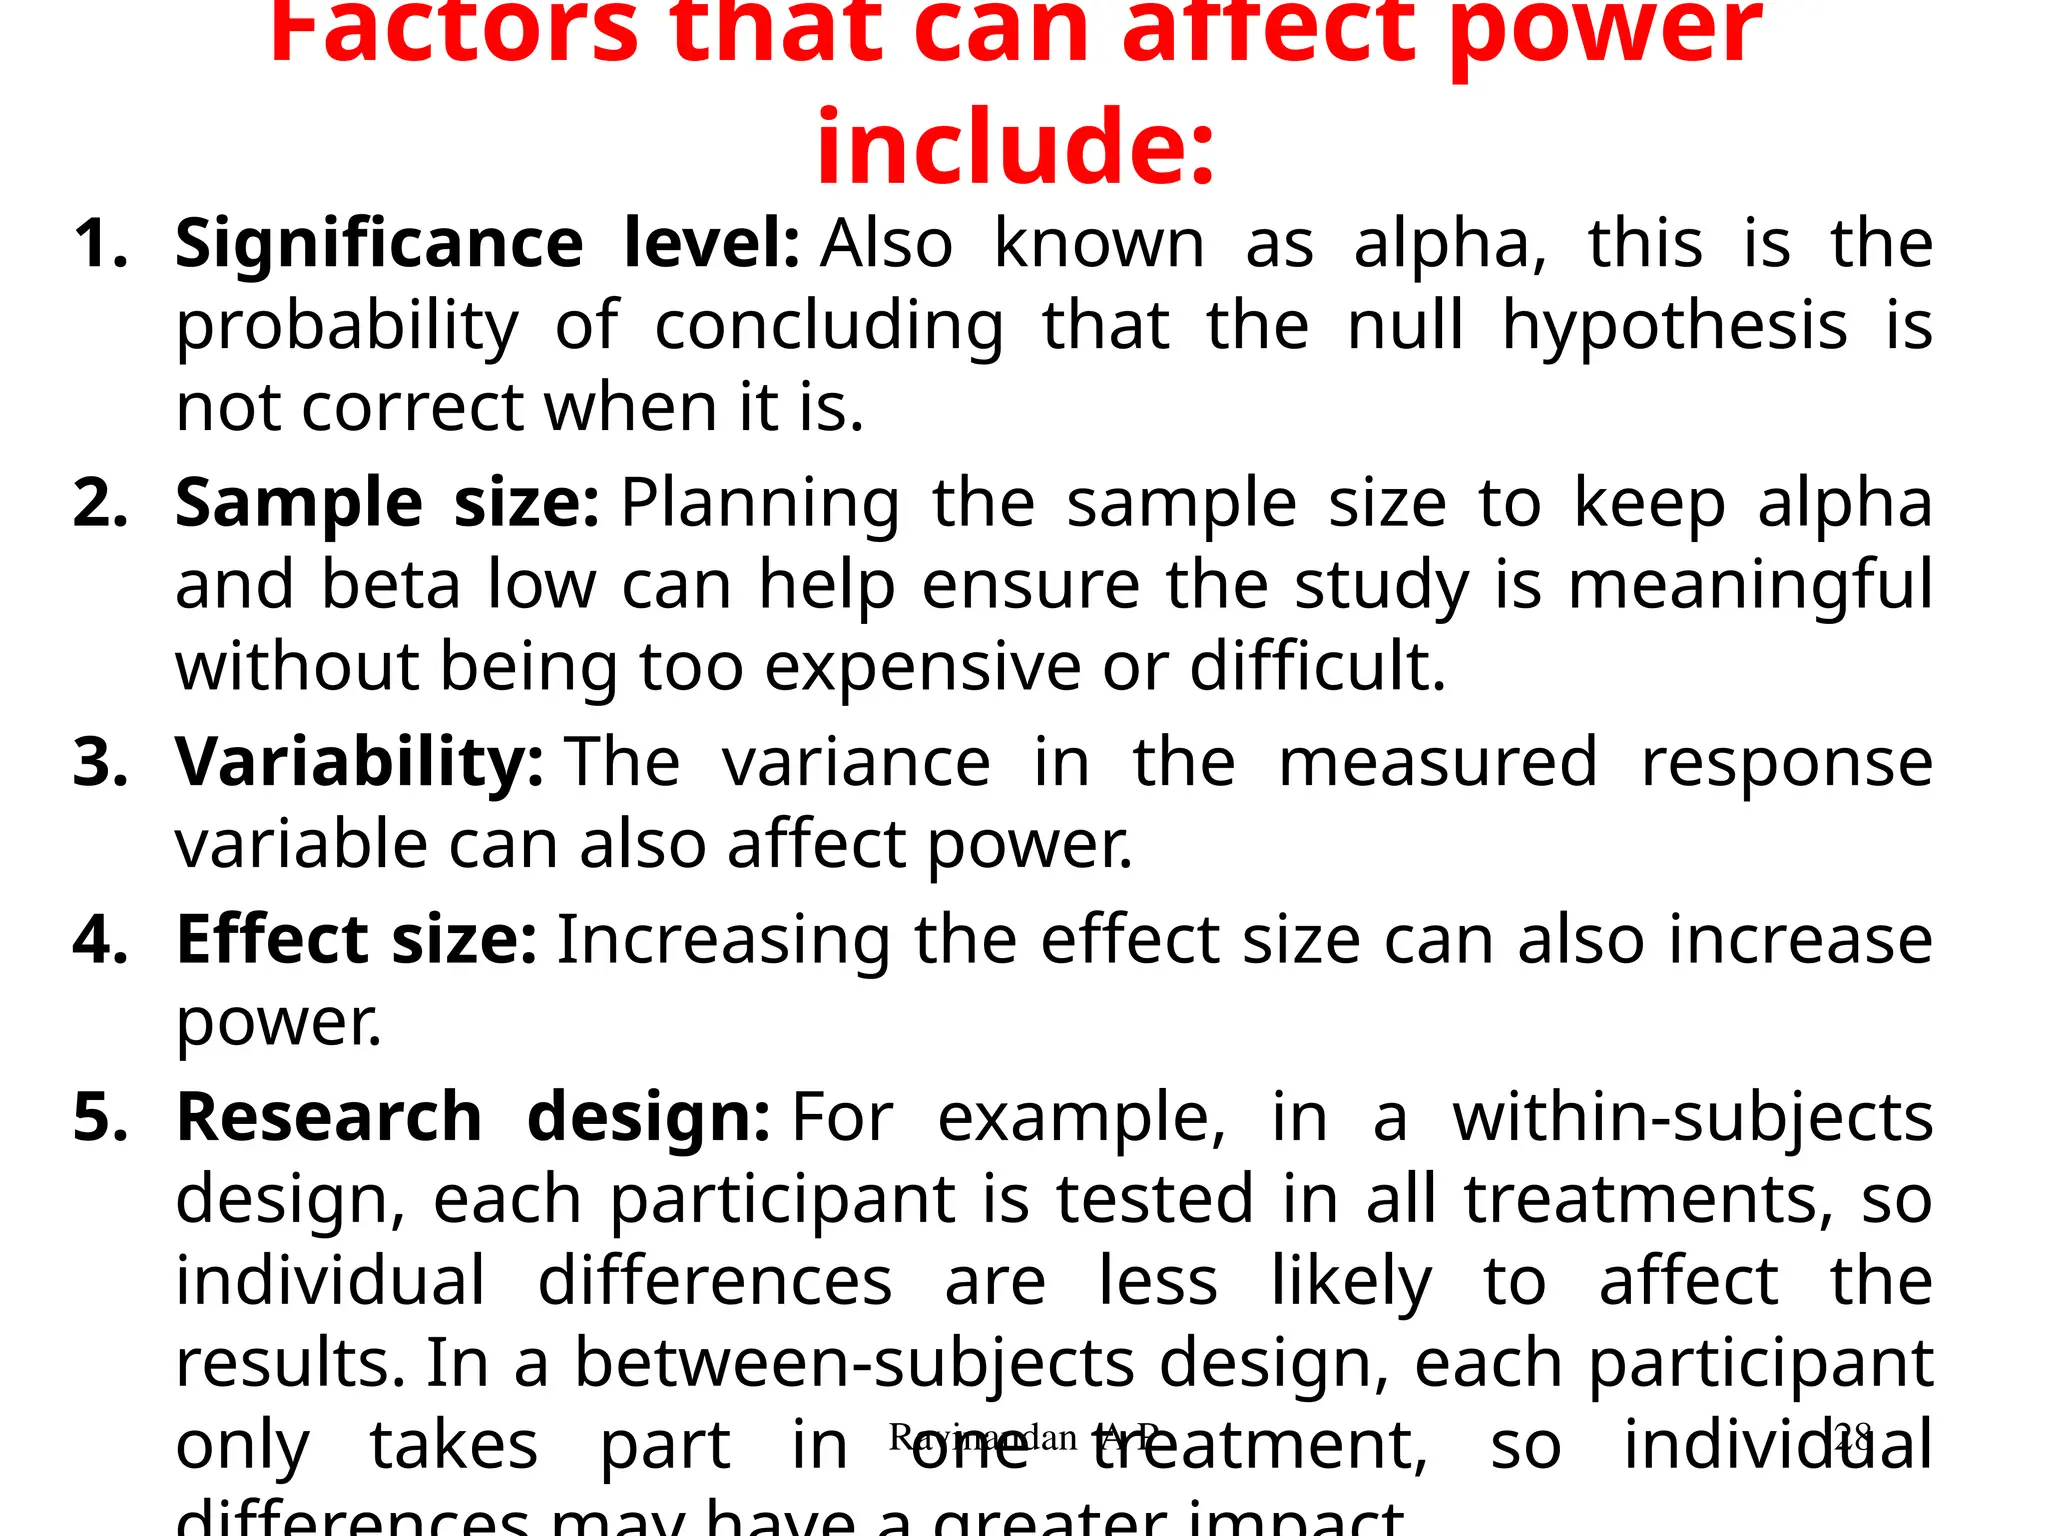
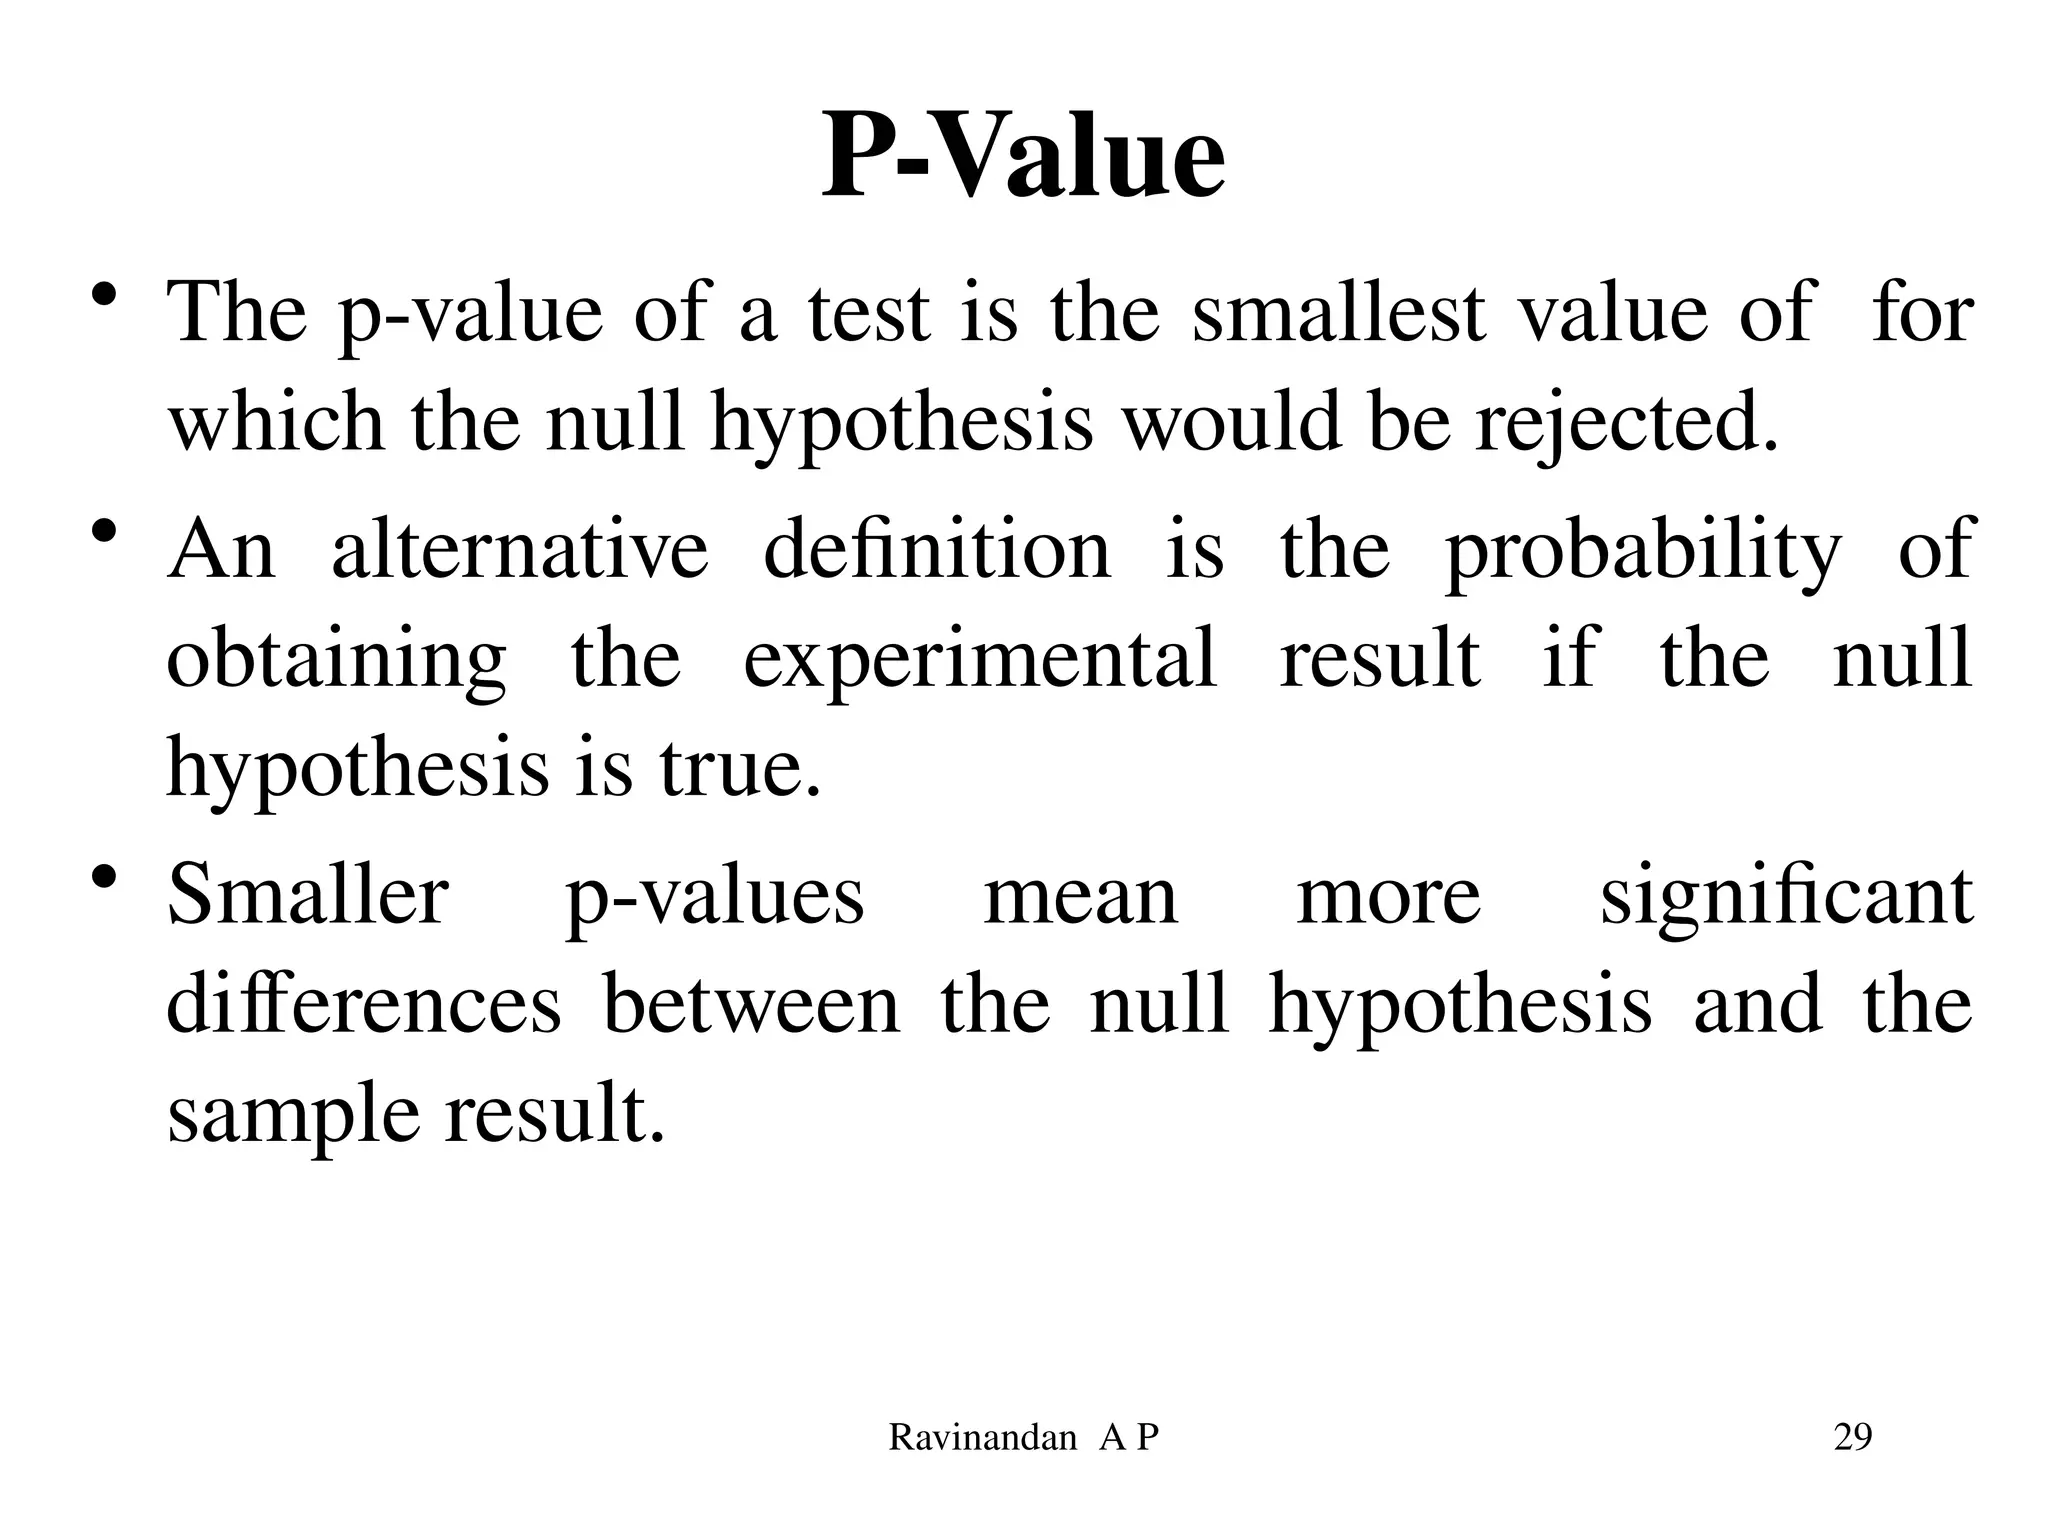
Ravinandan A P 1
Basics of testing hypothesis
Ravinandan A P
Assistant Professor
Sree Siddaganga College of
Pharmacy
Tumkur
Ravinandan A P 2
1. Hypothesis - Null, Alternative,
2. Type 1 and 2
3. Level of significance
4. P value
Ravinandan A P 3
Contents
• Sample, Population, large sample, small sample, Null hypothesis,
alternative hypothesis, sampling, essence of sampling, types of
sampling, Error-I type, Error-II type, Standard error of mean
(SEM) - Pharmaceutical examples
• Parametric test: t-test(Sample, Pooled or Unpaired and Paired) ,
ANOVA, (One way and Two way), Least Significance difference
Ravinandan A P 4
• Definition :A statistical hypothesis is an
assumption or a statement
• which may or may not be true concerning
one or more populations.
• Ex. 1) The mean height of the SSCPT
students is 1.63m.
• 2) There is no difference between the
distribution of Pf and Pv malaria in India
(are distributed in equal proportions.)
Ravinandan A P 5
The null & alternative hypotheses
• The main hypothesis which we wish
to test is called the null hypothesis,
since acceptance of it commonly
implies “no effect” or “ no
difference.”
• It is denoted by the symbol HO.
HYPOTHESIS
6
Ravinandan A P
Null Hypothesis: Often it is referred to as a
hypothesis is of no difference. In the testing process
the null hypothesis is either rejected or not rejected.
If null hypothesis is not rejected, the data on which
is based do not provide sufficient evidence to cause
rejection.
Alternative Hypothesis: If the testing procedure
leads to rejection, we conclude that the data at hand are
not compatible with the null hypothesis but are
supportive of some other hypothesis. That is called as
alternative hypothesis
Ravinandan A P 7
Ravinandan A P 8
Type I Error
• Is committed by rejecting the null hypothesis
when in really it is true & probability of
committing Type I error is denoted as α
• α = P (Type I error)
= (Rejecting the null hypothesis when it is true)
9
Ravinandan A P
Type II Error
• Is committed we accept the null hypothesis when
in reality it is false & probability of committing
Type II error is denoted as β
• β=P (Type II error)
= (Accepting the null hypothesis when it is false)
10
Ravinandan A P
• In testing the hypothesis there is no chance
or probability for any type of error.
• But, in practice it is not possible to
eliminate both types of errors.
• Hence, we fix the probability of one error
(Type I error) i. e. α and try to minimize the
probability of the other (Type II error)
11
Ravinandan A P
Ravinandan A P 12
Ravinandan A P 13
Examples
• 1) HO: μ = 1.63 m (from the previous example).
• 2) At present, only 60% of patients with
leukemia survive more than 6 years.
• A Pharmacist develops a new drug. Of 40
patients, chosen at random, on whom the new
drug is tested, 26 are alive after 6 years.
• Is the new drug better than the former
treatment?
Ravinandan A P 14
Hypothesis testing offers us two choices:
1. Conclude that the difference between the two
groups is so large that it is unlikely to be due to
chance alone. Reject the null hypothesis and
conclude that the groups really do differ.
2. Conclude that the difference between the two
groups could be explained just by chance.
Accept the null hypothesis, at least for now.
Note that you could be making a mistake, either
way!
Hypothesis testing outcomes
Decision
Outcome if null
hypothesis true
Outcome if null
hypothesis false
Do not reject null
hypothesis
Correct decision. Type II error
Reject null
hypothesis
Type I error Correct decision
15
Ravinandan A P
Test of Significance.
• These tests are mathematical methods by
which the probability (p) or relative
frequency of an observed difference,
occurring by chance is found.
• It may be difference between means or
proportions of sample and universe or
between the estimates of experiment &
control groups.
16
Ravinandan A P
• Methods of determining the significance of
difference are discussed to draw inference
and conclusion
• Common tests in use are ‘Z’ test, ‘t’ test and
‘χ2’test.
• ‘Z’ test & ‘t’ tests express the difference
observed in terms of standard error (SE)
which is measure of variation in sample
estimates that occur by chance.
17
Ravinandan A P
The stages in performing a test
of significance
1. State the null hypothesis of no or chance
difference & the alternative
2. Determine P i.e., probability of occurrence of
your estimates by chance i.e., accept or reject
null hypothesis.
3. Draw conclusion on the basis of P value, i.e.,
decide whether the difference observed is due to
chance or play of some external factors on the
sample under study
18
Ravinandan A P
Level of Significance
• The maximum probability of rejecting the
hypothesis when it is true (or maximum
probability of Type I error) is known as the
Level of Significance.
• It is denoted by α.
• These probabilities are generally taken as 0.05,
0.01 or 0.001 etc. or in % 5%, 1% or 0.1% etc.
19
Ravinandan A P
• If the calculated p-value is smaller than or equal
to 0.05, then the null hypothesis is rejected and
the result is called “statistically significant”.
• The limit of 5 % is called significance level.
• Every value between 0 and 1 could theoretically
be used as significance level but only small
values like 0.01, 0.05 or 0.10 are useful.
• In medicine, the value 0.05 has been established
as a standard.
20
Ravinandan A P
Power of test
• The probability of accepting null hypothesis
when it is false.
• It is denoted by β.
• The power of test = 1- β error.
P(reject Ho | Ho is false)
21
Ravinandan A P
Power and Sample Size
Truth
Decision H0 true H0 false
Retain H0
Correct
retention
Type II error
Reject H0 Type I error Correct rejection
α ≡ probability of a Type I error
β ≡ Probability of a Type II error
Two types of decision errors:
Type I error = erroneous rejection of true H0
Type II error = erroneous retention of false H0
22
Ravinandan A P
Power
• β ≡ probability of a Type II error
β = Pr(retain H0 | H0 false)
(the “|” is read as “given”)
• 1 – β = “Power” ≡ probability of avoiding a
Type II error
1– β = Pr(reject H0 | H0 false)
23
Ravinandan A P
• In biostatistics, power is the probability of
correctly rejecting a null hypothesis or the
probability of detecting an effect when it's
present.
• It's calculated as 1 - beta, where beta is
the probability of making a type II error or
concluding that the null hypothesis is
correct when it's not.
• For example, if the type II error rate is 0.2,
the statistical power is 1 - 0.2 = 0.8.
• A power closer to 1 indicates that the
hypothesis test is better at detecting a
false null hypothesis
Ravinandan A P 24
• power is the probability of correctly rejecting
the null hypothesis.
• We’re typically only interested in the power of a
test when the null is in fact false.
• This definition also makes it more clear that
power is a conditional probability: the null
hypothesis makes a statement about
parameter values, but the power of the test is
conditional upon what the values of those
parameters really are.
Ravinandan A P 25
Ravinandan A P 26
Ravinandan A P 27
Factors that can affect power
include:
1. Significance level: Also known as alpha, this is the
probability of concluding that the null hypothesis is
not correct when it is.
2. Sample size: Planning the sample size to keep alpha
and beta low can help ensure the study is meaningful
without being too expensive or difficult.
3. Variability: The variance in the measured response
variable can also affect power.
4. Effect size: Increasing the effect size can also increase
power.
5. Research design: For example, in a within-subjects
design, each participant is tested in all treatments, so
individual differences are less likely to affect the
results. In a between-subjects design, each participant
only takes part in one treatment, so individual
Ravinandan A P 28
P-Value
• The p-value of a test is the smallest value of for
which the null hypothesis would be rejected.
• An alternative definition is the probability of
obtaining the experimental result if the null
hypothesis is true.
• Smaller p-values mean more significant
differences between the null hypothesis and the
sample result.
29
Ravinandan A P
What is P?
• P depends on the observed outcome
• P = fraction of studies which, by chance
alone, would produce data more discrepant
from H0 than that observed in this
particular study.
• P-values measure strength of the evidence
• but not the importance of the result.
30
Ravinandan A P
Interpretation
• P-value answer the question: What is the
probability of the observed test statistic …
when H0 is true?
• Thus, smaller and smaller P-values provide
stronger and stronger evidence against H0
• Small P-value  strong evidence
31
Ravinandan A P
Interpretation
Conventions*
P > 0.10  non-significant evidence against H0
0.05 < P  0.10  marginally significant evidence
0.01 < P  0.05  significant evidence against H0
P  0.01  highly significant evidence against H0
Examples
P =.27  non-significant evidence against H0
P =.01  highly significant evidence against H0
* It is unwise to draw firm borders for “significance” 32
Ravinandan A P
• The p-value of a test is the smallest value of
for which the null hypothesis would be
rejected.
• An alternative definition is the probability of
obtaining the experimental result if the null
hypothesis is true.
• Smaller p-values mean more significant
differences between the null hypothesis and the
sample result.
33
Ravinandan A P
THANK YOU
34
Ravinandan A P

Unit 2 Testing of Hypothesis - Hypothesis - Null, Alternative, Type 1 and 2 and level of significance, P value.pptx

  • 1.
    Ravinandan A P1 Basics of testing hypothesis Ravinandan A P Assistant Professor Sree Siddaganga College of Pharmacy Tumkur
  • 2.
    Ravinandan A P2 1. Hypothesis - Null, Alternative, 2. Type 1 and 2 3. Level of significance 4. P value
  • 3.
    Ravinandan A P3 Contents • Sample, Population, large sample, small sample, Null hypothesis, alternative hypothesis, sampling, essence of sampling, types of sampling, Error-I type, Error-II type, Standard error of mean (SEM) - Pharmaceutical examples • Parametric test: t-test(Sample, Pooled or Unpaired and Paired) , ANOVA, (One way and Two way), Least Significance difference
  • 4.
    Ravinandan A P4 • Definition :A statistical hypothesis is an assumption or a statement • which may or may not be true concerning one or more populations. • Ex. 1) The mean height of the SSCPT students is 1.63m. • 2) There is no difference between the distribution of Pf and Pv malaria in India (are distributed in equal proportions.)
  • 5.
    Ravinandan A P5 The null & alternative hypotheses • The main hypothesis which we wish to test is called the null hypothesis, since acceptance of it commonly implies “no effect” or “ no difference.” • It is denoted by the symbol HO.
  • 6.
    HYPOTHESIS 6 Ravinandan A P NullHypothesis: Often it is referred to as a hypothesis is of no difference. In the testing process the null hypothesis is either rejected or not rejected. If null hypothesis is not rejected, the data on which is based do not provide sufficient evidence to cause rejection. Alternative Hypothesis: If the testing procedure leads to rejection, we conclude that the data at hand are not compatible with the null hypothesis but are supportive of some other hypothesis. That is called as alternative hypothesis
  • 7.
  • 8.
  • 9.
    Type I Error •Is committed by rejecting the null hypothesis when in really it is true & probability of committing Type I error is denoted as α • α = P (Type I error) = (Rejecting the null hypothesis when it is true) 9 Ravinandan A P
  • 10.
    Type II Error •Is committed we accept the null hypothesis when in reality it is false & probability of committing Type II error is denoted as β • β=P (Type II error) = (Accepting the null hypothesis when it is false) 10 Ravinandan A P
  • 11.
    • In testingthe hypothesis there is no chance or probability for any type of error. • But, in practice it is not possible to eliminate both types of errors. • Hence, we fix the probability of one error (Type I error) i. e. α and try to minimize the probability of the other (Type II error) 11 Ravinandan A P
  • 12.
  • 13.
    Ravinandan A P13 Examples • 1) HO: μ = 1.63 m (from the previous example). • 2) At present, only 60% of patients with leukemia survive more than 6 years. • A Pharmacist develops a new drug. Of 40 patients, chosen at random, on whom the new drug is tested, 26 are alive after 6 years. • Is the new drug better than the former treatment?
  • 14.
    Ravinandan A P14 Hypothesis testing offers us two choices: 1. Conclude that the difference between the two groups is so large that it is unlikely to be due to chance alone. Reject the null hypothesis and conclude that the groups really do differ. 2. Conclude that the difference between the two groups could be explained just by chance. Accept the null hypothesis, at least for now. Note that you could be making a mistake, either way!
  • 15.
    Hypothesis testing outcomes Decision Outcomeif null hypothesis true Outcome if null hypothesis false Do not reject null hypothesis Correct decision. Type II error Reject null hypothesis Type I error Correct decision 15 Ravinandan A P
  • 16.
    Test of Significance. •These tests are mathematical methods by which the probability (p) or relative frequency of an observed difference, occurring by chance is found. • It may be difference between means or proportions of sample and universe or between the estimates of experiment & control groups. 16 Ravinandan A P
  • 17.
    • Methods ofdetermining the significance of difference are discussed to draw inference and conclusion • Common tests in use are ‘Z’ test, ‘t’ test and ‘χ2’test. • ‘Z’ test & ‘t’ tests express the difference observed in terms of standard error (SE) which is measure of variation in sample estimates that occur by chance. 17 Ravinandan A P
  • 18.
    The stages inperforming a test of significance 1. State the null hypothesis of no or chance difference & the alternative 2. Determine P i.e., probability of occurrence of your estimates by chance i.e., accept or reject null hypothesis. 3. Draw conclusion on the basis of P value, i.e., decide whether the difference observed is due to chance or play of some external factors on the sample under study 18 Ravinandan A P
  • 19.
    Level of Significance •The maximum probability of rejecting the hypothesis when it is true (or maximum probability of Type I error) is known as the Level of Significance. • It is denoted by α. • These probabilities are generally taken as 0.05, 0.01 or 0.001 etc. or in % 5%, 1% or 0.1% etc. 19 Ravinandan A P
  • 20.
    • If thecalculated p-value is smaller than or equal to 0.05, then the null hypothesis is rejected and the result is called “statistically significant”. • The limit of 5 % is called significance level. • Every value between 0 and 1 could theoretically be used as significance level but only small values like 0.01, 0.05 or 0.10 are useful. • In medicine, the value 0.05 has been established as a standard. 20 Ravinandan A P
  • 21.
    Power of test •The probability of accepting null hypothesis when it is false. • It is denoted by β. • The power of test = 1- β error. P(reject Ho | Ho is false) 21 Ravinandan A P
  • 22.
    Power and SampleSize Truth Decision H0 true H0 false Retain H0 Correct retention Type II error Reject H0 Type I error Correct rejection α ≡ probability of a Type I error β ≡ Probability of a Type II error Two types of decision errors: Type I error = erroneous rejection of true H0 Type II error = erroneous retention of false H0 22 Ravinandan A P
  • 23.
    Power • β ≡probability of a Type II error β = Pr(retain H0 | H0 false) (the “|” is read as “given”) • 1 – β = “Power” ≡ probability of avoiding a Type II error 1– β = Pr(reject H0 | H0 false) 23 Ravinandan A P
  • 24.
    • In biostatistics,power is the probability of correctly rejecting a null hypothesis or the probability of detecting an effect when it's present. • It's calculated as 1 - beta, where beta is the probability of making a type II error or concluding that the null hypothesis is correct when it's not. • For example, if the type II error rate is 0.2, the statistical power is 1 - 0.2 = 0.8. • A power closer to 1 indicates that the hypothesis test is better at detecting a false null hypothesis Ravinandan A P 24
  • 25.
    • power isthe probability of correctly rejecting the null hypothesis. • We’re typically only interested in the power of a test when the null is in fact false. • This definition also makes it more clear that power is a conditional probability: the null hypothesis makes a statement about parameter values, but the power of the test is conditional upon what the values of those parameters really are. Ravinandan A P 25
  • 26.
  • 27.
  • 28.
    Factors that canaffect power include: 1. Significance level: Also known as alpha, this is the probability of concluding that the null hypothesis is not correct when it is. 2. Sample size: Planning the sample size to keep alpha and beta low can help ensure the study is meaningful without being too expensive or difficult. 3. Variability: The variance in the measured response variable can also affect power. 4. Effect size: Increasing the effect size can also increase power. 5. Research design: For example, in a within-subjects design, each participant is tested in all treatments, so individual differences are less likely to affect the results. In a between-subjects design, each participant only takes part in one treatment, so individual Ravinandan A P 28
  • 29.
    P-Value • The p-valueof a test is the smallest value of for which the null hypothesis would be rejected. • An alternative definition is the probability of obtaining the experimental result if the null hypothesis is true. • Smaller p-values mean more significant differences between the null hypothesis and the sample result. 29 Ravinandan A P
  • 30.
    What is P? •P depends on the observed outcome • P = fraction of studies which, by chance alone, would produce data more discrepant from H0 than that observed in this particular study. • P-values measure strength of the evidence • but not the importance of the result. 30 Ravinandan A P
  • 31.
    Interpretation • P-value answerthe question: What is the probability of the observed test statistic … when H0 is true? • Thus, smaller and smaller P-values provide stronger and stronger evidence against H0 • Small P-value  strong evidence 31 Ravinandan A P
  • 32.
    Interpretation Conventions* P > 0.10 non-significant evidence against H0 0.05 < P  0.10  marginally significant evidence 0.01 < P  0.05  significant evidence against H0 P  0.01  highly significant evidence against H0 Examples P =.27  non-significant evidence against H0 P =.01  highly significant evidence against H0 * It is unwise to draw firm borders for “significance” 32 Ravinandan A P
  • 33.
    • The p-valueof a test is the smallest value of for which the null hypothesis would be rejected. • An alternative definition is the probability of obtaining the experimental result if the null hypothesis is true. • Smaller p-values mean more significant differences between the null hypothesis and the sample result. 33 Ravinandan A P
  • 34.