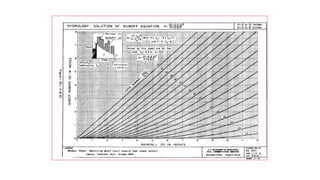
Downloaded 63 times

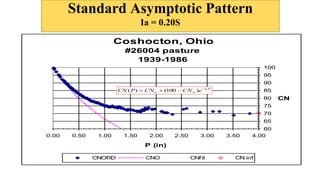
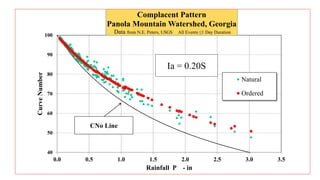
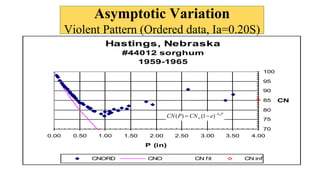
![How do Curve Numbers really act?
• Variations in rainfall-runoff processes should lead to variations
in CN behavior. [An unexpected fact]
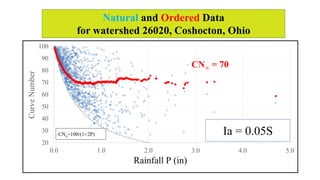
• CN varies with P - An enlightening display [Natural and
Ordered (P, Q) Data Pairs] [There is a lower limit defined as
CNo, i.e., the CN of no runoff for a given P.]
• Three (3) major rainfall-runoff behavior patterns observed
- Standard - Asymptotic
- Violent
- Complacent
(Almost) All watershed P:Q can be so described](https://image.slidesharecdn.com/updatingthecurvenumbermethodforrainfallrunoffestimation-180829132049/85/Updating-the-curve-number-method-for-rainfall-runoff-estimation-12-320.jpg)
![1. Ia 0.05S seems to be better based on numerous studies
2. Q = (P-0.05S0.05)2/(P+0.95S0.05) [revised formulation]
3. “CN” changes too
S∞,0.05 = 1.42S∞,0.20 (Approx., based on natural data, LS fittings)
4. New CN0.05 tables from old CN0.20 (via S)
5. Differences at extremes of low and high rainfalls
Biggest effects with low CN and low P (Low P/S)
Changes to Initial Abstraction (Ia) Relationship with S](https://image.slidesharecdn.com/updatingthecurvenumbermethodforrainfallrunoffestimation-180829132049/85/Updating-the-curve-number-method-for-rainfall-runoff-estimation-19-320.jpg)
![Averaged Q from distributed CNs
and not from Averaged CN
Qt = Σ(Qi x Ai)/At (with Qi =f(CNi, P) [1]
and not
Qt = f(CNc [= Σ(CNi x Ai)/At], P) [2]
[when [1] is used, results will normally display as a standard CN:P
pattern]](https://image.slidesharecdn.com/updatingthecurvenumbermethodforrainfallrunoffestimation-180829132049/85/Updating-the-curve-number-method-for-rainfall-runoff-estimation-20-320.jpg)


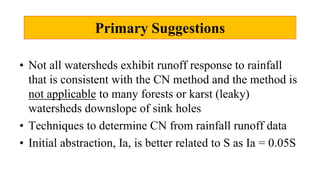
This document summarizes an effort to update the Curve Number (CN) rainfall-runoff estimation method. A collaborative task group reviewed the state of the CN method and suggested changes based on 60+ years of experience. Key suggestions include relating initial abstraction to soil more accurately, converting CN tables to reflect this change, and calculating runoff from distributed CNs rather than averaged CNs. The proposed changes aim to better represent watershed response processes observed in natural data. Feedback is being solicited on revising relevant chapters in NRCS guidance documents.