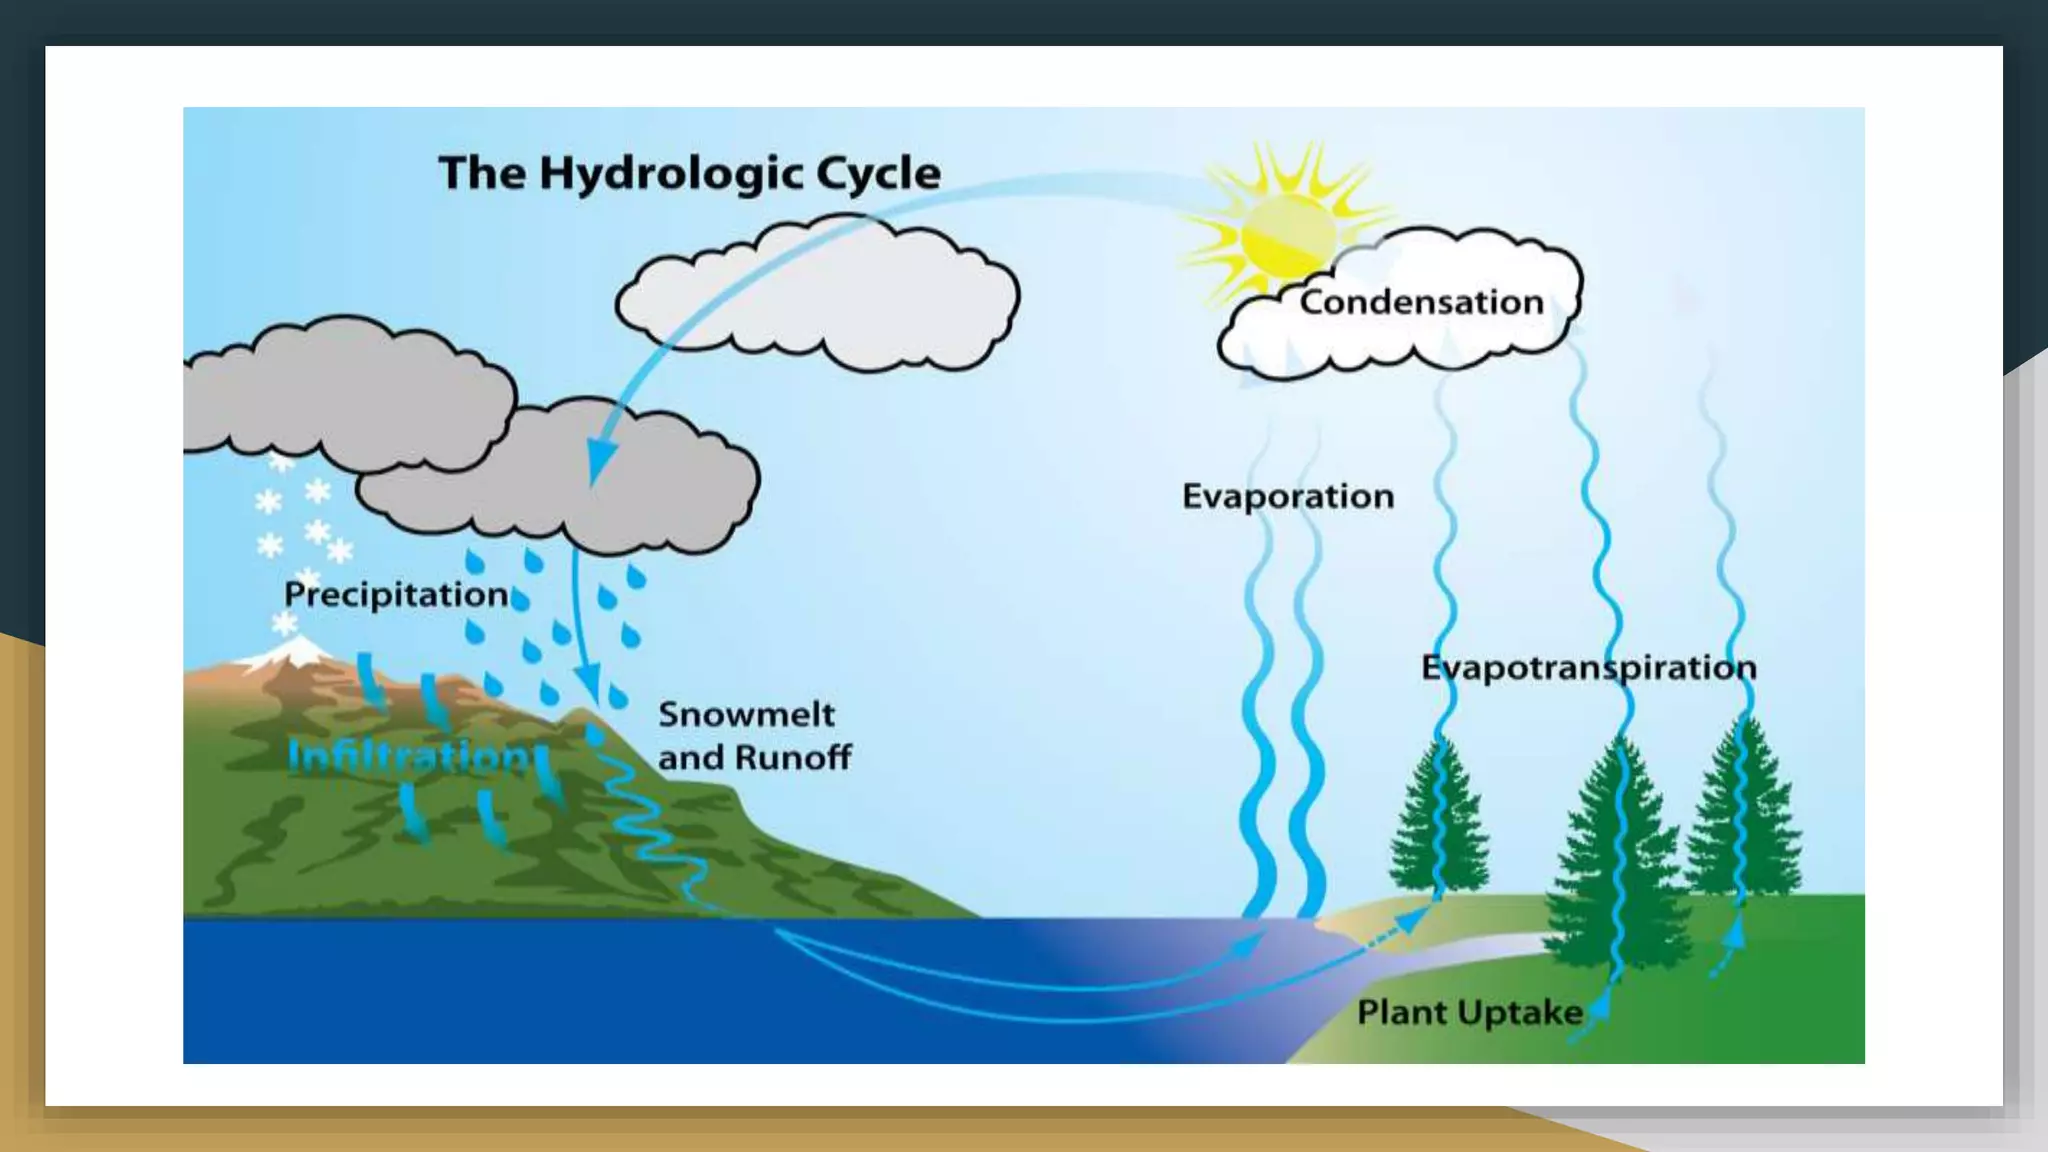
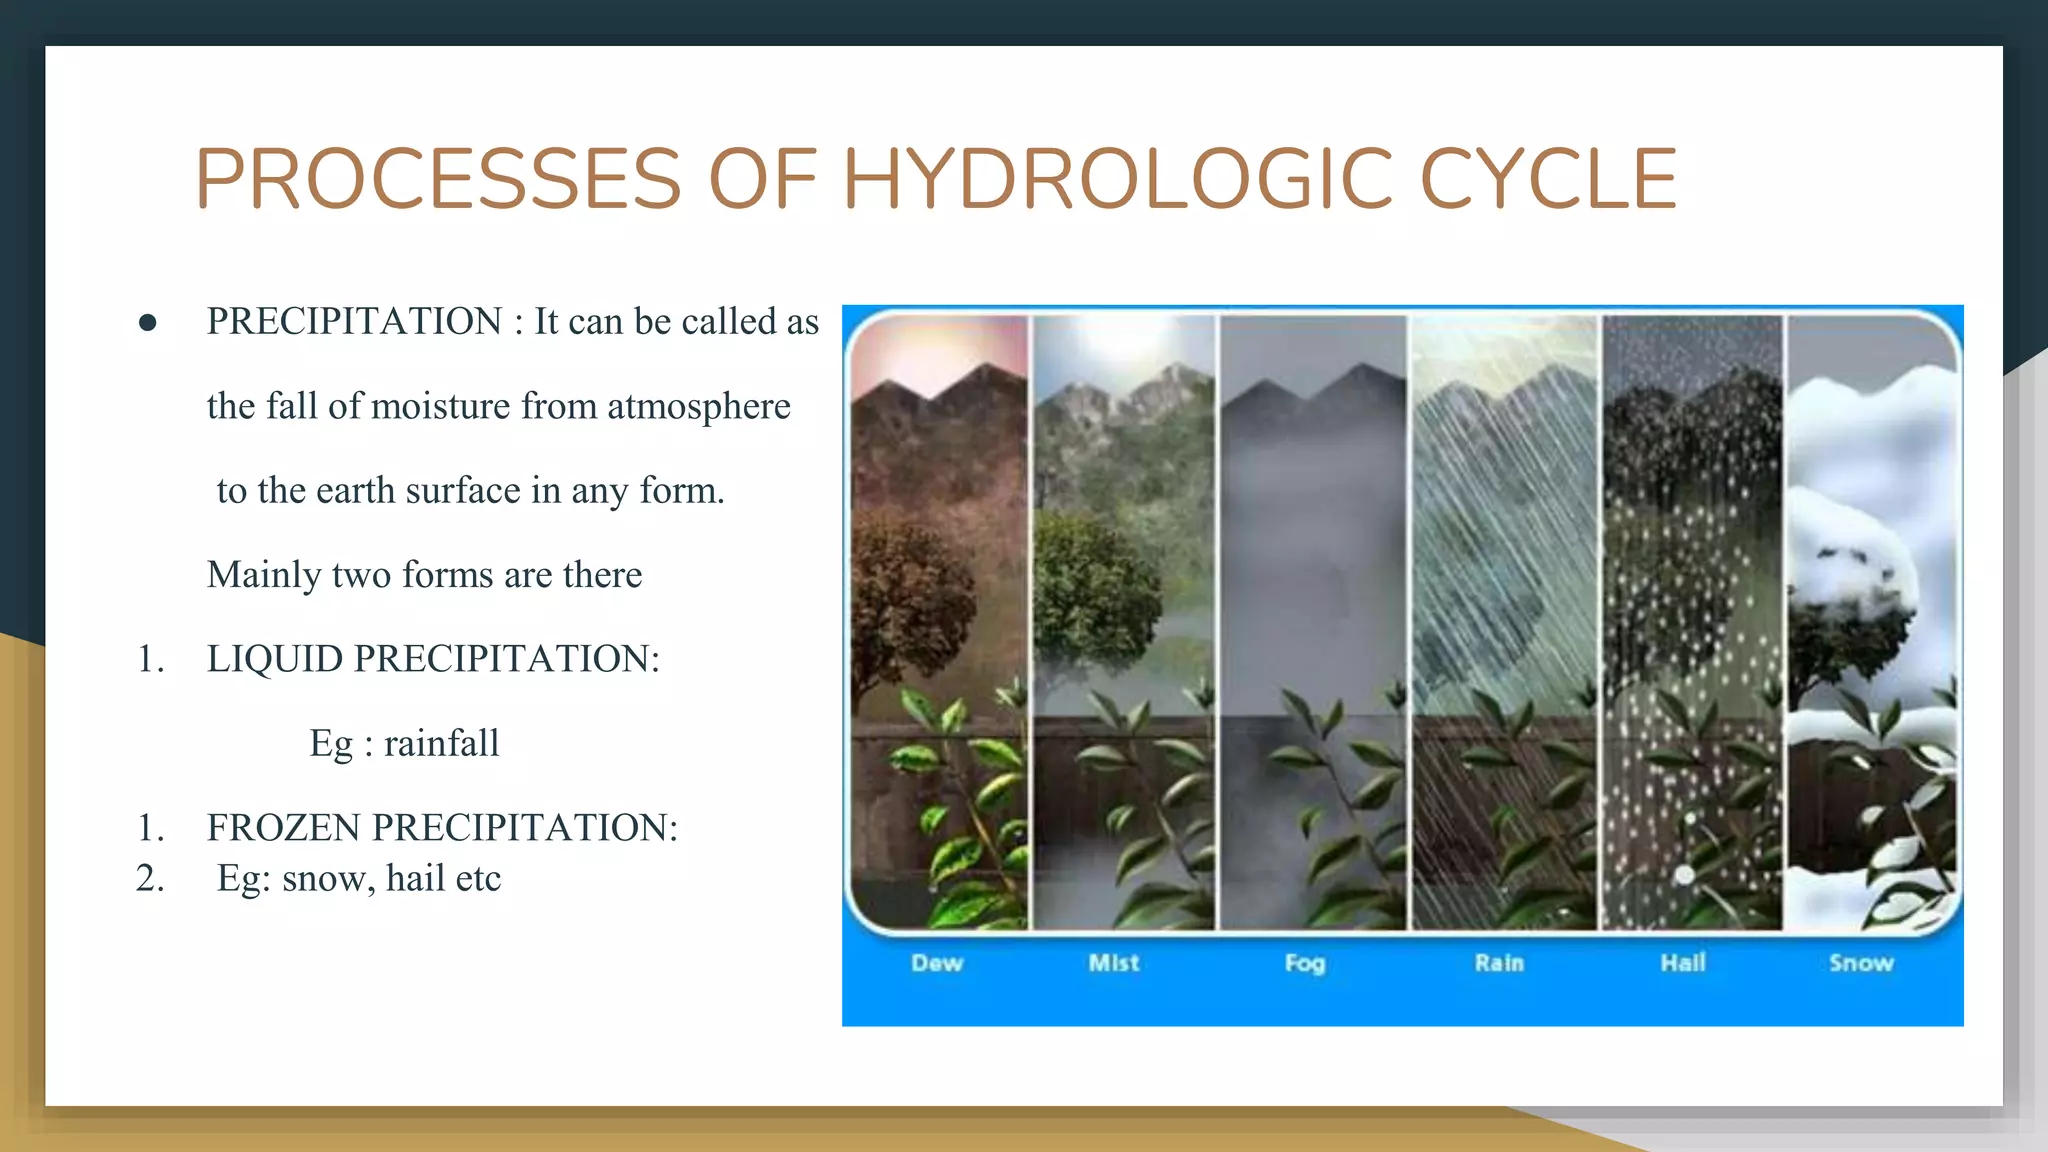
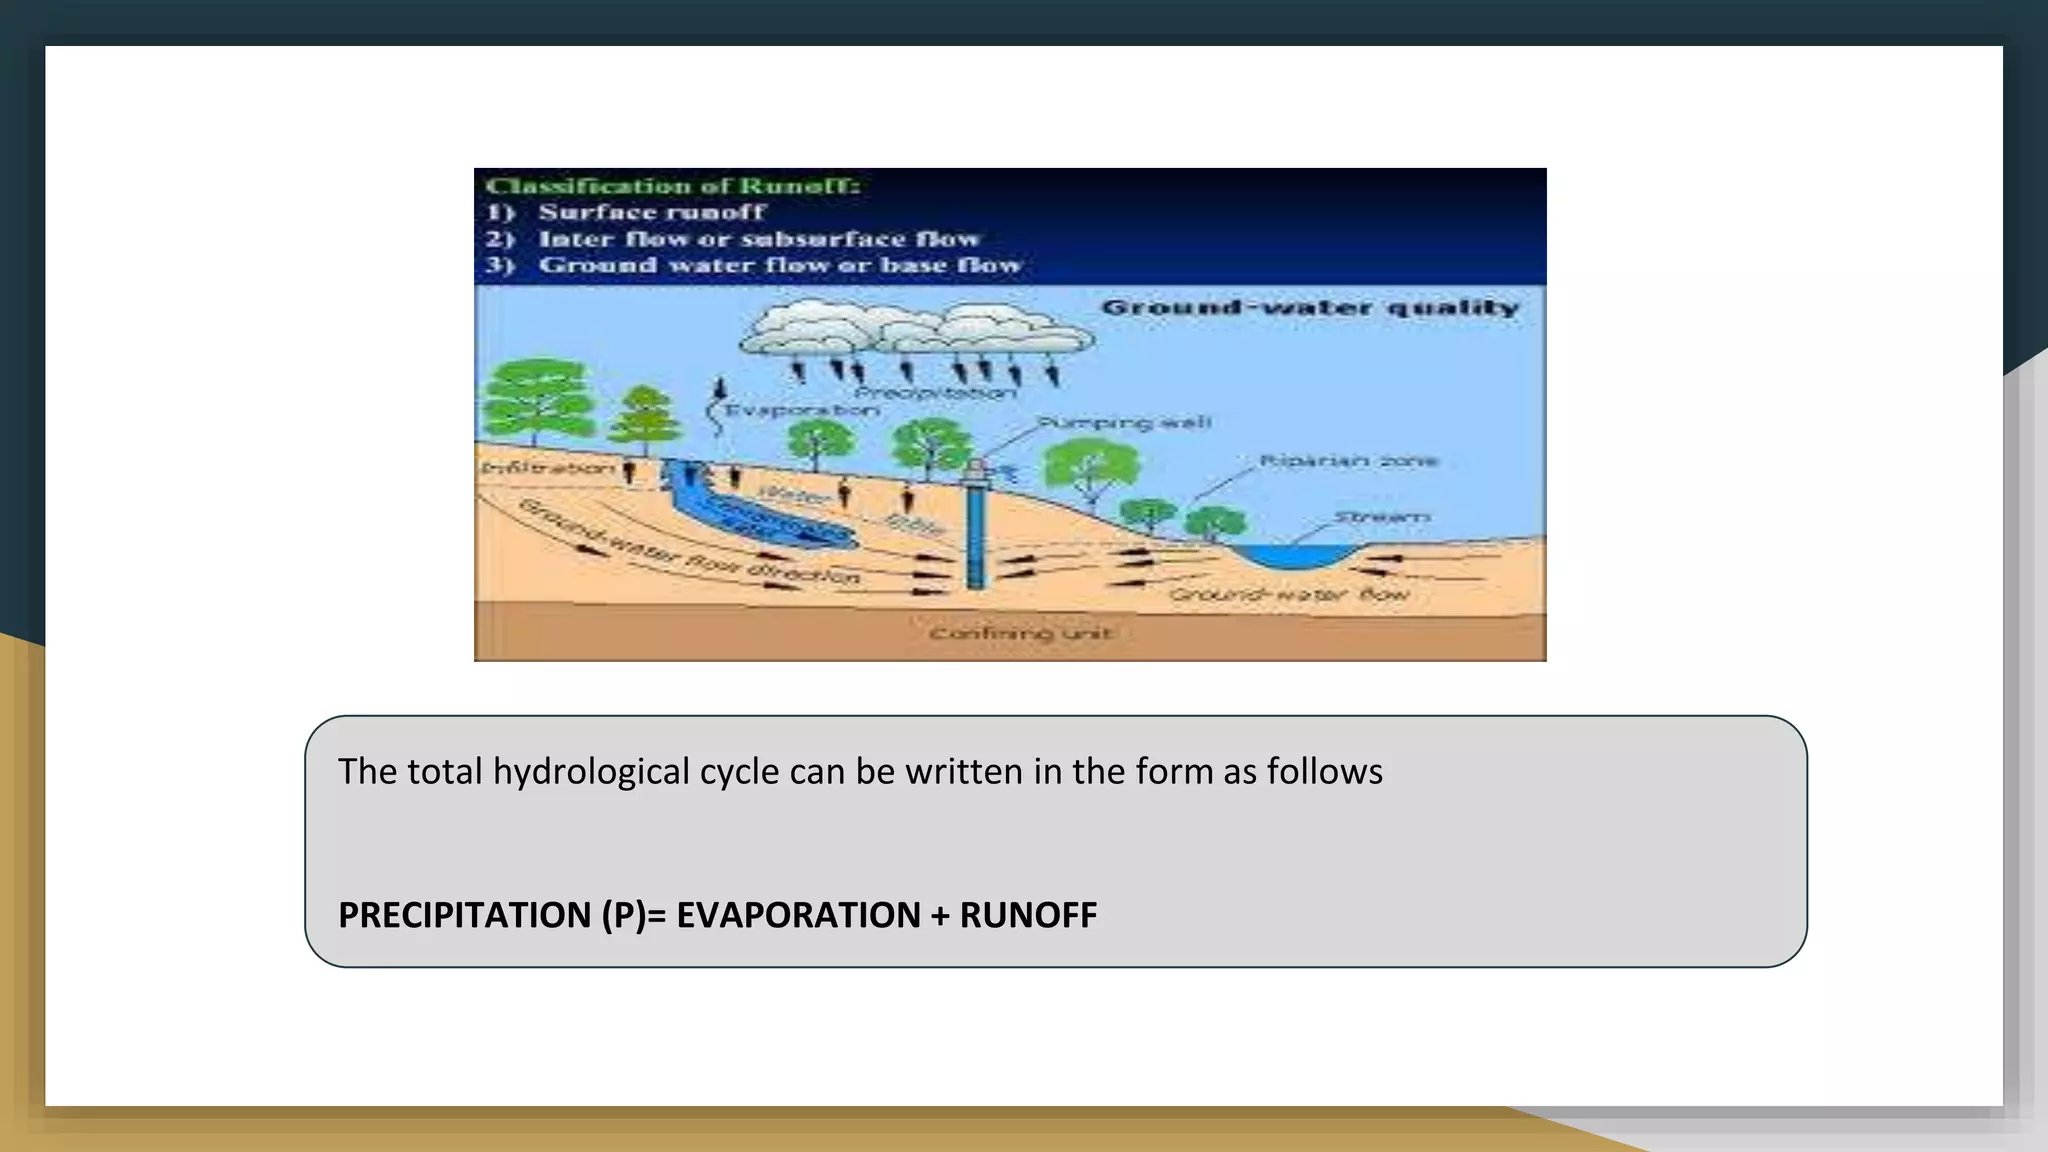
SlideShare a Scribd company logo
1 of 41
HYDROLOGICAL CYCLE
RIYA SUSAN
DEPARTMENT OF CIVIL ENGINEERING
AL AZAHAR COLLEGE OF ENGINEERING AND POLYTECHNIC
HYDROLOGY
It is science dealing with the occurrence, distribution and movement of water on the earth’s
surface and as well as below the earth surface.
Water occurs in the atmosphere in the form of vapour, on the surface as water and snow mainly
and below the surface as ground water.
The total water supply of earth will be in constant circulation from earth to atmosphere and
back to earth(except ground water)
This circulatory system of water is called hydrological cycle.
In hydrological cycle transfer of moisture to earth in the form of precipitation and this
precipitated water flows to the sea by streams and rivers.
Similarly the water in the lakes, rivers and sea evaporates and goes back into the
atmosphere.
PROCESSES OF HYDROLOGIC CYCLE
● PRECIPITATION : It can be called as
the fall of moisture from atmosphere
to the earth surface in any form.
Mainly two forms are there
1. LIQUID PRECIPITATION:
Eg : rainfall
1. FROZEN PRECIPITATION:
2. Eg: snow, hail etc
● EVAPORATION: The water from the surfaces of streams, lakes, rivers and seas evaporates
and vapours are carried by air in the form of clouds.
● TRANSPIRATION: it is the process of water being lost from the leaves of trees from their
pores.
The total evaporation consists of 1) Surface evaporation and 2)water surface evaporation and
3)Atmospheric evaporation
Evapotranspiration (ET) is the sum of water
evaporation and transpiration from a surface
area to the atmosphere. Evaporation accounts
for the movement of water to the air from
sources such as the soil, canopy interception,
and water bodies
● RUNOFF : Runoff is the portion of precipitation which is not evaporated.
When the rain falls down to earth’s surface a part of it is evaporated and the
remaining is available as runoff, which ultimately runs to the sea through streams and
rivers.
Runoff can be classified as:
● Surface runoff: in this water flows on the surface of the land and is the first to reach
the streams and rivers and finally to the sea.
● Sub -surface runoff: a portion of precipitation infiltrates into the surface soil and as
per the geological conditions of the basin runs as sub -surface runoff and reaches the
streams and rivers
● Groundwater flow: this is the portion of precipitation which after infiltration
percolates down and joins the ground water reservoir which is finally connected to
the sea.
The total hydrological cycle can be written in the form as follows
PRECIPITATION (P)= EVAPORATION + RUNOFF
RAINFALL (PRECIPITATION)
● Rainfall is a natural process in which vapour in the atmosphere changes into water.
● The water so formed then travels from atmosphere to earth .
FORMATION OF PRECIPITATION:
RAINFALL occurs when the capacity of an air mass to hold the vapour exceeds for the following reasons ;
1. HOT AIR Has high capacity to hold the vapour particles under suspension. When the air gets cooled
the capacity of air mass to hold vapour particles is much reduced and the vapour precipitates in the
form of water drops.
2. At times variations in pressure bring about the changes of state from vapour to rainfall.
EXPRESSION OF RAINFALL
The yearly, monthly or daily rainfall is expressed in cm, or millimeters of depth over a particular area which
receives the precipitation.
One centimetre of rainfall mean that the water precipitated on a certain plain area in the form of rainfall
which is not lost in any manner and there is no runoff and evaporation then all the water accumulates on the
surface in the form of layer. When the layer of this deposited water is 1cm thick it is supposed that 1 cm
rainfall has occurred.
MEASUREMENT OF RAINFALL- Rain gauges
Rain gauges
Non Automatic (non
recording type)
Automatic (Recording
type)
tipping
bucket
Weighing
bucket
Symon’s rain gauge Float
type
SYMON’S RAIN GAUGE
● It consist of a funnel and a cylindrical zinc bottle.
● The diameter of the bottle and the top of the funnel is 127mm
● The funnel is fitted in the bottle neck , both are then placed in a metal casing
● The base of metal casing is enlarged to 210mm
● The capacity of bottle is such as to collect the rainfall likely to occur in 24 hours time
● The gauge is provided with graduated jar which measures water in mm
● The smallest division in jar is 0.2mm
● Installation : at the site where the rainfall is to be measured a concrete block of
cubical shape of 60cm size is constructed. The casing is fixed in the block
permanently in such a way that the top of casing is about 30cm above the natural
surface level. While fixing the gauge precaution is to be taken to perfectly level the
top of the funnel
Measurement
● The rain gauge is adjusted every day for measurement of rainfall
● Rainfall is measured every day at 8.30 AM
● In case of heavy rainfall it is measured for more times and is recorded as the total rainfall
of that day
Points to observed while fixing the site for rain gauge station:
1. The rain gauge should be set up in an open place by at least 30 meters away from
obstructions.
2. The rain gauge should not be set up on the top of a hill.
3. If it is not possible to find a levelled surface the site should be properly shielded from
gusty winds.
4. A fence should be erected to protect the gauge from cattle
FLOAT TYPE
● This type of rain gauge consists of a funnel rotating drum, a float, float rod which connects the float to
the pen carrier
● The pen carrier , carries a pen which moves up and down on the graph paper fixed to the rotating drum
● It also consists of a syphon and as such this type of rain gauge is also called syphon rain gauge.
● The drum rotates around the vertical axis once in 24 hours.
● When rainfalls water enters into the box raises the float by a suitable mechanism.
● It causes the movement of the pen on a revolving chart
● The pen will mark line on the graph and the inclination of the line will depend on the movement of the
float which again depends on the intensity of rainfall
● When the float reaches upto a certain level, syphoning action starts and the box is emptied quickly
● The curve obtained on the graph is called MASS CURVE OF RAINFALL
INFORMATIONS FROM FLOAT TYPE RAIN
GAUGE
1. DURATION OF RAINFALL
2. INTENSITY OF RAINFALL
3. TOTAL AMOUNT OF RAINFALL
FACTORS AFFECTING RAINFALL
HEIGHT OF THE PLACE ABOVE SEA LEVEL: At high altitudes temperature is very low and when clouds reach
these areas they are eroded and there will be heavy rainfall
NEARNESS TO FORESTS
NEARNESS TO SEA
DIRECTION OF WINDS
WEIGHING BUCKET TYPE
● Weighing bucket type rain gauge is most common self-recording rain gauge.
● It consists of a receiver bucket supported by a spring or lever balance or some other weighing
mechanism.
● The movement of bucket due to its increasing weight is transmitted to a pen which traces
record or some marking on a clock driven chart.
● Weighing bucket type rain gauge instrument gives a plot of the accumulated (increased)
rainfall values against the elapsed time and the curve so formed is called the mass curve.
TIPPING BUCKET TYPE
In this type a pair of tipping buckets is placed below a funnel.
The bucket gets filled up by 0.25 mm of rainfall and immediately it tips and empties the
water into a chamber below.
At that very instant other bucket comes below the funnel to receive rainwater.
The tipping of the bucket actuates an electrical circuit which moves a pointer to register
the rainfall on a graph.
The water collected in the chamber below could also be measured by a measuring jar.
RAINFALL RECORDS
The number of rain gauge stations in a catchment basin mostly depend on the extent of the area, climate and
topographic conditions.
AREA IN SQ.KM NO OF RAIN GAUGE STATIONS
Less than 125 1
126- 250 2
251-500 3
501-1000 4
● Rainfall measured at every 24 hours
● Usually at 8 AM IST
● The total rainfall occurred in past 24 hours is entered against on which the measurement is done.
● It means that rainfall recorded on a particular day is the rainfall of 8 hours of the day and 16 hours of
the previous day
● Records are maintained on daily, monthly , yearly basis
USE OF RAINFALL RECORDS
1. To calculate the run off
2. To predict the floods
3. To study the trend of rainfall
4. To determine the water requirements of crops
COMPUTING AVERAGE RAINFALL OVER AN
AREA
The average rainfall over a catchment area can be computed by measuring the rainfall
A network of rain gauges should be so planned to have a correct representative
There should not be concentration of gauges in areas of heavy rainfall
3 methods:
1. Arithmetic average method
2. Thiessen polygon method
3. Isohyetal method
ARITHMETIC AVERAGE METHOD
● This is the simplest method of computing the average rainfall over a basin.
● As the name suggests, the result is obtained by the division of the sum of rain depths recorded
at different rain gauge stations of the basin by the number of the stations.
● If the rain gauges are uniformly distributed over the area and the rainfall varies in a very
regular manner, the results obtained by this method will be quite satisfactory and will not differ
much than those obtained by other methods.
● This method can be used for the storm rainfall, monthly or annual rainfall average
computations.
● AVERAGE DEPTH OF RAINFALL OVER THE BASIN = TOTAL RAINFALL/ NO OF RAIN GAUGE STATIONS
RAIN GAUGE STATIONS RAINFALL IN MM
A 54
B 48
C 50
D 59
E 52
5 263
AVG RAINFALL = 263/5 = 52.6mm
If 2 of rain gauge stations are located in a forest region which recorded the
highest rainfall when compared to the other stations the method of computation
has to be done in this way
Rain gauge stations Rainfall in mm
A 54
B 126
C 50
D 120
E 52
Sum of rainfalls recorded in stations A,C E which are nearer to each other =54+50+52=156mm
Average rainfall in these stations=156/3 = 52mm
Sum of rain fall recorded in stations B and D which are nearer to each other = 126+120= 246mm
Average rainfall in these two stations = 246/2= 123mm
Average rainfall in the entire basin = 52+123 /2 = 175/2 =87.5mm
THIESSON’ POLYGON METHOD
This is the weighted mean method.
The rainfall is never uniform over the entire area of the basin or catchment, but varies in intensity
and duration from place to place.
Thus the rainfall recorded by each rain gauge station should be weighted according to the area, it
represents.
This method is more suitable under the following conditions:
-For areas of moderate size.
-When rainfall stations are few compared to the size of the basin.
-In moderate rugged areas.
For the construction of the polygon, the following procedure is to be followed:
Step 3: Draw perpendicular bisectors to the triangle sides. These bisectors form polygons around the stations
Step 4: Delineate the formed polygons and
measure their areas using a planimeter or
by converting them into smaller regular
geometric shapes (i.e. triangles, squares,
rectangles, etc.)
Step 5: Compute the average rainfall using the
following formula
P1xA1 + P2 xA2 +... + PnxAn
(A1 + A2 + .... + A)
Station No. Bi-sectional
areas (Ai)
[km2]
Measured
precipitation (Pi)
[mm]
(Col. 2 * Col. 3)
(Ai *Pi)
P1 25 10 250
P2 125 15 1875
P3 80 20 1600
P4 90 17 1530
P5 120 25 3000
P6 115 40 4600
P7 130 12 1560
Total 685 14415
ISOHYTEL METHOD
An isohyetal is a line joining places where the rainfall amounts are equal on a rainfall map of
a basin.
An isohyetal map showing contours of equal rainfall is more accurate picture of the rainfall
over the basin. This method is more suited under the following conditions:
-For hilly and rugged areas.
-For large areas over 5000 km2.
-For areas where the network of rainfall stations within the storm area is sufficiently dense,
isohyetal method gives more accurate distribution of rainfall.
Step 1: Draw the area under study to scale and
mark rain gauges on it. Put at each of the rain
gauge location the recorded values of rainfall at the
station, for the period within which the average is
required to be determined.
Step 2:DRAW the isohyets of various values of the
point rainfall data as guidelines and interpolating
between them.
Step 3: Determine the area between each pair of the isohyet lines, either by a planimeter or
by converting the areas into smaller regular geometric shapes
Step 4: Calculate the average rainfall using the following formula:
A1 (P1 + P2)/2 + A2 (P2 + P3)/2 + . . . + An-1(Pn-1 + Pn)/2
P
av = (A1 + A2 + . . . + An)
Pi = Value of Isohyet lines
Ai = Area between pair of isohyet lines.
COMPARISON BETWEEN 3 METHODS
ARITHMETIC MEAN METHOD THIESSEN POLYGON METHOD ISOHYETAL METHOD
● This is the simplest and
easiest method to compute
average rainfall.
● If the recording stations and
rainfall is uniformly
distributed over the entire
catchment, then this method
is equally accurate
In this method the rainfall stations
located at a short distance beyond
the boundary of drainage are also
used to determine the mean
rainfall of the basin, but their
influence diminishes as the
distance from the boundary
increases.
1It is the most accurate method if
the contours are drawn correctly.
However to obtain the best results
good judgment in drawing the
isohyets and in assigning the
proper mean rainfall values to the
area between them is required.
In this method every station has
equal weight regardless its
location.
commonly used for flat and low
rugged areas
1It is the best method for rugged
areas and hilly regions.

More Related Content

What's hot

1 introduction to hydrology
1 introduction to hydrology1 introduction to hydrology
1 introduction to hydrologyAbdulhakim Mobin
 
Storm Hydrographs
Storm HydrographsStorm Hydrographs
Storm HydrographsJwilliamss
 
Lesson 6 factors affecting discharge (hydrographs)
Lesson 6 factors affecting discharge (hydrographs)Lesson 6 factors affecting discharge (hydrographs)
Lesson 6 factors affecting discharge (hydrographs)lesliehome
 
Module 2 ch-1 heytograph and hydrology analysis
Module 2 ch-1 heytograph and hydrology analysisModule 2 ch-1 heytograph and hydrology analysis
Module 2 ch-1 heytograph and hydrology analysisAnkit Patel
 
Runoff computation by infiltration indices
Runoff computation by infiltration indicesRunoff computation by infiltration indices
Runoff computation by infiltration indicesSagar Vekariya
 
Infiltration and runoff
Infiltration and runoffInfiltration and runoff
Infiltration and runoffMoudud Hasan
 
Hydrograph explanation and animation
Hydrograph explanation and animationHydrograph explanation and animation
Hydrograph explanation and animationDuncanAshton
 
Hyetograph and hydrograph analysis
Hyetograph and hydrograph analysisHyetograph and hydrograph analysis
Hyetograph and hydrograph analysisvivek gami
 
measurement of infiltration
measurement of infiltrationmeasurement of infiltration
measurement of infiltrationTharun Reddy
 
Introduction, hydrologic cycle, climate and water m1
Introduction, hydrologic cycle, climate and water m1Introduction, hydrologic cycle, climate and water m1
Introduction, hydrologic cycle, climate and water m1Bibhabasu Mohanty
 
Hydrology introduction ( catchment area)
Hydrology introduction ( catchment area)Hydrology introduction ( catchment area)
Hydrology introduction ( catchment area)Latif Hyder Wadho
 
Hydrology and irrigation engineering cel 303
Hydrology and irrigation engineering   cel 303Hydrology and irrigation engineering   cel 303
Hydrology and irrigation engineering cel 303Gaurav Mittal
 
Module 1 introduction
Module 1 introductionModule 1 introduction
Module 1 introductionAnkit Patel
 
hydro chapter_11_hydrology_by louy al hami
hydro  chapter_11_hydrology_by louy al hami hydro  chapter_11_hydrology_by louy al hami
hydro chapter_11_hydrology_by louy al hami Louy Alhamy
 
Hydrology by Denish Jangid sir
Hydrology by Denish Jangid sirHydrology by Denish Jangid sir
Hydrology by Denish Jangid sirDenish Jangid
 
Hydrology and water management(EVAPORATION & INFILTRATION)...
Hydrology and water management(EVAPORATION & INFILTRATION)...Hydrology and water management(EVAPORATION & INFILTRATION)...
Hydrology and water management(EVAPORATION & INFILTRATION)...Nasir Uddin
 

What's hot (20)

Runoff final
Runoff finalRunoff final
Runoff final
 
1 introduction to hydrology
1 introduction to hydrology1 introduction to hydrology
1 introduction to hydrology
 
Storm Hydrographs
Storm HydrographsStorm Hydrographs
Storm Hydrographs
 
Lesson 6 factors affecting discharge (hydrographs)
Lesson 6 factors affecting discharge (hydrographs)Lesson 6 factors affecting discharge (hydrographs)
Lesson 6 factors affecting discharge (hydrographs)
 
Module 2 ch-1 heytograph and hydrology analysis
Module 2 ch-1 heytograph and hydrology analysisModule 2 ch-1 heytograph and hydrology analysis
Module 2 ch-1 heytograph and hydrology analysis
 
Runoff computation by infiltration indices
Runoff computation by infiltration indicesRunoff computation by infiltration indices
Runoff computation by infiltration indices
 
4 runoff and floods
4 runoff and floods4 runoff and floods
4 runoff and floods
 
Infiltration and runoff
Infiltration and runoffInfiltration and runoff
Infiltration and runoff
 
Baseflow
BaseflowBaseflow
Baseflow
 
Hydrograph explanation and animation
Hydrograph explanation and animationHydrograph explanation and animation
Hydrograph explanation and animation
 
Hyetograph and hydrograph analysis
Hyetograph and hydrograph analysisHyetograph and hydrograph analysis
Hyetograph and hydrograph analysis
 
measurement of infiltration
measurement of infiltrationmeasurement of infiltration
measurement of infiltration
 
Introduction, hydrologic cycle, climate and water m1
Introduction, hydrologic cycle, climate and water m1Introduction, hydrologic cycle, climate and water m1
Introduction, hydrologic cycle, climate and water m1
 
Hydrology introduction ( catchment area)
Hydrology introduction ( catchment area)Hydrology introduction ( catchment area)
Hydrology introduction ( catchment area)
 
Hydrology and irrigation engineering cel 303
Hydrology and irrigation engineering   cel 303Hydrology and irrigation engineering   cel 303
Hydrology and irrigation engineering cel 303
 
Hydrology notes
Hydrology notesHydrology notes
Hydrology notes
 
Module 1 introduction
Module 1 introductionModule 1 introduction
Module 1 introduction
 
hydro chapter_11_hydrology_by louy al hami
hydro  chapter_11_hydrology_by louy al hami hydro  chapter_11_hydrology_by louy al hami
hydro chapter_11_hydrology_by louy al hami
 
Hydrology by Denish Jangid sir
Hydrology by Denish Jangid sirHydrology by Denish Jangid sir
Hydrology by Denish Jangid sir
 
Hydrology and water management(EVAPORATION & INFILTRATION)...
Hydrology and water management(EVAPORATION & INFILTRATION)...Hydrology and water management(EVAPORATION & INFILTRATION)...
Hydrology and water management(EVAPORATION & INFILTRATION)...
 

Similar to 1 module hydrology (1)

Similar to 1 module hydrology (1) (20)

Hwre module 1
Hwre module 1Hwre module 1
Hwre module 1
 
1introductionpptx20180717161655-180731180418 (1).pdf
1introductionpptx20180717161655-180731180418 (1).pdf1introductionpptx20180717161655-180731180418 (1).pdf
1introductionpptx20180717161655-180731180418 (1).pdf
 
Introduction to Hydrology
Introduction to HydrologyIntroduction to Hydrology
Introduction to Hydrology
 
Hydrology.pptx
Hydrology.pptxHydrology.pptx
Hydrology.pptx
 
(3) irrigation hydrology
(3) irrigation hydrology(3) irrigation hydrology
(3) irrigation hydrology
 
Module 3 - Hydrology.pdf
Module 3 - Hydrology.pdfModule 3 - Hydrology.pdf
Module 3 - Hydrology.pdf
 
HYDROLOGY_PPT-1-1-1[1].pptx
HYDROLOGY_PPT-1-1-1[1].pptxHYDROLOGY_PPT-1-1-1[1].pptx
HYDROLOGY_PPT-1-1-1[1].pptx
 
12001321063 CE(PC)502 .pptx
12001321063 CE(PC)502 .pptx12001321063 CE(PC)502 .pptx
12001321063 CE(PC)502 .pptx
 
1 hydrology
1 hydrology1 hydrology
1 hydrology
 
Precipitation unit 2
Precipitation unit 2 Precipitation unit 2
Precipitation unit 2
 
Measurement of precipitation
Measurement of precipitationMeasurement of precipitation
Measurement of precipitation
 
Hydrological cycle
Hydrological cycleHydrological cycle
Hydrological cycle
 
Waterccfffffff Supply 2023-2024 (2).pdf
Waterccfffffff Supply  2023-2024 (2).pdfWaterccfffffff Supply  2023-2024 (2).pdf
Waterccfffffff Supply 2023-2024 (2).pdf
 
engineering-hydrology-ppt.pdf
engineering-hydrology-ppt.pdfengineering-hydrology-ppt.pdf
engineering-hydrology-ppt.pdf
 
WRE-1.pdf
WRE-1.pdfWRE-1.pdf
WRE-1.pdf
 
Precipitation -Atmospheric
Precipitation -AtmosphericPrecipitation -Atmospheric
Precipitation -Atmospheric
 
Introduction to Engineering Hydrology
Introduction to Engineering HydrologyIntroduction to Engineering Hydrology
Introduction to Engineering Hydrology
 
Rainfall presentation in ppt
Rainfall presentation in pptRainfall presentation in ppt
Rainfall presentation in ppt
 
Slide share
Slide shareSlide share
Slide share
 
Water resources engineering
Water resources engineeringWater resources engineering
Water resources engineering
 

Recently uploaded

Gfe Mayur Vihar Call Girls Service WhatsApp -> 9999965857 Available 24x7 ^ De...
Gfe Mayur Vihar Call Girls Service WhatsApp -> 9999965857 Available 24x7 ^ De...Gfe Mayur Vihar Call Girls Service WhatsApp -> 9999965857 Available 24x7 ^ De...
Gfe Mayur Vihar Call Girls Service WhatsApp -> 9999965857 Available 24x7 ^ De...srsj9000
 
Study on Air-Water & Water-Water Heat Exchange in a Finned Tube Exchanger
Study on Air-Water & Water-Water Heat Exchange in a Finned Tube ExchangerStudy on Air-Water & Water-Water Heat Exchange in a Finned Tube Exchanger
Study on Air-Water & Water-Water Heat Exchange in a Finned Tube ExchangerAnamika Sarkar
 
Comparative Analysis of Text Summarization Techniques
Comparative Analysis of Text Summarization TechniquesComparative Analysis of Text Summarization Techniques
Comparative Analysis of Text Summarization Techniquesugginaramesh
 
Work Experience-Dalton Park.pptxfvvvvvvv
Work Experience-Dalton Park.pptxfvvvvvvvWork Experience-Dalton Park.pptxfvvvvvvv
Work Experience-Dalton Park.pptxfvvvvvvvLewisJB
 
Software and Systems Engineering Standards: Verification and Validation of Sy...
Software and Systems Engineering Standards: Verification and Validation of Sy...Software and Systems Engineering Standards: Verification and Validation of Sy...
Software and Systems Engineering Standards: Verification and Validation of Sy...VICTOR MAESTRE RAMIREZ
 
Heart Disease Prediction using machine learning.pptx
Heart Disease Prediction using machine learning.pptxHeart Disease Prediction using machine learning.pptx
Heart Disease Prediction using machine learning.pptxPoojaBan
 
Call Girls Narol 7397865700 Independent Call Girls
Call Girls Narol 7397865700 Independent Call GirlsCall Girls Narol 7397865700 Independent Call Girls
Call Girls Narol 7397865700 Independent Call Girlsssuser7cb4ff
 
Artificial-Intelligence-in-Electronics (K).pptx
Artificial-Intelligence-in-Electronics (K).pptxArtificial-Intelligence-in-Electronics (K).pptx
Artificial-Intelligence-in-Electronics (K).pptxbritheesh05
 
CCS355 Neural Network & Deep Learning UNIT III notes and Question bank .pdf
CCS355 Neural Network & Deep Learning UNIT III notes and Question bank .pdfCCS355 Neural Network & Deep Learning UNIT III notes and Question bank .pdf
CCS355 Neural Network & Deep Learning UNIT III notes and Question bank .pdfAsst.prof M.Gokilavani
 
An experimental study in using natural admixture as an alternative for chemic...
An experimental study in using natural admixture as an alternative for chemic...An experimental study in using natural admixture as an alternative for chemic...
An experimental study in using natural admixture as an alternative for chemic...Chandu841456
 
What are the advantages and disadvantages of membrane structures.pptx
What are the advantages and disadvantages of membrane structures.pptxWhat are the advantages and disadvantages of membrane structures.pptx
What are the advantages and disadvantages of membrane structures.pptxwendy cai
 
Gurgaon ✡️9711147426✨Call In girls Gurgaon Sector 51 escort service
Gurgaon ✡️9711147426✨Call In girls Gurgaon Sector 51 escort serviceGurgaon ✡️9711147426✨Call In girls Gurgaon Sector 51 escort service
Gurgaon ✡️9711147426✨Call In girls Gurgaon Sector 51 escort servicejennyeacort
 
TechTAC® CFD Report Summary: A Comparison of Two Types of Tubing Anchor Catchers
TechTAC® CFD Report Summary: A Comparison of Two Types of Tubing Anchor CatchersTechTAC® CFD Report Summary: A Comparison of Two Types of Tubing Anchor Catchers
TechTAC® CFD Report Summary: A Comparison of Two Types of Tubing Anchor Catcherssdickerson1
 
Application of Residue Theorem to evaluate real integrations.pptx
Application of Residue Theorem to evaluate real integrations.pptxApplication of Residue Theorem to evaluate real integrations.pptx
Application of Residue Theorem to evaluate real integrations.pptx959SahilShah
 
Biology for Computer Engineers Course Handout.pptx
Biology for Computer Engineers Course Handout.pptxBiology for Computer Engineers Course Handout.pptx
Biology for Computer Engineers Course Handout.pptxDeepakSakkari2
 
An introduction to Semiconductor and its types.pptx
An introduction to Semiconductor and its types.pptxAn introduction to Semiconductor and its types.pptx
An introduction to Semiconductor and its types.pptxPurva Nikam
 

Recently uploaded (20)

Gfe Mayur Vihar Call Girls Service WhatsApp -> 9999965857 Available 24x7 ^ De...
Gfe Mayur Vihar Call Girls Service WhatsApp -> 9999965857 Available 24x7 ^ De...Gfe Mayur Vihar Call Girls Service WhatsApp -> 9999965857 Available 24x7 ^ De...
Gfe Mayur Vihar Call Girls Service WhatsApp -> 9999965857 Available 24x7 ^ De...
 
Study on Air-Water & Water-Water Heat Exchange in a Finned Tube Exchanger
Study on Air-Water & Water-Water Heat Exchange in a Finned Tube ExchangerStudy on Air-Water & Water-Water Heat Exchange in a Finned Tube Exchanger
Study on Air-Water & Water-Water Heat Exchange in a Finned Tube Exchanger
 
Comparative Analysis of Text Summarization Techniques
Comparative Analysis of Text Summarization TechniquesComparative Analysis of Text Summarization Techniques
Comparative Analysis of Text Summarization Techniques
 
Work Experience-Dalton Park.pptxfvvvvvvv
Work Experience-Dalton Park.pptxfvvvvvvvWork Experience-Dalton Park.pptxfvvvvvvv
Work Experience-Dalton Park.pptxfvvvvvvv
 
9953056974 Call Girls In South Ex, Escorts (Delhi) NCR.pdf
9953056974 Call Girls In South Ex, Escorts (Delhi) NCR.pdf9953056974 Call Girls In South Ex, Escorts (Delhi) NCR.pdf
9953056974 Call Girls In South Ex, Escorts (Delhi) NCR.pdf
 
Software and Systems Engineering Standards: Verification and Validation of Sy...
Software and Systems Engineering Standards: Verification and Validation of Sy...Software and Systems Engineering Standards: Verification and Validation of Sy...
Software and Systems Engineering Standards: Verification and Validation of Sy...
 
Heart Disease Prediction using machine learning.pptx
Heart Disease Prediction using machine learning.pptxHeart Disease Prediction using machine learning.pptx
Heart Disease Prediction using machine learning.pptx
 
🔝9953056974🔝!!-YOUNG call girls in Rajendra Nagar Escort rvice Shot 2000 nigh...
🔝9953056974🔝!!-YOUNG call girls in Rajendra Nagar Escort rvice Shot 2000 nigh...🔝9953056974🔝!!-YOUNG call girls in Rajendra Nagar Escort rvice Shot 2000 nigh...
🔝9953056974🔝!!-YOUNG call girls in Rajendra Nagar Escort rvice Shot 2000 nigh...
 
Call Girls Narol 7397865700 Independent Call Girls
Call Girls Narol 7397865700 Independent Call GirlsCall Girls Narol 7397865700 Independent Call Girls
Call Girls Narol 7397865700 Independent Call Girls
 
young call girls in Green Park🔝 9953056974 🔝 escort Service
young call girls in Green Park🔝 9953056974 🔝 escort Serviceyoung call girls in Green Park🔝 9953056974 🔝 escort Service
young call girls in Green Park🔝 9953056974 🔝 escort Service
 
Artificial-Intelligence-in-Electronics (K).pptx
Artificial-Intelligence-in-Electronics (K).pptxArtificial-Intelligence-in-Electronics (K).pptx
Artificial-Intelligence-in-Electronics (K).pptx
 
CCS355 Neural Network & Deep Learning UNIT III notes and Question bank .pdf
CCS355 Neural Network & Deep Learning UNIT III notes and Question bank .pdfCCS355 Neural Network & Deep Learning UNIT III notes and Question bank .pdf
CCS355 Neural Network & Deep Learning UNIT III notes and Question bank .pdf
 
An experimental study in using natural admixture as an alternative for chemic...
An experimental study in using natural admixture as an alternative for chemic...An experimental study in using natural admixture as an alternative for chemic...
An experimental study in using natural admixture as an alternative for chemic...
 
What are the advantages and disadvantages of membrane structures.pptx
What are the advantages and disadvantages of membrane structures.pptxWhat are the advantages and disadvantages of membrane structures.pptx
What are the advantages and disadvantages of membrane structures.pptx
 
POWER SYSTEMS-1 Complete notes examples
POWER SYSTEMS-1 Complete notes  examplesPOWER SYSTEMS-1 Complete notes  examples
POWER SYSTEMS-1 Complete notes examples
 
Gurgaon ✡️9711147426✨Call In girls Gurgaon Sector 51 escort service
Gurgaon ✡️9711147426✨Call In girls Gurgaon Sector 51 escort serviceGurgaon ✡️9711147426✨Call In girls Gurgaon Sector 51 escort service
Gurgaon ✡️9711147426✨Call In girls Gurgaon Sector 51 escort service
 
TechTAC® CFD Report Summary: A Comparison of Two Types of Tubing Anchor Catchers
TechTAC® CFD Report Summary: A Comparison of Two Types of Tubing Anchor CatchersTechTAC® CFD Report Summary: A Comparison of Two Types of Tubing Anchor Catchers
TechTAC® CFD Report Summary: A Comparison of Two Types of Tubing Anchor Catchers
 
Application of Residue Theorem to evaluate real integrations.pptx
Application of Residue Theorem to evaluate real integrations.pptxApplication of Residue Theorem to evaluate real integrations.pptx
Application of Residue Theorem to evaluate real integrations.pptx
 
Biology for Computer Engineers Course Handout.pptx
Biology for Computer Engineers Course Handout.pptxBiology for Computer Engineers Course Handout.pptx
Biology for Computer Engineers Course Handout.pptx
 
An introduction to Semiconductor and its types.pptx
An introduction to Semiconductor and its types.pptxAn introduction to Semiconductor and its types.pptx
An introduction to Semiconductor and its types.pptx
 

1 module hydrology (1)

  • 1. HYDROLOGICAL CYCLE RIYA SUSAN DEPARTMENT OF CIVIL ENGINEERING AL AZAHAR COLLEGE OF ENGINEERING AND POLYTECHNIC
  • 2. HYDROLOGY It is science dealing with the occurrence, distribution and movement of water on the earth’s surface and as well as below the earth surface. Water occurs in the atmosphere in the form of vapour, on the surface as water and snow mainly and below the surface as ground water. The total water supply of earth will be in constant circulation from earth to atmosphere and back to earth(except ground water) This circulatory system of water is called hydrological cycle.
  • 3.
  • 4. In hydrological cycle transfer of moisture to earth in the form of precipitation and this precipitated water flows to the sea by streams and rivers. Similarly the water in the lakes, rivers and sea evaporates and goes back into the atmosphere.
  • 5. PROCESSES OF HYDROLOGIC CYCLE ● PRECIPITATION : It can be called as the fall of moisture from atmosphere to the earth surface in any form. Mainly two forms are there 1. LIQUID PRECIPITATION: Eg : rainfall 1. FROZEN PRECIPITATION: 2. Eg: snow, hail etc
  • 6. ● EVAPORATION: The water from the surfaces of streams, lakes, rivers and seas evaporates and vapours are carried by air in the form of clouds. ● TRANSPIRATION: it is the process of water being lost from the leaves of trees from their pores. The total evaporation consists of 1) Surface evaporation and 2)water surface evaporation and 3)Atmospheric evaporation
  • 7. Evapotranspiration (ET) is the sum of water evaporation and transpiration from a surface area to the atmosphere. Evaporation accounts for the movement of water to the air from sources such as the soil, canopy interception, and water bodies
  • 8. ● RUNOFF : Runoff is the portion of precipitation which is not evaporated. When the rain falls down to earth’s surface a part of it is evaporated and the remaining is available as runoff, which ultimately runs to the sea through streams and rivers. Runoff can be classified as: ● Surface runoff: in this water flows on the surface of the land and is the first to reach the streams and rivers and finally to the sea. ● Sub -surface runoff: a portion of precipitation infiltrates into the surface soil and as per the geological conditions of the basin runs as sub -surface runoff and reaches the streams and rivers ● Groundwater flow: this is the portion of precipitation which after infiltration percolates down and joins the ground water reservoir which is finally connected to the sea.
  • 9. The total hydrological cycle can be written in the form as follows PRECIPITATION (P)= EVAPORATION + RUNOFF
  • 10. RAINFALL (PRECIPITATION) ● Rainfall is a natural process in which vapour in the atmosphere changes into water. ● The water so formed then travels from atmosphere to earth . FORMATION OF PRECIPITATION: RAINFALL occurs when the capacity of an air mass to hold the vapour exceeds for the following reasons ; 1. HOT AIR Has high capacity to hold the vapour particles under suspension. When the air gets cooled the capacity of air mass to hold vapour particles is much reduced and the vapour precipitates in the form of water drops. 2. At times variations in pressure bring about the changes of state from vapour to rainfall.
  • 11. EXPRESSION OF RAINFALL The yearly, monthly or daily rainfall is expressed in cm, or millimeters of depth over a particular area which receives the precipitation. One centimetre of rainfall mean that the water precipitated on a certain plain area in the form of rainfall which is not lost in any manner and there is no runoff and evaporation then all the water accumulates on the surface in the form of layer. When the layer of this deposited water is 1cm thick it is supposed that 1 cm rainfall has occurred.
  • 12. MEASUREMENT OF RAINFALL- Rain gauges Rain gauges Non Automatic (non recording type) Automatic (Recording type) tipping bucket Weighing bucket Symon’s rain gauge Float type
  • 14. ● It consist of a funnel and a cylindrical zinc bottle. ● The diameter of the bottle and the top of the funnel is 127mm ● The funnel is fitted in the bottle neck , both are then placed in a metal casing ● The base of metal casing is enlarged to 210mm ● The capacity of bottle is such as to collect the rainfall likely to occur in 24 hours time ● The gauge is provided with graduated jar which measures water in mm ● The smallest division in jar is 0.2mm ● Installation : at the site where the rainfall is to be measured a concrete block of cubical shape of 60cm size is constructed. The casing is fixed in the block permanently in such a way that the top of casing is about 30cm above the natural surface level. While fixing the gauge precaution is to be taken to perfectly level the top of the funnel
  • 15. Measurement ● The rain gauge is adjusted every day for measurement of rainfall ● Rainfall is measured every day at 8.30 AM ● In case of heavy rainfall it is measured for more times and is recorded as the total rainfall of that day Points to observed while fixing the site for rain gauge station: 1. The rain gauge should be set up in an open place by at least 30 meters away from obstructions. 2. The rain gauge should not be set up on the top of a hill. 3. If it is not possible to find a levelled surface the site should be properly shielded from gusty winds. 4. A fence should be erected to protect the gauge from cattle
  • 17. ● This type of rain gauge consists of a funnel rotating drum, a float, float rod which connects the float to the pen carrier ● The pen carrier , carries a pen which moves up and down on the graph paper fixed to the rotating drum ● It also consists of a syphon and as such this type of rain gauge is also called syphon rain gauge. ● The drum rotates around the vertical axis once in 24 hours. ● When rainfalls water enters into the box raises the float by a suitable mechanism. ● It causes the movement of the pen on a revolving chart ● The pen will mark line on the graph and the inclination of the line will depend on the movement of the float which again depends on the intensity of rainfall ● When the float reaches upto a certain level, syphoning action starts and the box is emptied quickly ● The curve obtained on the graph is called MASS CURVE OF RAINFALL
  • 18. INFORMATIONS FROM FLOAT TYPE RAIN GAUGE 1. DURATION OF RAINFALL 2. INTENSITY OF RAINFALL 3. TOTAL AMOUNT OF RAINFALL
  • 19. FACTORS AFFECTING RAINFALL HEIGHT OF THE PLACE ABOVE SEA LEVEL: At high altitudes temperature is very low and when clouds reach these areas they are eroded and there will be heavy rainfall NEARNESS TO FORESTS NEARNESS TO SEA DIRECTION OF WINDS
  • 21. ● Weighing bucket type rain gauge is most common self-recording rain gauge. ● It consists of a receiver bucket supported by a spring or lever balance or some other weighing mechanism. ● The movement of bucket due to its increasing weight is transmitted to a pen which traces record or some marking on a clock driven chart. ● Weighing bucket type rain gauge instrument gives a plot of the accumulated (increased) rainfall values against the elapsed time and the curve so formed is called the mass curve.
  • 22. TIPPING BUCKET TYPE In this type a pair of tipping buckets is placed below a funnel. The bucket gets filled up by 0.25 mm of rainfall and immediately it tips and empties the water into a chamber below. At that very instant other bucket comes below the funnel to receive rainwater. The tipping of the bucket actuates an electrical circuit which moves a pointer to register the rainfall on a graph. The water collected in the chamber below could also be measured by a measuring jar.
  • 23.
  • 24. RAINFALL RECORDS The number of rain gauge stations in a catchment basin mostly depend on the extent of the area, climate and topographic conditions. AREA IN SQ.KM NO OF RAIN GAUGE STATIONS Less than 125 1 126- 250 2 251-500 3 501-1000 4
  • 25. ● Rainfall measured at every 24 hours ● Usually at 8 AM IST ● The total rainfall occurred in past 24 hours is entered against on which the measurement is done. ● It means that rainfall recorded on a particular day is the rainfall of 8 hours of the day and 16 hours of the previous day ● Records are maintained on daily, monthly , yearly basis
  • 26. USE OF RAINFALL RECORDS 1. To calculate the run off 2. To predict the floods 3. To study the trend of rainfall 4. To determine the water requirements of crops
  • 27. COMPUTING AVERAGE RAINFALL OVER AN AREA The average rainfall over a catchment area can be computed by measuring the rainfall A network of rain gauges should be so planned to have a correct representative There should not be concentration of gauges in areas of heavy rainfall 3 methods: 1. Arithmetic average method 2. Thiessen polygon method 3. Isohyetal method
  • 28. ARITHMETIC AVERAGE METHOD ● This is the simplest method of computing the average rainfall over a basin. ● As the name suggests, the result is obtained by the division of the sum of rain depths recorded at different rain gauge stations of the basin by the number of the stations. ● If the rain gauges are uniformly distributed over the area and the rainfall varies in a very regular manner, the results obtained by this method will be quite satisfactory and will not differ much than those obtained by other methods. ● This method can be used for the storm rainfall, monthly or annual rainfall average computations.
  • 29. ● AVERAGE DEPTH OF RAINFALL OVER THE BASIN = TOTAL RAINFALL/ NO OF RAIN GAUGE STATIONS RAIN GAUGE STATIONS RAINFALL IN MM A 54 B 48 C 50 D 59 E 52 5 263 AVG RAINFALL = 263/5 = 52.6mm
  • 30. If 2 of rain gauge stations are located in a forest region which recorded the highest rainfall when compared to the other stations the method of computation has to be done in this way Rain gauge stations Rainfall in mm A 54 B 126 C 50 D 120 E 52
  • 31. Sum of rainfalls recorded in stations A,C E which are nearer to each other =54+50+52=156mm Average rainfall in these stations=156/3 = 52mm Sum of rain fall recorded in stations B and D which are nearer to each other = 126+120= 246mm Average rainfall in these two stations = 246/2= 123mm Average rainfall in the entire basin = 52+123 /2 = 175/2 =87.5mm
  • 32. THIESSON’ POLYGON METHOD This is the weighted mean method. The rainfall is never uniform over the entire area of the basin or catchment, but varies in intensity and duration from place to place. Thus the rainfall recorded by each rain gauge station should be weighted according to the area, it represents. This method is more suitable under the following conditions: -For areas of moderate size. -When rainfall stations are few compared to the size of the basin. -In moderate rugged areas.
  • 33. For the construction of the polygon, the following procedure is to be followed:
  • 34.
  • 35. Step 3: Draw perpendicular bisectors to the triangle sides. These bisectors form polygons around the stations
  • 36. Step 4: Delineate the formed polygons and measure their areas using a planimeter or by converting them into smaller regular geometric shapes (i.e. triangles, squares, rectangles, etc.) Step 5: Compute the average rainfall using the following formula P1xA1 + P2 xA2 +... + PnxAn (A1 + A2 + .... + A)
  • 37. Station No. Bi-sectional areas (Ai) [km2] Measured precipitation (Pi) [mm] (Col. 2 * Col. 3) (Ai *Pi) P1 25 10 250 P2 125 15 1875 P3 80 20 1600 P4 90 17 1530 P5 120 25 3000 P6 115 40 4600 P7 130 12 1560 Total 685 14415
  • 38. ISOHYTEL METHOD An isohyetal is a line joining places where the rainfall amounts are equal on a rainfall map of a basin. An isohyetal map showing contours of equal rainfall is more accurate picture of the rainfall over the basin. This method is more suited under the following conditions: -For hilly and rugged areas. -For large areas over 5000 km2. -For areas where the network of rainfall stations within the storm area is sufficiently dense, isohyetal method gives more accurate distribution of rainfall.
  • 39. Step 1: Draw the area under study to scale and mark rain gauges on it. Put at each of the rain gauge location the recorded values of rainfall at the station, for the period within which the average is required to be determined. Step 2:DRAW the isohyets of various values of the point rainfall data as guidelines and interpolating between them.
  • 40. Step 3: Determine the area between each pair of the isohyet lines, either by a planimeter or by converting the areas into smaller regular geometric shapes Step 4: Calculate the average rainfall using the following formula: A1 (P1 + P2)/2 + A2 (P2 + P3)/2 + . . . + An-1(Pn-1 + Pn)/2 P av = (A1 + A2 + . . . + An) Pi = Value of Isohyet lines Ai = Area between pair of isohyet lines.
  • 41. COMPARISON BETWEEN 3 METHODS ARITHMETIC MEAN METHOD THIESSEN POLYGON METHOD ISOHYETAL METHOD ● This is the simplest and easiest method to compute average rainfall. ● If the recording stations and rainfall is uniformly distributed over the entire catchment, then this method is equally accurate In this method the rainfall stations located at a short distance beyond the boundary of drainage are also used to determine the mean rainfall of the basin, but their influence diminishes as the distance from the boundary increases. 1It is the most accurate method if the contours are drawn correctly. However to obtain the best results good judgment in drawing the isohyets and in assigning the proper mean rainfall values to the area between them is required. In this method every station has equal weight regardless its location. commonly used for flat and low rugged areas 1It is the best method for rugged areas and hilly regions.

Editor's Notes

  1. https://www.youtube.com/watch?v=WESCNWRMoZU siphonic action
  2. https://www.youtube.com/watch?v=aRge32RUOus