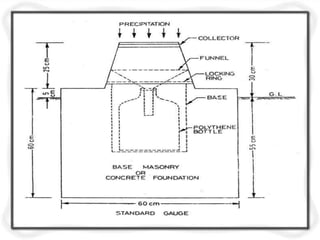
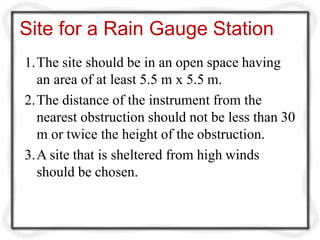
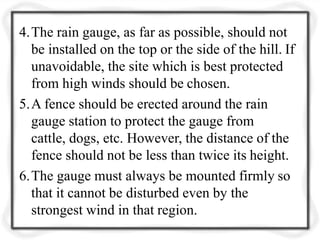
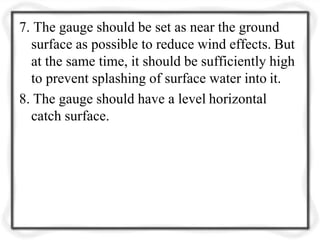
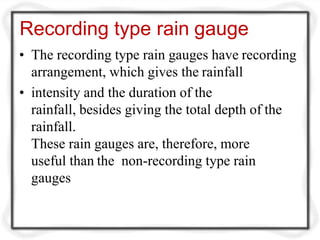
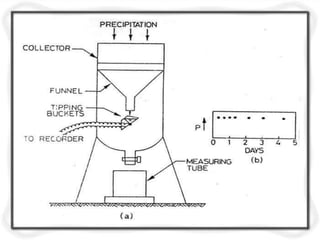
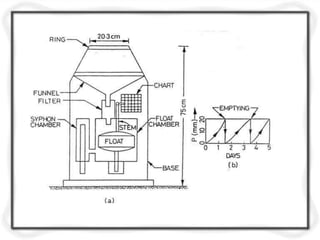
This document provides an introduction to engineering hydrology. It discusses key hydrological concepts like the hydrological cycle, precipitation types and measurement, and mechanisms of precipitation. Engineering hydrology deals with water resource estimation, processes like precipitation and runoff, and problems like floods and droughts. Precipitation is measured using non-recording rain gauges and recording rain gauges like tipping buckets, weighing buckets, and float gauges. Site selection for rain gauges and data preparation are also outlined.
Introduction, hydrologic cycle, climate and water m1Bibhabasu Mohanty
Introduction, Hydrologic cycle, Climate and water availability, Water balances,
Precipitation: Forms, Classification, Variability, Measurement, Data analysis, Evaporation and its measurement, Evapotranspiration and its measurement, Penman Monteith method. Infiltration: Factors affection infiltration, Horton’s equation and Green Ampt method.
Civil v-hydrology and irrigation engineering [10 cv55]-notesSuryenn Edwie Mon
WRE: UNIT–I:
Surface Water Hydrology: Water Resources in India, Hydrology in water Resources Planning –Precipitation – Types,
Measurement of rainfall, Average depth of rainfall over an area, Mean annual rainfall, consistency of rainfall record, Double
mass curve; Infiltration – Factors affecting and its determination, Evaporation and Evapo-Transpiration. Runoff – factors
affecting runoff, methods of determination of runoff, stream gauging.
UNIT-II:
Hydrograph analysis: Base flow separation, Unit Hydrograph – Hydrograph of different durations, applications of unit
hydrograph, S-hydrograph, Flood Forecasting Techniques.
Ground Water Hydrology: Mechanics of interstitial flow, definitions, sub surface distribution of water, types of aquifers,
ground water movement, Darcy’s law, Well hydraulics – steady flow into wells in Un-confined and confined aquifers,
determination of hydraulic properties of aquifer, pumping test and recuperation test methods for determination of yield of
open well.
UNIT-III:
Reservoir Planning: Types of reservoir investigations for reservoir planning, selection of site for a reservoir, zones of
storage in a reservoir, reservoir yield, mass curve and demand curve, determination of reservoir capacity, yield from a
reservoir of given capacity, operating schedules, guide curve for reservoir operation, apportionment of total cost of a multi
purpose project, reservoir sedimentation, control of reservoir sedimentation, useful life of a reservoir.
UNIT-IV:
Irrigation: Definition of irrigation, types of irrigation systems – direct and indirect, lift and inundation irrigation system,
methods of irrigation – surface and sprinkler methods, drip irrigation, Soil moisture constants, depth of water held by soil in
root zone. Water requirements of crops, Duty, Delta, Base period and their relationship, crop seasons, factors affecting duty
and methods of improving duty, consumptive use of water, determination of canal capacities for cropping patterns.
UNIT-V:
Canal Systems: Classification of irrigation canals – canal alignment, design of unlined canals, regime theories – Kennedy’s
and lacey’s theories, tractive - force method, design problems – balancing depth of canal.
Introduction global water resource,global water uses,hydrological cycle (water cycle),common hydrological units,component of hydrological cycle,water budget, methods for measuring precipitation.like arithematic average method,thessen ploygon method and isohytel method.
Hydrology, Runoff methods & instruments, Site selectionRaveen Ramanan
Hydrology.
Runoff Defn, need, Factors affecting runoff.
Runoff measurement methods.
Runoff measuring instruments.
Factors considered for site analysis.
Case study.
References.
Introduction
Hydrology
Water cycle
Watershed Development
Integrated Watershed Management
Water Conservation & Harvesting
Basic introduction of hydraulic structures.
conclusion
references
It is a topic from Engineering Hydrology authored by Raghunath. It was my report when I took up this subject on 2nd semester, 2014-2015 during my 4th year level. It was under my instructor, Engr. Bernadeth V. Dapun, MERIE
Hydrological cycle- Meteorological measurements – Requirements, types and forms of Precipitation-Rain Gauges-Spatial analysis of rainfall data using Thiessen and Isohyetal methods Infiltration-Infiltration Index-Interception-Evaporation, Watershed, catchment and basin - Catchment characteristics - factors affecting runoff – Runoff estimation using empirical
Brief description of Hydrology, various spheres of Hydrology, applications and utilities of Engineering Hydrology and understanding possibilities of flood.
Features:
View watershed boundary and drainage network, and contour map layers
Find area of a selected watershed
View ground profile along and across the stream path
View existing water conservation structures along with photo
Manage watershed structures
Add Water Conservation Structure
Change Status of Structure (Proposed, Under Progress, Completed)
Technology
Google Maps API
Google Elevation API
Google Fusion Tables (for polyline and polygon data)
ASP.NET, SQL Server 2008 (for point data)
chapter 2.ppt ,hydrological study of ethi0mulugeta48
hydrology ,A programme of groundwater investigations is to obtain information on the resource through systematic collection, synthesis, interpretation and compilation of data.
It seeks information on its occurrence, movement, storage, recharge, discharge, quality & quantity.
It includes the study of its geological, environmental, as well as the hydrologic and hydraulic aspects of its flow system.
Geologic Methods
A geologic investigation begins with the collection, analysis, and hydrogeologic interpretation of existing topographic map, aerial photographs, geologic maps and logs, and other pertinent records.
This should be supplemented, when possible, by geologic field reconnaissance and by evaluation of available hydrologic data on: stream flow and springs; well yields; groundwater recharge & levels; and water quality
The term precipitation is also used to refer all forms of falling moisture viz., rainfall, snowfall, sleet, hail etc. Rainfall occurs in the form of a pattern. Atmospheric Precipitation is a wonderful process for the whole globe to use. This module explains it in general.
Introduction to Hydrology, Stream GaugingAmol Inamdar
Introduction to Hydrology, Types of Rain gauges, Factors affecting evaporation and infiltration, Stream gauging, Mass curve, Hyetograph, DAD Curve, Horton's Method, Infiltrometers, fi-index, W-index, Methods of measurement of Discharge of Stream, Area-Velocity Method, Moving Boat Method, Salt concentration method, ADCP, Current meter, River staging
This presentation includes basic terminologies of hydraulics and basics of rainfall, measurement of rainfall methods of average rainfall and runoff and its calculations
Hybrid optimization of pumped hydro system and solar- Engr. Abdul-Azeez.pdffxintegritypublishin
Advancements in technology unveil a myriad of electrical and electronic breakthroughs geared towards efficiently harnessing limited resources to meet human energy demands. The optimization of hybrid solar PV panels and pumped hydro energy supply systems plays a pivotal role in utilizing natural resources effectively. This initiative not only benefits humanity but also fosters environmental sustainability. The study investigated the design optimization of these hybrid systems, focusing on understanding solar radiation patterns, identifying geographical influences on solar radiation, formulating a mathematical model for system optimization, and determining the optimal configuration of PV panels and pumped hydro storage. Through a comparative analysis approach and eight weeks of data collection, the study addressed key research questions related to solar radiation patterns and optimal system design. The findings highlighted regions with heightened solar radiation levels, showcasing substantial potential for power generation and emphasizing the system's efficiency. Optimizing system design significantly boosted power generation, promoted renewable energy utilization, and enhanced energy storage capacity. The study underscored the benefits of optimizing hybrid solar PV panels and pumped hydro energy supply systems for sustainable energy usage. Optimizing the design of solar PV panels and pumped hydro energy supply systems as examined across diverse climatic conditions in a developing country, not only enhances power generation but also improves the integration of renewable energy sources and boosts energy storage capacities, particularly beneficial for less economically prosperous regions. Additionally, the study provides valuable insights for advancing energy research in economically viable areas. Recommendations included conducting site-specific assessments, utilizing advanced modeling tools, implementing regular maintenance protocols, and enhancing communication among system components.
Immunizing Image Classifiers Against Localized Adversary Attacksgerogepatton
This paper addresses the vulnerability of deep learning models, particularly convolutional neural networks
(CNN)s, to adversarial attacks and presents a proactive training technique designed to counter them. We
introduce a novel volumization algorithm, which transforms 2D images into 3D volumetric representations.
When combined with 3D convolution and deep curriculum learning optimization (CLO), itsignificantly improves
the immunity of models against localized universal attacks by up to 40%. We evaluate our proposed approach
using contemporary CNN architectures and the modified Canadian Institute for Advanced Research (CIFAR-10
and CIFAR-100) and ImageNet Large Scale Visual Recognition Challenge (ILSVRC12) datasets, showcasing
accuracy improvements over previous techniques. The results indicate that the combination of the volumetric
input and curriculum learning holds significant promise for mitigating adversarial attacks without necessitating
adversary training.
Hierarchical Digital Twin of a Naval Power SystemKerry Sado
A hierarchical digital twin of a Naval DC power system has been developed and experimentally verified. Similar to other state-of-the-art digital twins, this technology creates a digital replica of the physical system executed in real-time or faster, which can modify hardware controls. However, its advantage stems from distributing computational efforts by utilizing a hierarchical structure composed of lower-level digital twin blocks and a higher-level system digital twin. Each digital twin block is associated with a physical subsystem of the hardware and communicates with a singular system digital twin, which creates a system-level response. By extracting information from each level of the hierarchy, power system controls of the hardware were reconfigured autonomously. This hierarchical digital twin development offers several advantages over other digital twins, particularly in the field of naval power systems. The hierarchical structure allows for greater computational efficiency and scalability while the ability to autonomously reconfigure hardware controls offers increased flexibility and responsiveness. The hierarchical decomposition and models utilized were well aligned with the physical twin, as indicated by the maximum deviations between the developed digital twin hierarchy and the hardware.
Cosmetic shop management system project report.pdfKamal Acharya
Buying new cosmetic products is difficult. It can even be scary for those who have sensitive skin and are prone to skin trouble. The information needed to alleviate this problem is on the back of each product, but it's thought to interpret those ingredient lists unless you have a background in chemistry.
Instead of buying and hoping for the best, we can use data science to help us predict which products may be good fits for us. It includes various function programs to do the above mentioned tasks.
Data file handling has been effectively used in the program.
The automated cosmetic shop management system should deal with the automation of general workflow and administration process of the shop. The main processes of the system focus on customer's request where the system is able to search the most appropriate products and deliver it to the customers. It should help the employees to quickly identify the list of cosmetic product that have reached the minimum quantity and also keep a track of expired date for each cosmetic product. It should help the employees to find the rack number in which the product is placed.It is also Faster and more efficient way.
Explore the innovative world of trenchless pipe repair with our comprehensive guide, "The Benefits and Techniques of Trenchless Pipe Repair." This document delves into the modern methods of repairing underground pipes without the need for extensive excavation, highlighting the numerous advantages and the latest techniques used in the industry.
Learn about the cost savings, reduced environmental impact, and minimal disruption associated with trenchless technology. Discover detailed explanations of popular techniques such as pipe bursting, cured-in-place pipe (CIPP) lining, and directional drilling. Understand how these methods can be applied to various types of infrastructure, from residential plumbing to large-scale municipal systems.
Ideal for homeowners, contractors, engineers, and anyone interested in modern plumbing solutions, this guide provides valuable insights into why trenchless pipe repair is becoming the preferred choice for pipe rehabilitation. Stay informed about the latest advancements and best practices in the field.
The Benefits and Techniques of Trenchless Pipe Repair.pdf
Hwre module 1
1. Module 1:- Introduction
Prepared By:- Dasani Yash R (Assi. Prof.)
Civil Engineering Department, DRVRGCET
Hydrology & Water Resource
Engineering
2. Introduction
• Hydrology deals with the
occurrence, circulation and distribution of
water upon, over and beneath the earth surface.
• Engineering hydrology includes those
segments of the field related to
planning, design, and operation of engineering
projects for the control and use of water.
3. • engineering hydrology deals with -
(1)estimation of water resources
(2)the study of processes such as precipitation,
runoff, Evapotranspiration and their interaction
and
(3)the study of problems such as flood and
draught and strategies to combat them.
4. Applications
• The capacity of storage structures such as
reservoirs
• The magnitude of flood flows to enable safe
disposal of the excess flow.
• The minimum flow and quantity of flow
available at various seasons.
• The interaction of the flood wave and
hydraulic structures, such as
levees, reservoirs, barrages and bridges.
5. Hydrological cycle
• water circulatory system on earth the waters of
the earth, linking atmosphere, land, and
oceans.
• water evaporates from the ocean surface,
driven by energy from the sun, and joins the
atmosphere, moving inland
• Atmospheric conditions act to condense and
precipitate water onto the land surface
6.
7. Elements of hydrological cycle
• Evaporation, E
• Transpiration, T
• Precipitation, P
• Surface runoff, R
• Groundwater flow, G, and,
• Infiltration, I
8. Precipitation
• All forms of water that reach the earth from the
atmosphere is called Precipitation.
• The
rainfall,
usual forms are
snowfall, frost, hail, dew. Of all
these, the first two contribute significant amounts
of water.
• Rainfall being the predominant form of
precipitation causing stream flow, especially the
flood flow in majority of rivers. Thus, in this
context, rainfall is used synonymously with
precipitation.
9.
10. • In nature water is present in three aggregation
states:
– solid: snow and ice;
– liquid: pure water and solutions;
– gaseous: vapors under different grades of pressure
and saturation
• The water exists in the atmosphere in these
three aggregation states.
11. • Types of precipitation
– Rain, snow, hail, drizzle, glaze, sleet
• Rain:
– Is precipitation in the form of water drops of
size larger than 0.5 mm to 6mm
– The rainfall is classified in to
• Light rain – if intensity is trace to 2.5 mm/h
• Moderate – if intensity is 2.5 mm/hr to 7.5
mm/hr
• Heavy rain – above 7.5 mm/hr
12. • Snow:
– Snow is formed from ice crystal masses, which
usually combine to form flakes
• Hail (violent thunderstorm)
– precipitation in the form of small balls or lumps
usually consisting of concentric layers of clear ice and
compact snow.
– Hail varies from 0.5 to 5 cm in diameter and can be
damaging crops and small buildings.
13. • Sleet - droplets that freeze once entering the
freezing layer of air.
• Drizzle – fine sprinkle of numerous water droplets
of size less than 0.50 mm and intensity less than 1
mm/h.
• Glaze – when rain or drizzle comes in contact
with cold ground at around 0 ˚C, the water drops
freeze to form ice coating called glaze or freezing
rain.
14.
15. Mechanisms for air lifting
1. Frontal lifting
2. Orographic lifting
3. Convective lifting
16. Definitions
• Air mass : A large body of air with similar
temperature and moisture characteristics over its
horizontal extent.
• Front: Boundary between contrasting air masses.
• Cold front: Leading edge of the cold air when it is
advancing towards warm air.
• Warm front: leading edge of the warm air when
advancing towards cold air.
17. Frontal Lifting
• Boundary between air masses with different
properties is called a front
• Cold front occurs when cold air advances towards
warm air
• Warm front occurs when warm air overrides cold air
Cold front (produces cumulus cloud) Cold front (produces stratus cloud)
19. Hot earth
surface
Convective lifting
Convective precipitation occurs when the air near the
ground is heated by the earth’s warm surface. This
warm air rises, cools and creates precipitation.
20. Precipitation Variation
• Influenced by
– Atmospheric circulation and local factors
• Higher near coastlines
• Seasonal variation – annual oscillations in some
places
• Variables in mountainous areas
• Increases in plains areas
23. Measurement of precipitation
• Precipitation is expressed in terms of depth to
which rainfall water would stand on an area if
all the rain were collected on it.
• Rainfall at a place can be measured by a rain
gauge. The rain gauge may be broadly
• classified into two types.
(1) Non-recording type rain gauge
(2) Recording type rain gauge.
24. Non-recording type rain gauge
• The Symon rain gauge consists of a cylindrical
vessel, called metal casing, of 12.7 cm
diameter, with a base of 21.0cm. The metal
casing is fixed vertically to a masonry
foundation block of the size 60 cm x 60 cm x
60 cm. A funnel with a circular rim of 12.7 cm
and a glass bottle are placed in the metal
casing.
25. • The height of the metal casing is fixed so that
the rim is 30.5 cm above the ground surface.
• The glass bottle, called the receiver, is of 7.5 to
10 cm diameter. The rain gauge is kept in
open.
• The rain falling into the funnel is collected in
the receiver.
• The receiver, with the rain water in it, is taken
out of the metal casing.
26. • The rainfall depth is measured with a special
measuring glass jar graduated in mm of
rainfall.
• It can measure up to 12.5 mm of rainfall.
• During heavy rains, the rainfall is measured 3
or 4 times in a day.
• The total rainfall of the day is obtained by
adding all the individual measurements of day.
27.
28. Site for a Rain Gauge Station
1.The site should be in an open space having
an area of at least 5.5 m x 5.5 m.
2.The distance of the instrument from the
nearest obstruction should not be less than 30
m or twice the height of the obstruction.
3.A site that is sheltered from high winds
should be chosen.
29. 4.The rain gauge, as far as possible, should not
be installed on the top or the side of the hill. If
unavoidable, the site which is best protected
from high winds should be chosen.
5.A fence should be erected around the rain
gauge station to protect the gauge from
cattle, dogs, etc. However, the distance of the
fence should not be less than twice its height.
6.The gauge must always be mounted firmly so
that it cannot be disturbed even by the
strongest wind in that region.
30. 7. The gauge should be set as near the ground
surface as possible to reduce wind effects. But
at the same time, it should be sufficiently high
to prevent splashing of surface water into it.
8. The gauge should have a level horizontal
catch surface.
31. Recording type rain gauge
• The recording type rain gauges have recording
arrangement, which gives the rainfall
• intensity and the duration of the
rainfall, besides giving the total depth of the
rainfall.
These rain gauges are, therefore, more
useful than the non-recording type rain
gauges
33. Tipping bucket rain gauge
• The tipping bucket rain gauge consists of two small
buckets placed below the funnel fitted in a 30 cm
diameter receiver .
• The buckets are balanced in an unstable equilibrium
about a horizontal axis such that at one time only one
bucket remains below the funnel.
• One bucket is always higher than the other. As the
rainfall is collected by the receiver, it passes through
the funnel to the higher bucket.
34. • After a certain small amount of rainfall
(usually 0.25 mm) is received by the higher
bucket, it becomes unstable and tips to empty
itself into a measuring tube placed below it.
• At the same time, the other bucket comes to
the higher position and starts colleting the
rainfall.
35. • The tipping of the bucket actuates an electric
circuit, which causes a pen to make a mark on
a chart wrapped around a drum revolved by a
clock-driven mechanism.
• Thus each mark on the chart corresponds to a
rainfall of 0.25 mm.
• By counting the number of marks and noting
the time, the intensity and amount of the
rainfall can be determined.
36.
37. Weighing Bucket Rain Gauge
• The rain is collected by a weighing bucket
through a funnel.
• The bucket rests on a weighing platform of a
spring or lever balance attached to a weighing
mechanism.
• As the bucket is filled with rain water, its
weight increases and the weighing platform
moves downwards.
38. • The movement of the weighing platform is
transmitted to a pen through a system of links
and levers.
• The pen makes a trace of the accumulated
amount of rainfall on a chart attached to a
drum revolved by a clock driven mechanism.
• The record is continuous and is in the form of
the conventional mass curve .
39. • The rotation of the drum sets the time scale whereas
the vertical motion of the pen records the cumulative
rainfall.
• The slope of the mass curve at any point gives the
intensity of the rainfall.
40. Float type rain gauge
• In the float-type gauge, the precipitation
falling on the receiver passes through the
funnel and filter and is collected in a float
chamber.
• The filter prevents dust, debris, etc, from
entering the float chamber.
• The float chamber contains a float with a
vertical stem fixed over it.
• A pen is mounted on the top of the vertical
stem.
41.
42. • As the rain is collected in the float
chamber, the float rises and the pen moves on
a chart fixed on a drum revolved by a clock-
driven mechanism.
• The pen thus marks a trace of the cumulative
depth of rainfall on the chart.
• The record is in the form of the conventional
mass curve, from which the intensity and
duration of rainfall can be determined.
43. Preparation of Data
• Before using the rainfall records of a station, it
is necessary to first check the data for
continuity and consistency.
• The continuity of a record may be broken with
missing data due to many reasons such as
damage or fault in a rain gauge during a
period.
• The missing data can be estimated by using the
data of the neighbouring stations.
44. • In these calculations, the normal rainfall is
used as a standard of comparison.
• The normal rainfall is the average value of
rainfall at a particular data, month or year over
a specified 30-year period or so.
• The normal rainfall is updated every ten years.
45. Estimation of missing rainfall data
1. Arithmetic average method
2. Comparison method
3. Normal ratio method
4. Isohyetal map method
46. 1. Arithmetic average method
• If normal annual precipitation at adjacent
stations are within 10% of annual normal
rainfall of the station under consideration, then
the missing rainfall data may be estimated as
simple arithmetic avg. of rainfall at adjacent
rain gauges.
Px = 1/n (P1+P2+----+Pn)
• Px = precipitation at station x
• P1, P2,---Pn = rainfall at surrounding rain
gauges
47. 2. Comparison method
• If the rainfall record of a rain gauge station (say. X) is
missing for a relatively long period, such as a month
or a year, it can be estimated by comparing the mean
annual rainfall of the station X with that of an
adjoining station A.
• where PX and PA are the precipitations of the stations
X and A for the missing period
• NX and NA are the mean annual rainfalls of the
stations X and A.
48. 3. Normal ratio method
• When there is the short break in the
precipitation data of a rain gauge station, it can
be estimated from the observed data of three
adjoining index stations A, B and C, which are
evenly distributed around the station X.
49. • Nx = normal annual rainfall at station X
• NA, NB, --- NM = normal annual rainfalls at n
surrounding rain gauges respectively.
• A minimum 3 surrounding stations are
generally used in normal ratio method.
50. 4. Isohyetal map method
• Isohyets are the contours of equal rainfall depth.
• An isohyetal map is prepared from
• the record of various rain gauge stations by
interpolation.
• The isohyetal map method is suitable for the
estimation of the missing data of a station X due to a
particular storm.
• An isohyetal map is prepared from the data of the
various rain gauge stations, and the precipitation of
the station X is estimated from the two isohyets
between which the station lies.
51. • It consider rainfall characteristics including
average patterns, distance from
sea, topography and storm paths.
• Interpolation of missing data from such maps
reasonably accurate.
52. Average Rainfall Depth Over An Area
• The rainfall recorded by a rain gauge
represents the rainfall at that station.
• It is also called the point rainfall.
• In many hydrological studies, the average
depth of rainfall over a specified area due to a
storm, or due to a number of storms, is
required.
• For determination of the average precipitation
over an area, a large number of rain gauges are
installed.
53. • The average rainfall over the area is found
from the rainfall data of these rain gauges by
one of the following three methods:
1. Arithmetic mean method
2. Thiessen polygon method
3. Isohyetal map method
54. Arithmetic Mean Method
P2
P3
• Simplest method for determining areal average
P1 = 10 mm
P1
P = 20mm2
P3 = 30 mm
• Gauges must be uniformly distributed.
• Gauge measurements should not vary greatly
about the mean.
N
iPP
i 1
1
N
30
20 mmP
10 20
3
55. Thiessen polygon method
P1
P2
A1
A2
P3
A3
• Any point in the watershed
receives the same amount of
rainfall as that at the nearest
gauge
• Rainfall recorded at a gauge can
be applied to any point at a
distance halfway to the next
station in any direction
56. N
i iAPP
i 1
1
A
P1 = 10 mm, A1= 12 Km2
P2 = 20 mm, A2= 15 Km2
P3 = 30 mm, A3= 20km2
P
20 30
20.7 mm
12 10 15 20
47
Steps in Thiessen polygon method
1. Draw lines joining adjacent gauges
2. Draw perpendicular bisectors to the lines created in step
1
3. Extend the lines created in step 2 in both directions to
form representative areas for gages
4. Compute representative area for each gage
5. Compute the area average using the following formula
57. Isohyetal method
P1
P2
10
20
30
• Steps
– Construct isohyets (rainfall
contours)
– Compute area between each
ipair of adjacent isohyets (A)
– Compute average
precipitation for each pair of
adjacent isohyets (pi)
– Compute areal average using
the following formula
A1=5 , p1 = 5
A2=18 , p2 = 15
A3=12 , p3 = 25
P3
A4=12 , p3 = 35
P 21.6 mm
5 5 18 15 12 25 12 35
47
N
i iAPP
i 1
1
A
58. Presentation of rainfall data
• The rainfall data are usually presented either in
the form of a mass curve or a hyetograph.
(a) Mass Rainfallcurve
• The mass rainfall curve is a plot between the
accumulated rainfall at a station against time
as abscissa, plotted in chronological order.
• The recording type rain gauge gives directly
the mass curve.
59. • The mass curve of a non-recording gauge can be
prepared from the knowledge of the beginning
and the end of the storm, and distributing the total
depth of the rainfall over the various periods
according to the mass rainfall curves of the
adjacent recording rain gauge stations.
• However, such a mass curve is approximate.
• The mass curve is useful for the determination of
the intensity, amount, and duration of the rainfall.
• The amount of duration of the rainfall are
obtained directly from the curve.
60. 2.6 Intensity – Duration – Frequency (IDF) Relationship
Mass Curve of Rainfall
Mass curve of rainfall
0
10
20
30
60
50
40
0 20 40 80 100 12060
Time, hour
accumulatedprecipitation,mm
1st storm,
2nd
storm
61. (b) Hyetograph
• The hyetograph is a bar diagram plotted between the
average intensity of rainfall as ordinate and the time
as abscissa .
• The hyetograph is obtained from the mass rainfall
curve, represented as a bar chat.
• To draw the hyetograph, convenient time interval
chosen and for each time interval corresponding
reading of accumulated rainfall noted from mass
rainfall curve.
• In urban drainage problem small durations used, in
flood flow in larger catchment it is 6 hrs.
62. Hyetograph of a storm
0.5
0.4
0.3
0.2
0.1
0
0 – 8 8 – 16 32 – 40 40 – 4816 – 24 24 – 32
Time, hours
Intensity,cm/hr
Total depth = 10.6 cm
Duration = 46 hr
63. Evaporation
• is the processes in which a liquid changes to
the gaseous state at the free surface, below the
boiling point through the transfer of heat
energy.
• This change in state requires an exchange of
585 Cal for each gram of water evaporated.
• expressed as an evaporation rate in mm / d, cm
/ d , in / d.
64.
65. Factors affecting
(a) Meteorological factors
1.Solar radiation - changes depend upon
latitude, season, time of day and sky condition
(cloudiness)
2.air temperature
3. vapour pressure
4. wind velocity
5. atmospheric pressure
66. (b) Nature of evaporating surface
1. vegetation
2. building
3. paved streets
4. soil surface
5. snow / ice
(c) Water quality
1. salinity
2. dissolved solids
67. Measurement
• The amount of water evaporated from a water
surface is estimated by -
1.Using evaporimeter data (pan evaporation)
2.Emperical, equation (Penman's method, etc.)
3.Analytical methods – (water budget
method, energy budget method, etc.)
68. Pan evaporation
U. S. Class A Evaporation pan
• most commonly used evaporation pan.
• the pan consists of a shallow vessel about 1.21 m
in diameter and 25.5cm deep.
• made of unpainted galvanised iron sheet.
• Where there is corrosion problem, it is made of
monel sheet.
• Water in the pan is filled to a depth of 20cm.
• When the depth of water reduces to 18 cm, it is
refilled.
69.
70. • Water surface level is measured daily with a
hook gauge installed in the stilling well.
• The pan is placed on a wooden platform such
that its base is 15 cm above the ground surface
to allow free circulation of air below the pan.
• Evaporation is computed as the difference
between observed water levels on two
consecutive days.
71. • Alternatively, it is computed from the water
added each day to bring the water level up to a
fixed mark in the stilling well.
• While computing evaporation, adjustment
shall be made for any precipitation occurred
during the period.
72. Colorado Sunken Pan
• this type of pan is buried into the ground such
that the water level is at the ground level.
• The pan is 92 cm square in plan and 46 cm
deep.
• It is made of unpainted galvanised iron
sheet. The main advantage of the sunken
pan over the Class A
• Evaporation pan is that its radiation and
aerodynamic characteristics are closer to those
of a reservoir
73.
74. • However, it has the following disadvantages:
(i)It is more expensive.
(ii) It is more difficult to detect leaks.
(iii)It needs more care to keep the surrounding
area free from grass, dust, etc.
75. IS Standard Pan
• modified form of the U.S. Class A Evaporation
Pan. The pan consists of a shallow vessel made
of copper sheet of 0.9mm thickness, tinned
inside and painted outside.
• The pan is 1.22m in diameter and 25.5 cm in
depth.
• installed on a wooden grillage platform 10 cm
above the ground surface.
76. • The pan has small stilling well in which a
fixed point gauge with a vernier is installed to
measure the level of water.
• The water surface is initially kept 5 cm below
the rim (top) of the pan.
• The daily evaporation is computed as the
difference between the observed water levels
in the pan.
77.
78.
79. Water-Budget Method
• based on measurement of continuity of water flow
essentially, the budget comprised by the various items
of input, and water storage of hydrologic system.
• Continuity equation
• E = (S1 - S2) + I + P - O – Os
• where E = evaporation
• S1, S2 = storage at time 1 and 2
• I = surface inflow, P = precipitation
• O = surface outflow Os = subsurface seepage (most
difficult to evaluate)
80. Advantage
• This method is simple in concept.
Disadvantage
• This method is difficult to do so accurately
because of the effects of errors in measuring
various items involved in the water balance.
81. Energy Budget Method
• it deals with the continuity of energy flow
instead of water flow. Use Continuity equation
in energy units
• Qn – Qh - Qe = Qθ - Qv
• where Qn = net radiation absorbed by water body
• Qh = sensible heat transfer to theatmosphere
• Qe = energy used for evaporation
• Qθ = increased in energy stored in water body
• Qv = advected energy (net energy content of inflow
and outflow elements).
82. Advantage
• It has increasing application to special studies.
Disadvantage
• It involves a great deal of instrumentation.
• It cannot readily be used without much data.
83. Transpiration
• process by which water leaves the body of a
living plant and reach the atmosphere as water
vapour.
• water is taken up by the plant-root system and
escape through the leaves.
84. Factors affecting transpiration
1. atmospheric vapour pressure
2. temperature
3. wind
4. light intensity
5. characteristics of plant
- plant type (- shallow rooted species
- deep rooted species).
- available water .
• - density of vegetative cover.
85. Measurement
Phytometer method
• Practical method for measuring transpiration.
• It is a large vessel filled with soil in which one
or more plants are rooted.
• The soil surface is sealed to prevent
evaporation.
• The only escape of moisture is by transpiration
• which can be determined by weighing the plant
and container at desired intervals
86.
87. • Transpiration loss , T = (W1 + W) –W2
• W1 = is initial wt. ofinstrument
• W2 =final wt. ofinstrument
• W = total wt. of water added during full
growth of plant
• T = loss due to
evaporation
88. Transpiration ratio
• T.R. = (Total mass of water transpired by plant
during full growth)/ mass of dry matter
produced
• Varies with climate and region
89. Evapotranspiration
• sum of the amount of water transpired by plants
during the growth process and that amount that
is evaporated from soil and vegetation in the
domain occupied by the growing crop.
• ET is normally expressed in mm/day.
90. Factors that affect Evapotranspiration
Weather parameters
Crop Characteristics
Management and Environmental aspects are
factors affecting ET
91. Weather Parameters:
The principal weather conditions affecting
Evapotranspiration are:
Radiation
Air temperature
Humidity and
Wind speed.
92. Crop characteristics that affect ET :
Crop Type
Variety of Crop
Development Stage
Crop Height
Crop Roughness
Ground Cover
Crop Rooting Depth
93. Management and Environmental Factors :
Factors such as soil salinity,
Poor land fertility,
Limited application of fertilizers,
Absence of control of diseases and
Pests and poor soil management
May limit the crop development and
reduce soil Evapotranspiration.
94. Determination of ET
Evapotranspiration is not easy to measure.
Specific devices and accurate measurements of
various physical parameters or the soil water
balance in lysimeters are required to determine
ET.
The methods are expensive, demanding and
used for research purposes.
They remain important for evaluating ET
estimates obtained by more indirect methods.
95. Water Balance Method
The Water Balance or Budget Method is a
measurement of continuity of flow of water.
This method consists of drawing up a balance sheet of
all the water entering and leaving a particular
catchment or drainage basin.
The water balance equation can be written as:
ET =I +P –RO –DP +CR +SF +SW
Where: I is Irrigation, P is rainfall, RO is surface
runoff,
rise, SF
DP is deep percolation, CR is capillary
and SW are change in sub-surface flowand
change in soil water content respectively
96. Lysimeter Method
Awater tight tank of cylindrical shape having dia about
2 m and depth about 3 m is placed vertically in
ground.
The tank is filled with sample soil.
Bottom of the tank consists of sand layer and a pan for
collecting surplus water.
The consumptive use of water is measured by the
amount of water required for the satisfactory growth of
plants with in tank.
Cu =Wa -Wd (Cu =consumptive use, Wa =water
applied, Wd =Water drained off)
97.
98.
99. Field experimental method
Some fields are selected for expt.
The quantity of water is applied in such a way
that it is sufficient for satisfactory growth of
crops.
There should be no percolation or deep runoff.
If there is any runoff it should be measured and
deducted from the total quantity of water
applied.
100. Soil moisture study
Several plots of land are selected where irrigation
water is to be supplied.
The soil samples are taken from diff depths at the root
zone of the plants before and after irrigation.
Then water contents of the soil samples are
determined by laboratory tests.
The depth of water removed from soil determined by
Dr =pwd/ 100
(Dr= depth of water removed in m, p =%of water
content, w=sp. Gr. Of soil, d= depth of soil in m)
101. The total quantity of water removed in 30 days
period is calculated.
Then a curve of water consumption versus time
is prepared.
From this curve the water consumption for any
period can be calculated.
102. Infiltration
• is the process by which water on the
ground surface enters the soil.
• Infiltration rate in soil science is a measure
of the rate at which soil is able to
absorb rainfall or irrigation. It is measured
in inches per hour or millimetres per hour.
The rate decreases as the soil becomes
saturated. If the precipitation rate exceeds
the infiltration rate, runoff will usually occur
unless there is some physical barrier.
103. • The rate of infiltration can be measured
using an infiltrometer.
104. Factors Affecting Infiltration
• Slope of the Land
• Degree of
Saturation
• Porosity
• Permeability
• Packing
• Sorting
• Shape
• Capillarity
• Vegetation
• Land Use
105. Infiltration indices
• The two commonly used infiltration indices
are the following:
ϕ – index
W – index
106. ϕ – index (Phi - index)
• This is defined as the rate of infiltration
above which the rainfall volume equals
runoff volume
107. • ϕ – index = precipitation – surface runoff
• ϕ – index = P – Q
• The value of ϕ – index can bederived
from the rainfall hyetograph and the
resulting surface runoff volume.
• ϕ – index can be determined for each
storm for which the surface runoff volume
has been measured.
• ϕ – index = (total infiltration during period
of rainfall excess) / period of rainfall
excess
108. W – index
• Is the average rate of infiltration during the
time when the rainfall intensity exceeds
the infiltration rate.
W – index = (P-Q-S)/tr
P = total precipitation (cm)
Q = total surface runoff (cm)
S = depression and interception losses (cm)
tr = duration of rainfall (hr)
109. • W – index is more accurate than ϕ –index
because it excludes the interception and
depression losses which are considered
as a part of infiltration.
• W – index is always less than ϕ – index.
• Because it is difficult to estimate
depression and interception losses.
• W – index not generally used in practice.
110. • W min – index
• Minimum rate of infiltration when a uniform
stage after stabilization is attained.
• W min index = ϕ – index after it is stabilized
= Kϕ – index, where K is
always less than 1.
111. Measurement of infiltration
• Infiltration capacity of soil can be
measured in field by conducting controlled
expt. using infiltrometers.
• Two types of infiltrometers are commonly
used
1. Flooding type
2. Rainfall simulator type
112. Flooding type infiltrometer
Simple infiltrometer
• metal cylinder of 25 to 30 cm dia and 50 to
60 cm length, open at both ends.
• Cylinder hammer in ground and 10 cm
length projects above the ground.
113. • top surface of soil inside ring is protected
by placing a perforated metallic dish over
it.
• water poured into top part of a depth 5 cm
and pointer is set to mark.
• As infiltration takes place, water level goes
down.
• water maintained by adding water.
• readings are taken at regular time interval
to determine the rate and amount of
infiltration.
114. Rainfall simulator
• Water is applied in form of spray.
• Plate of 4m or 2m selected, water applied in
form of artificial rain at uniform rate.
• Two rows of nozzles are installed to
produce rain drops.
• Various intensities of rainfall can be
simulated by changing nozzles opening.
• Expt. Conducted under controlled
conditions with various combinations of
intensities, durations and surface runoff.
115.
116. Infiltration = Rainfall – surface runoff
• All terms expressed as depth of water over
the plot or as the volume of water.
• Infiltration determined from total infiltration
depth and duration of expt.
117. Horton’s equation
• Named after the same Robert E. Horton.
• Horton's equation is another viable option
when measuring ground infiltration rates or
volumes.
• It is an empirical formula that says that
infiltration starts at a constant rate, f0, and
is decreasing exponentially with time, t.
• After some time when the soil saturation
level reaches a certain value, the rate of
infiltration will level off to the rate fc.
118. ft = is the infiltration rate at time t;
f0 = is the initial infiltration rate or maximum
infiltration rate;
fc = is the constant or equilibrium infiltration
rate after the soil has been saturated or
minimum infiltration rate;
k= is the decay constant specific to the soil.