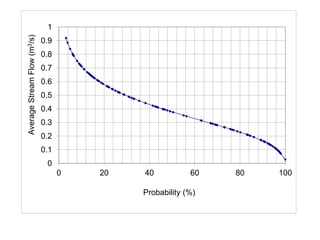
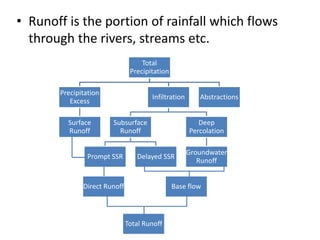
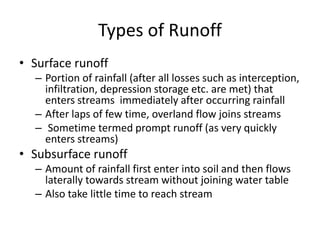
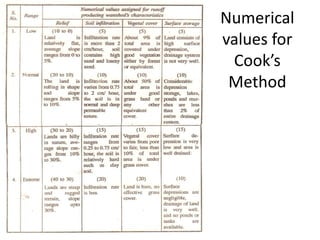
This document discusses different types of runoff including surface runoff, subsurface runoff, and base flow. It explains factors that affect runoff such as climate, physiographic characteristics, soil properties, and land use. Several methods to compute runoff are presented, including the Rational Method, Cook's Method, and the Curve Number Method. Flow duration curves are also introduced to analyze stream flow variability over time.
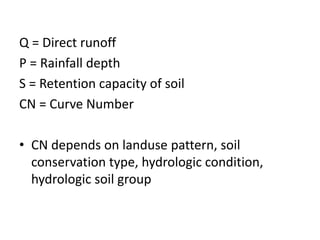
![Curve Number Method
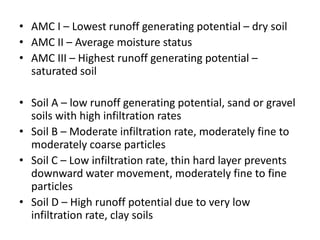
• Calculates runoff on the retention capacity of
soil, which is predicted by wetness status
(Antecedent Moisture Conditions [AMC]) and
physical features of watershed
• AMC - relative wetness or dryness of
a watershed, preceding wetness conditions
• This method assumes that initial losses are
satisfied before runoff is generated
)8.0(
)2.0( 2
SP
SP
Q
)4.25(
2540
S
CN
](https://image.slidesharecdn.com/hydrunoff-191113103706/85/Hyd-runoff-29-320.jpg)