Downloaded 915 times
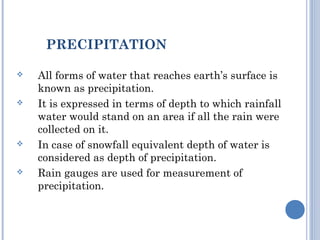
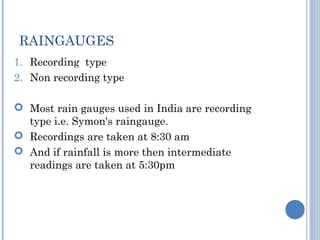

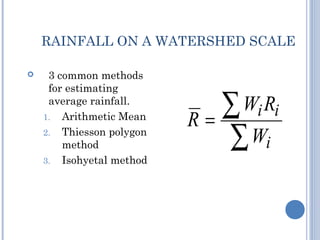
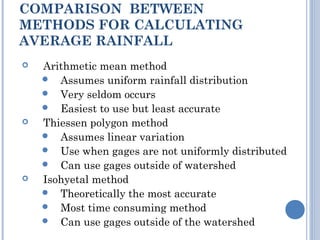
![ARITHMETIC MEAN METHOD
Pavg = [Σ Wi x Pi ] / Σ Wi
All gages given equal weight
Weight = 1
Pavg = (1.82 + 2.15 + 2.26 + 2.18 + 1.62 + 1.8) / 6
Pavg = 1.97 in.
](https://image.slidesharecdn.com/precipitationandraingauges-140223120958-phpapp02/85/Precipitation-and-rain-gauges-26-320.jpg)
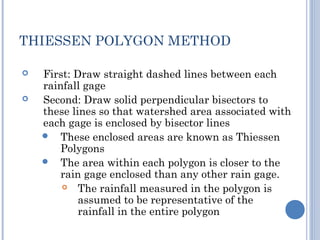
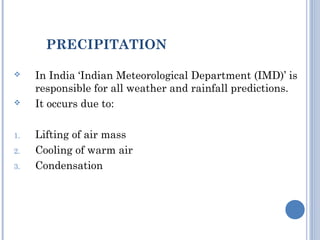
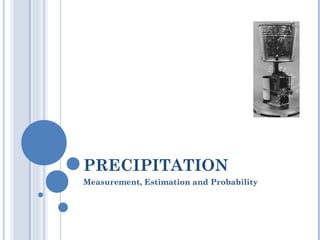
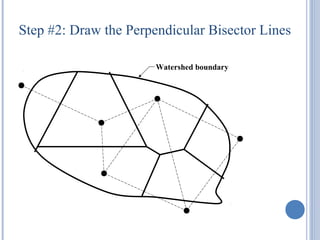
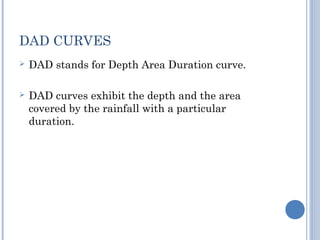
![THIESSEN POLYGON METHOD
Third: Determine the area of each polygon
The rain gage weight is the area of the polygon it is located
in
Fourth: Calculate the average rainfall using:
Pavg = [Σ Wi x Pi ] / Σ Wi](https://image.slidesharecdn.com/precipitationandraingauges-140223120958-phpapp02/85/Precipitation-and-rain-gauges-28-320.jpg)
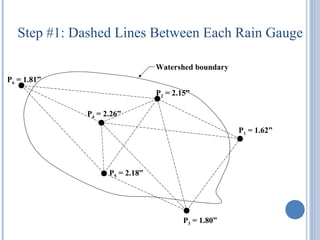
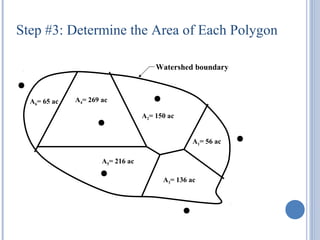
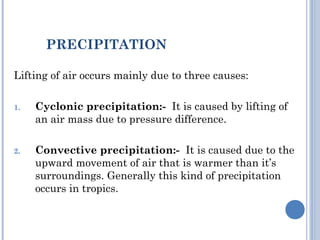
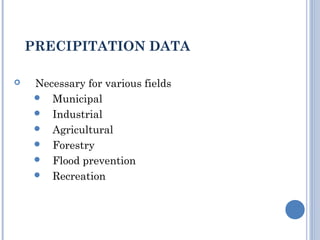
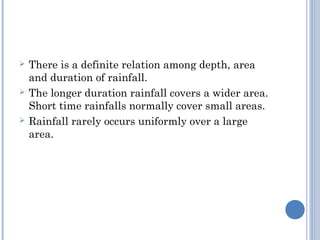
![STEP #4: CALCULATE THE AVERAGE
RAINFALL
Pavg = [Σ Wi x Pi ] / Σ Wi
Pavg = [(65x1.81)+(150x2.15)+(269x2.26)+
(216x2.18)+(56x1.62)+(136x1.8)] / [65+150+269+
216+56+136]
Pavg = 2.08 in.](https://image.slidesharecdn.com/precipitationandraingauges-140223120958-phpapp02/85/Precipitation-and-rain-gauges-32-320.jpg)
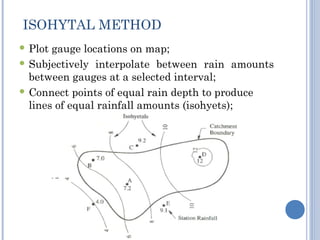

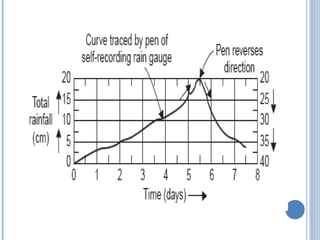
This document provides information on measuring precipitation. It discusses various types of rain gauges used to measure precipitation, including non-recording gauges, tipping bucket gauges, and weighing bucket gauges. It also discusses methods to estimate average rainfall over a watershed area, including the arithmetic mean method, Thiessen polygon method, and isohyetal method. Additionally, it covers depth-area-duration curves and the frequency of rainfall events.