Download as PDF, PPTX
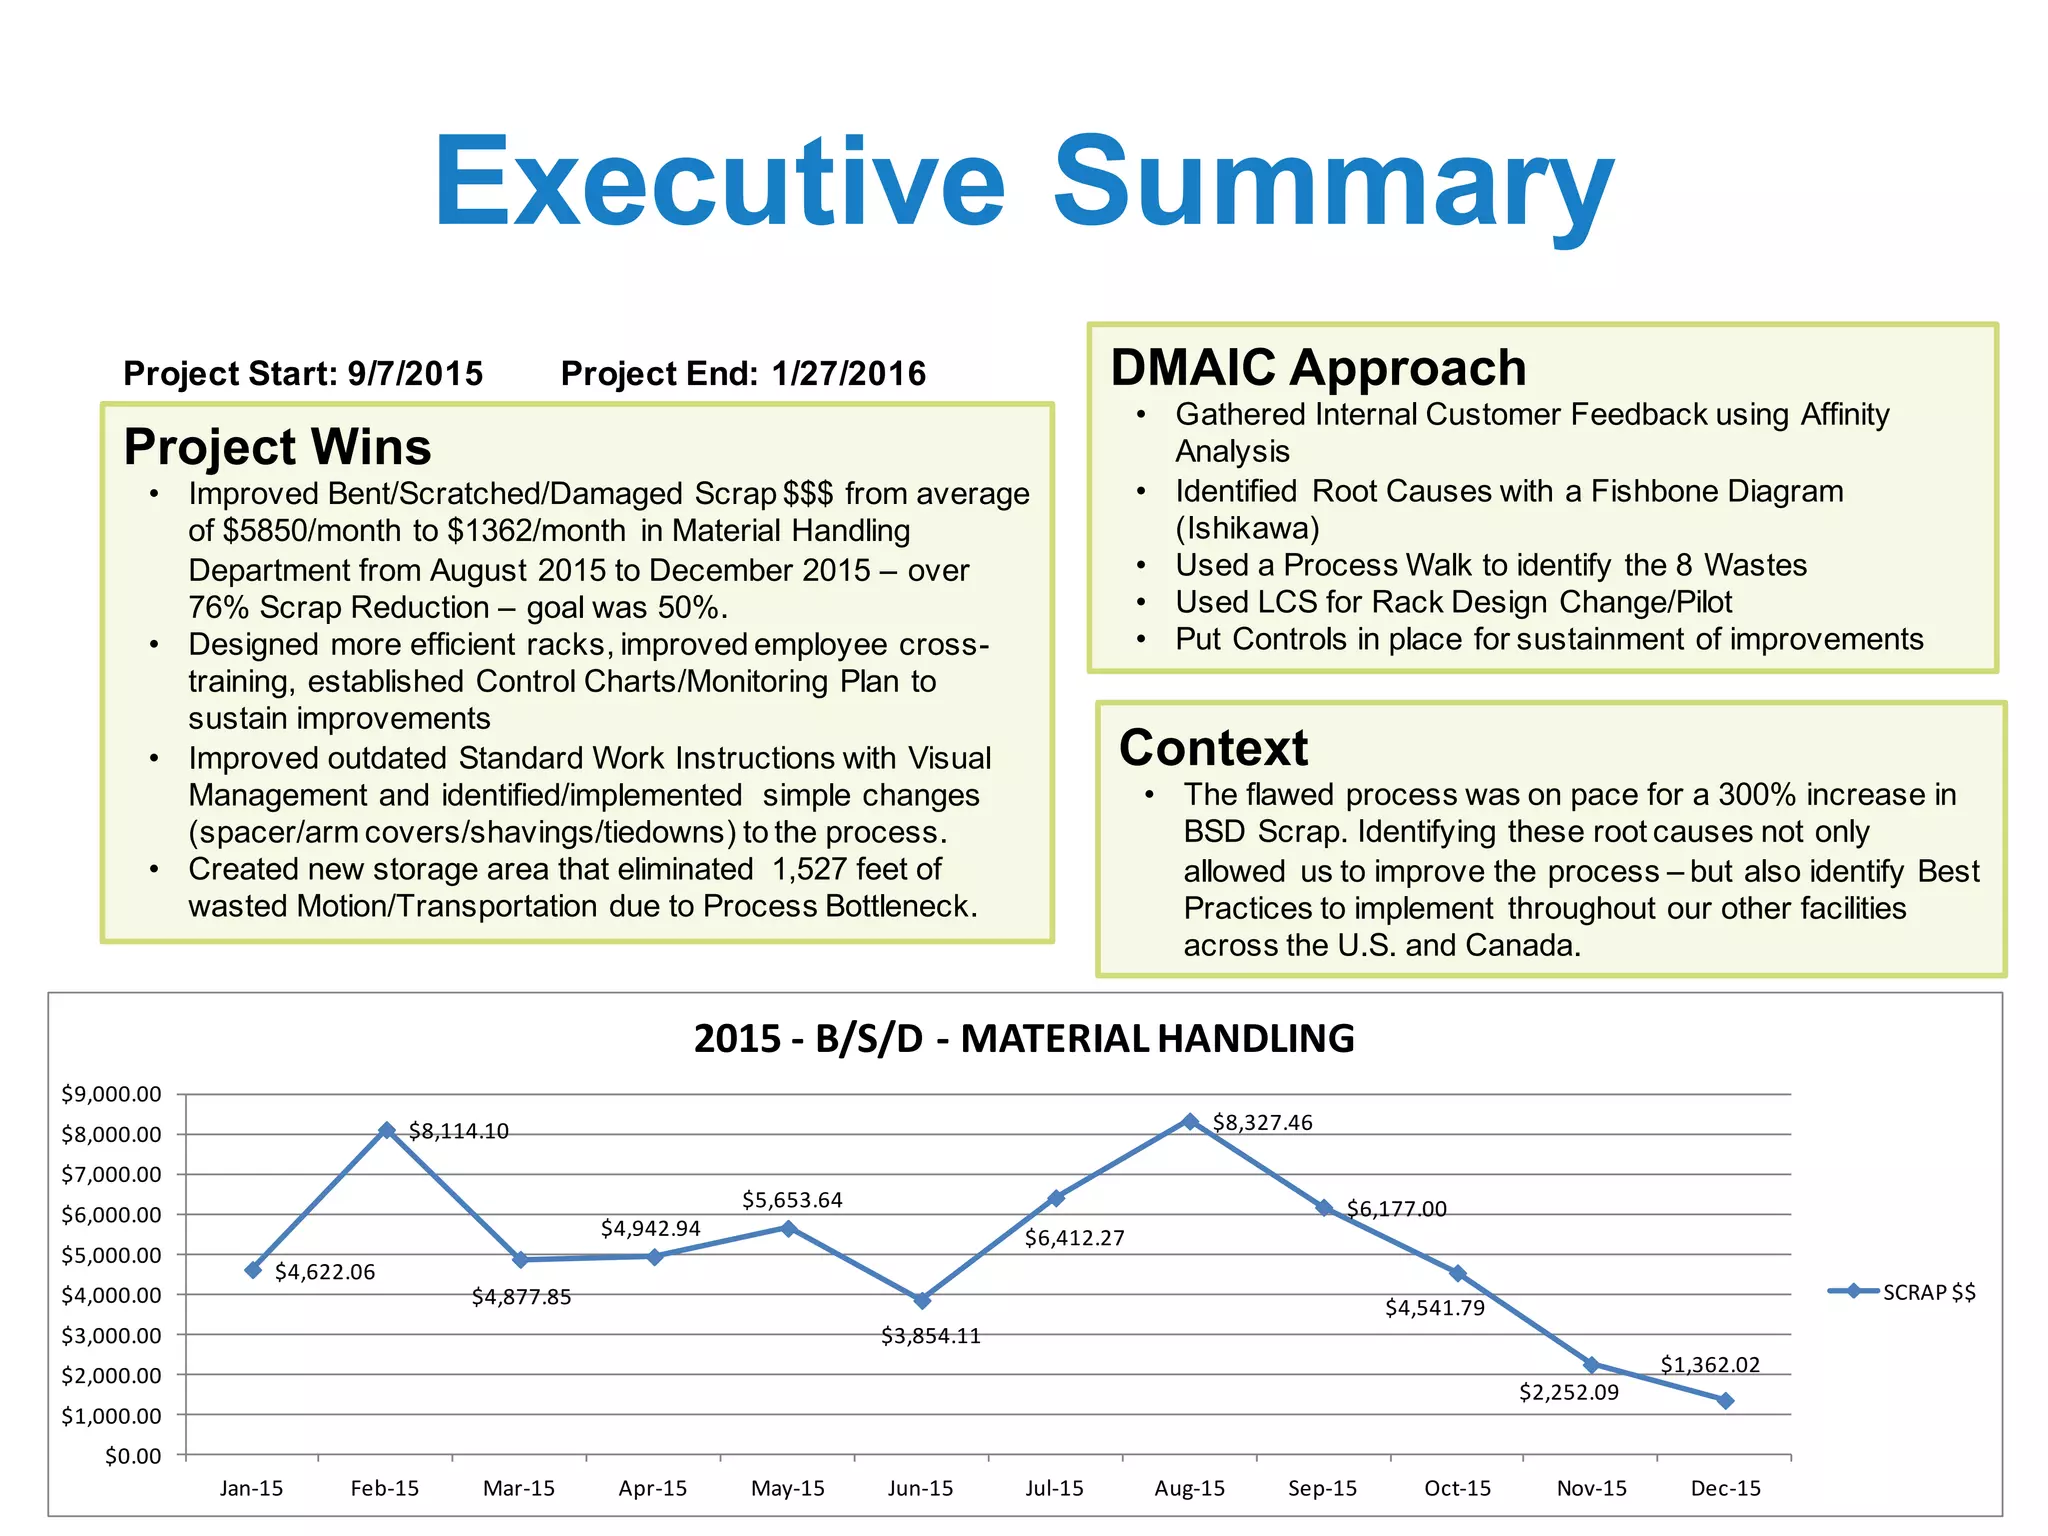
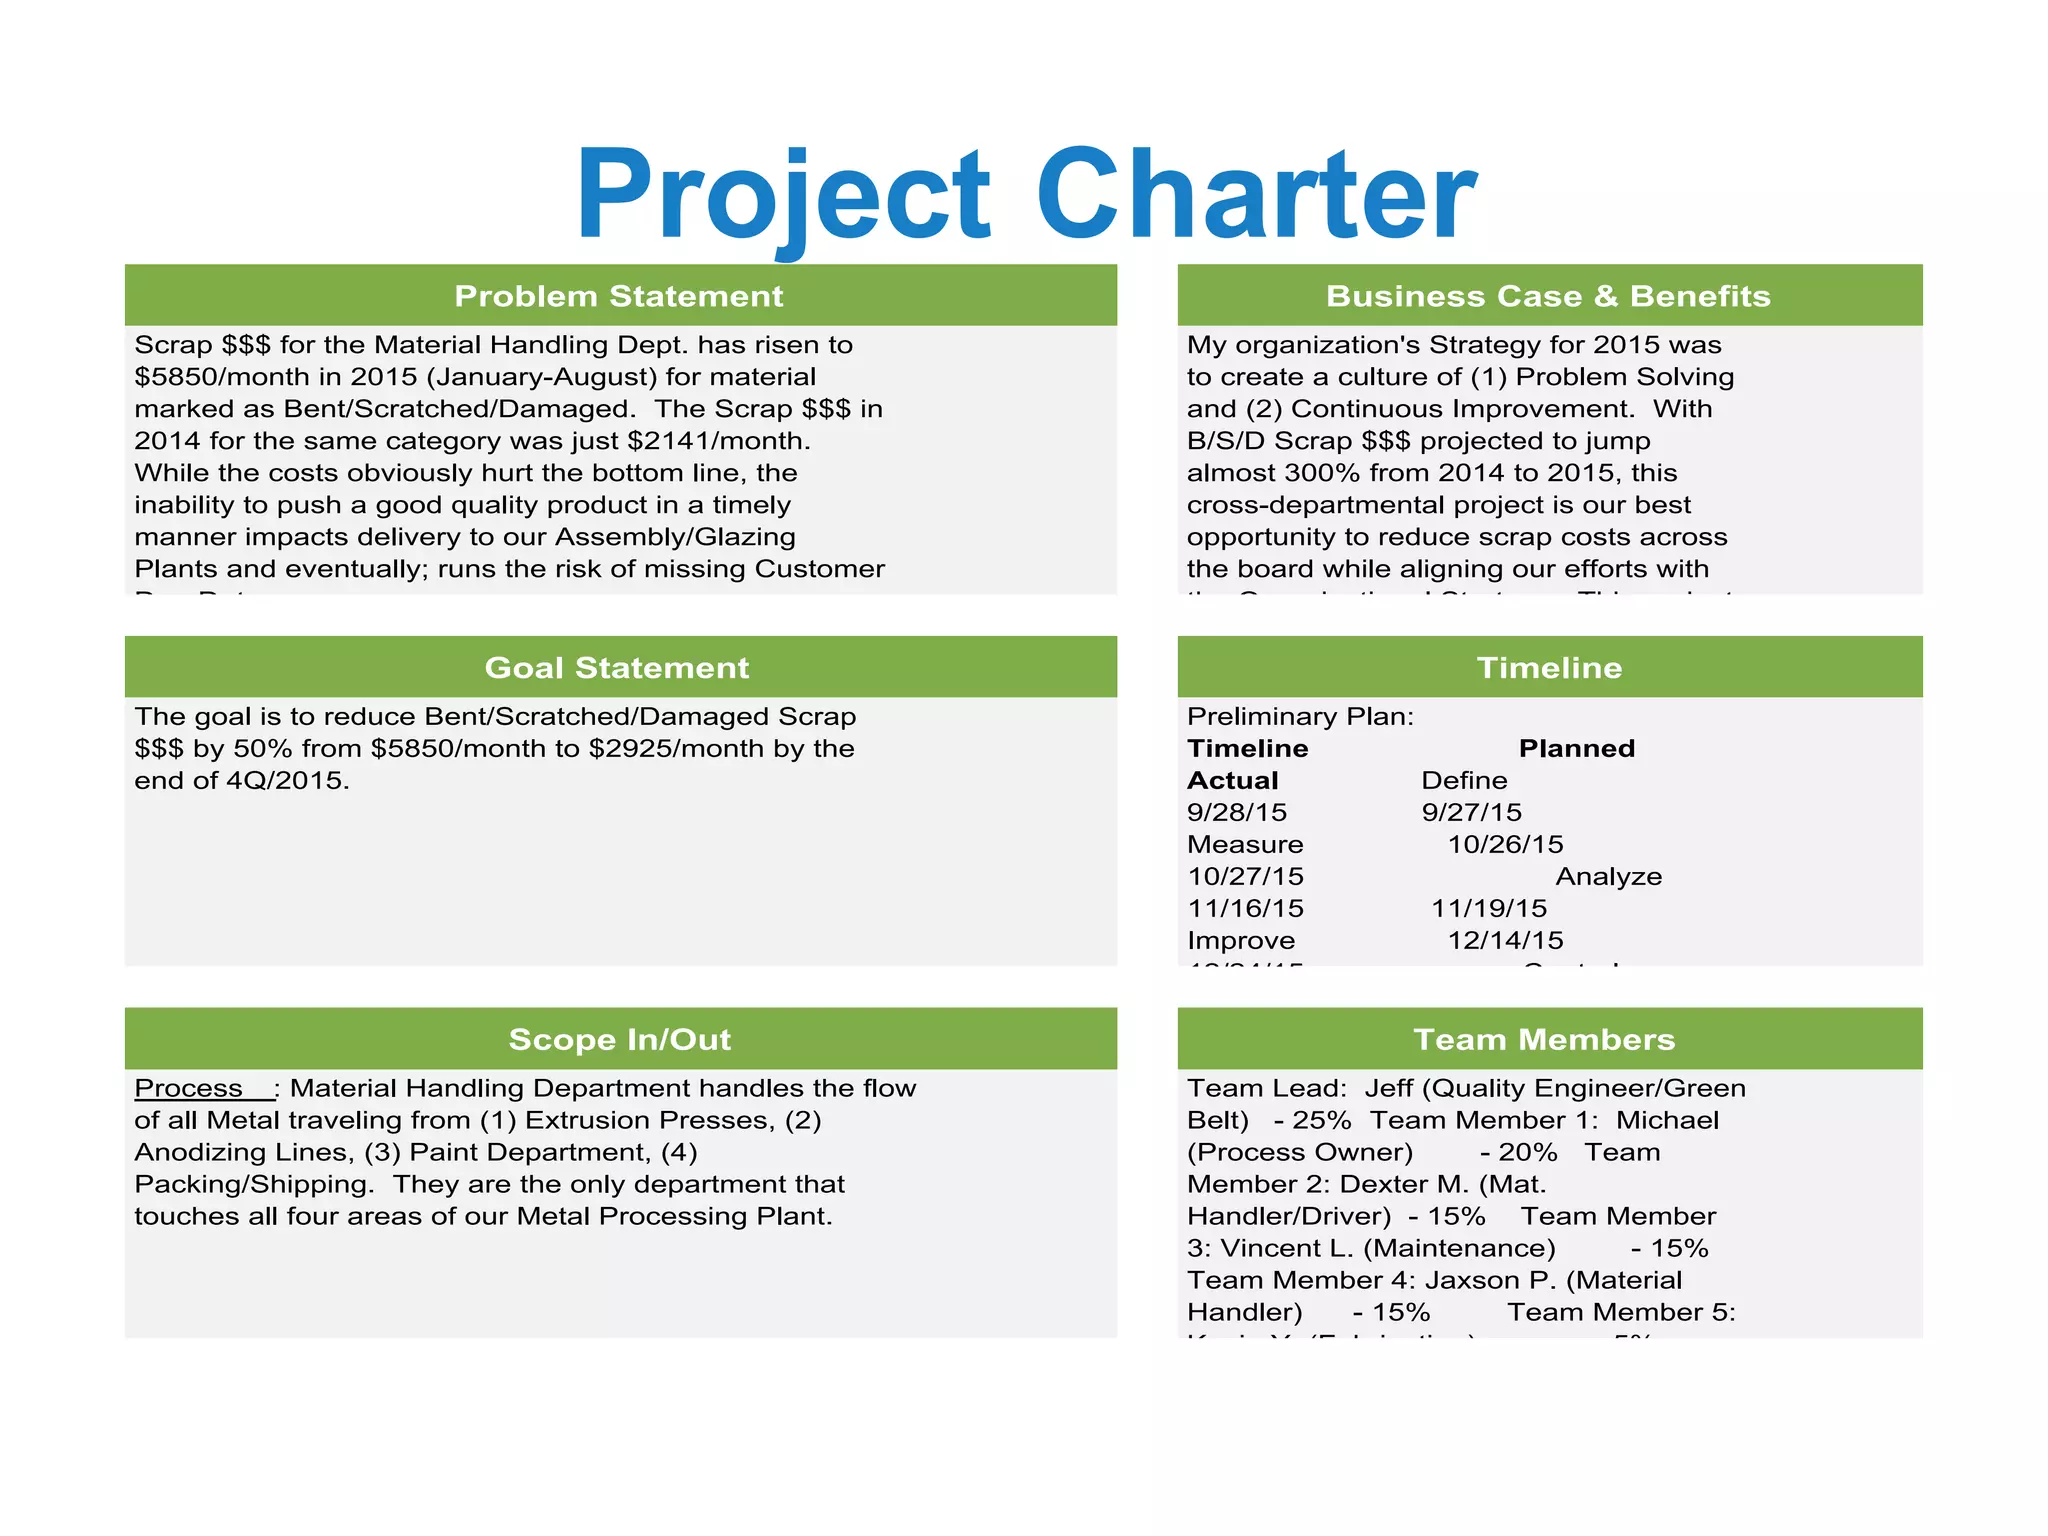
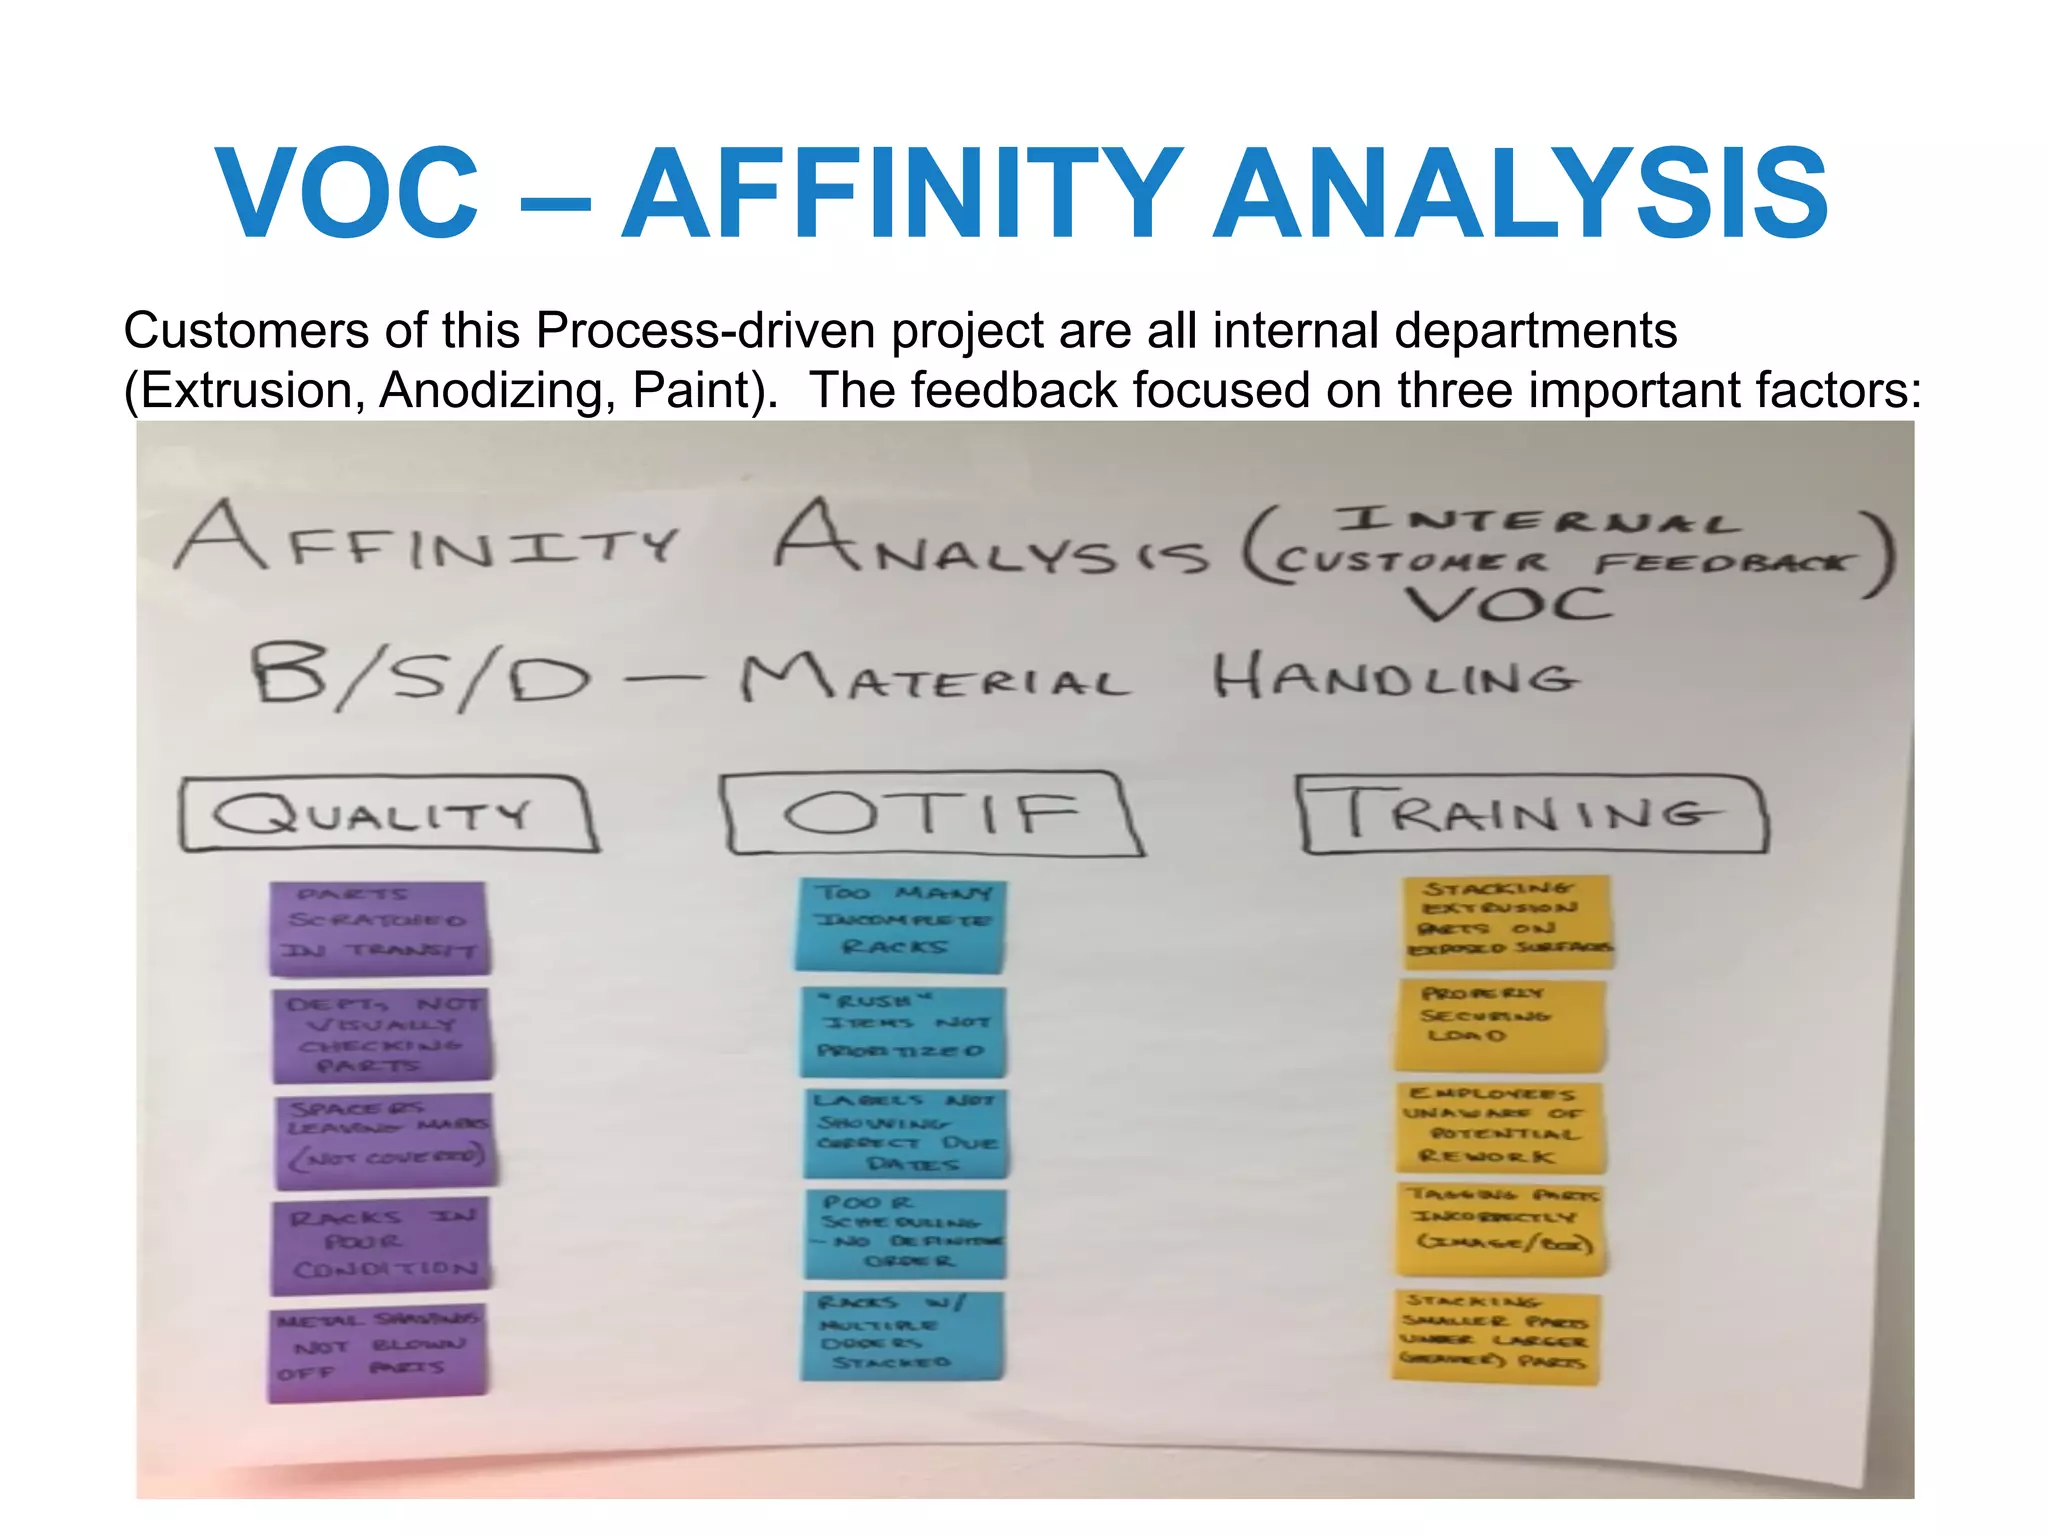
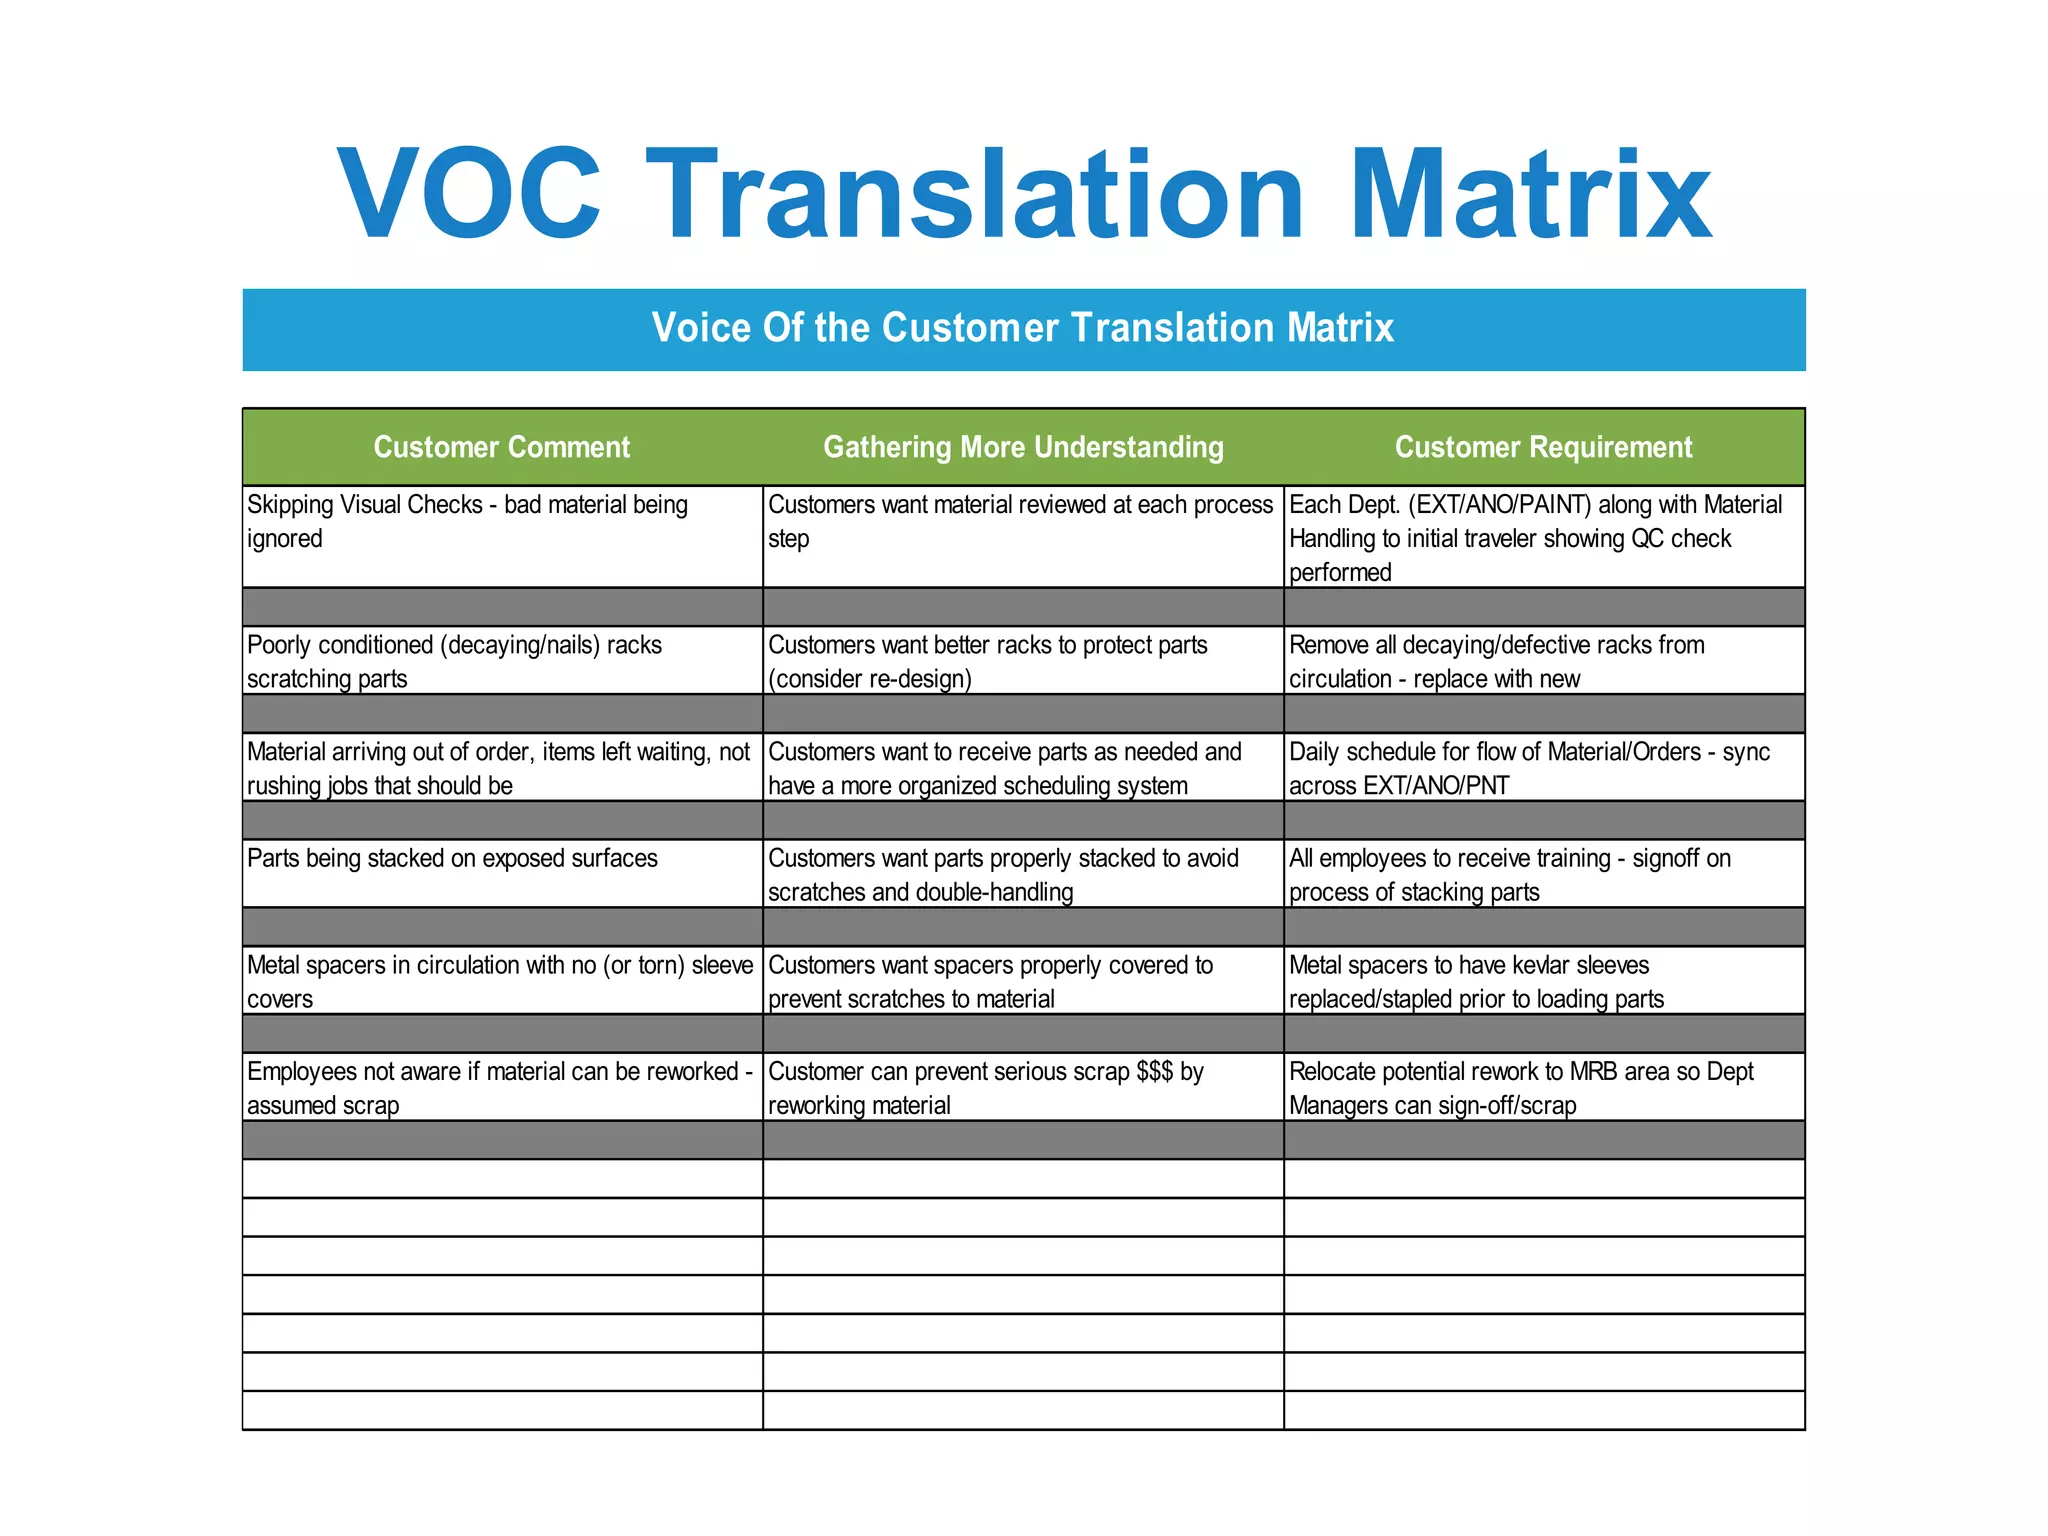
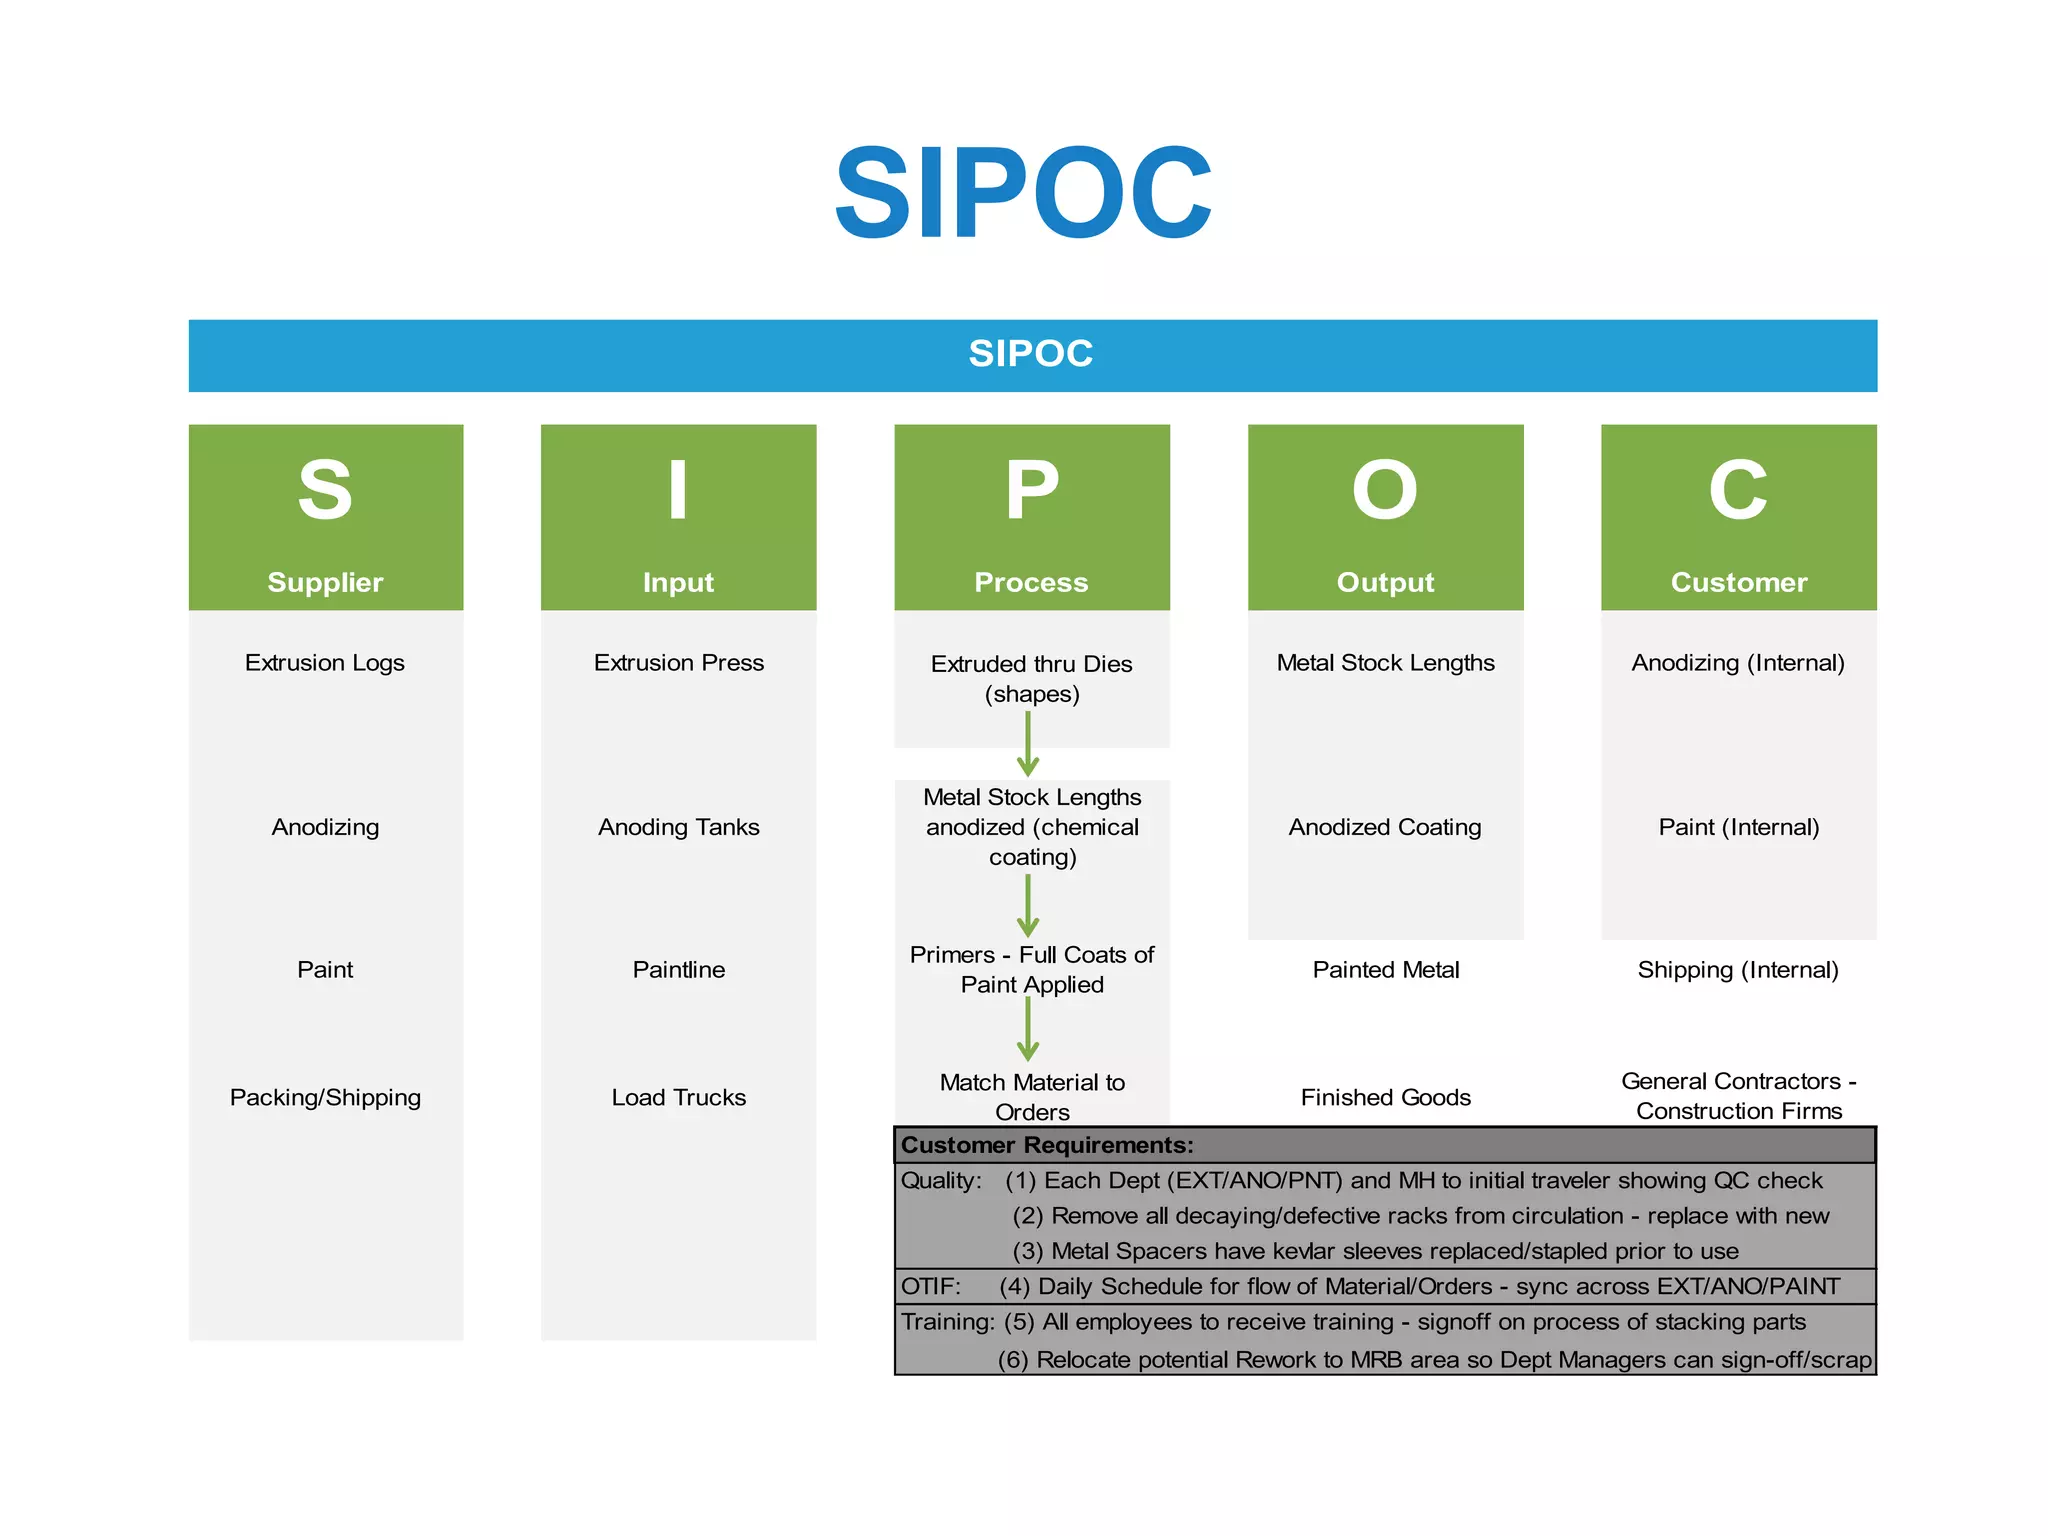
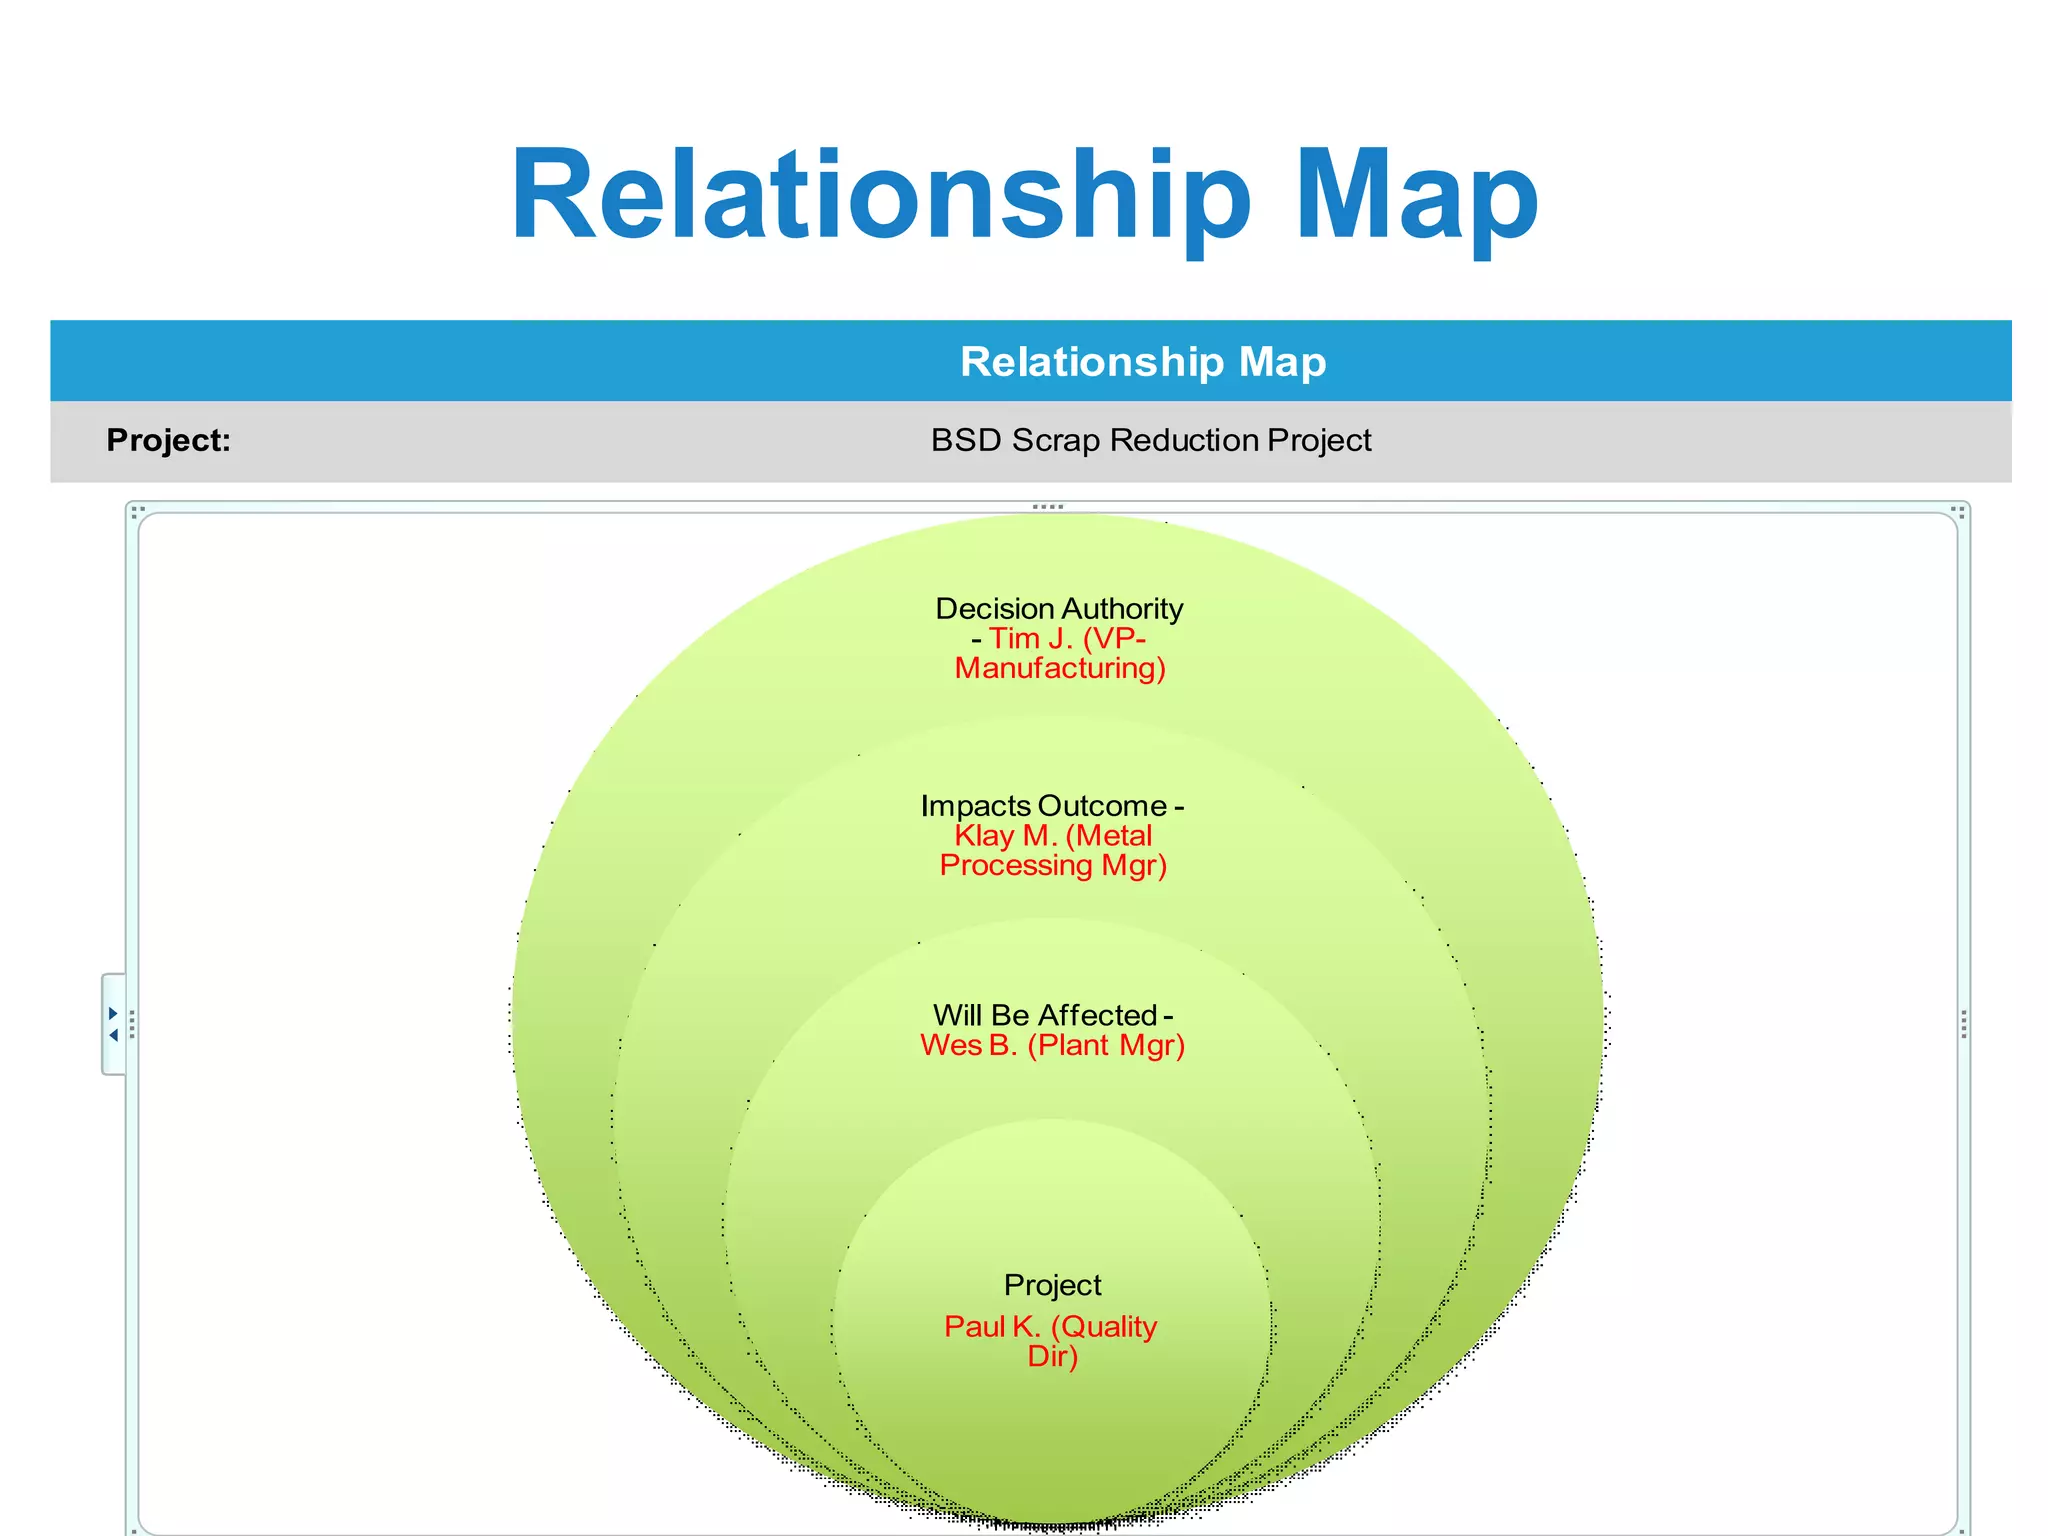
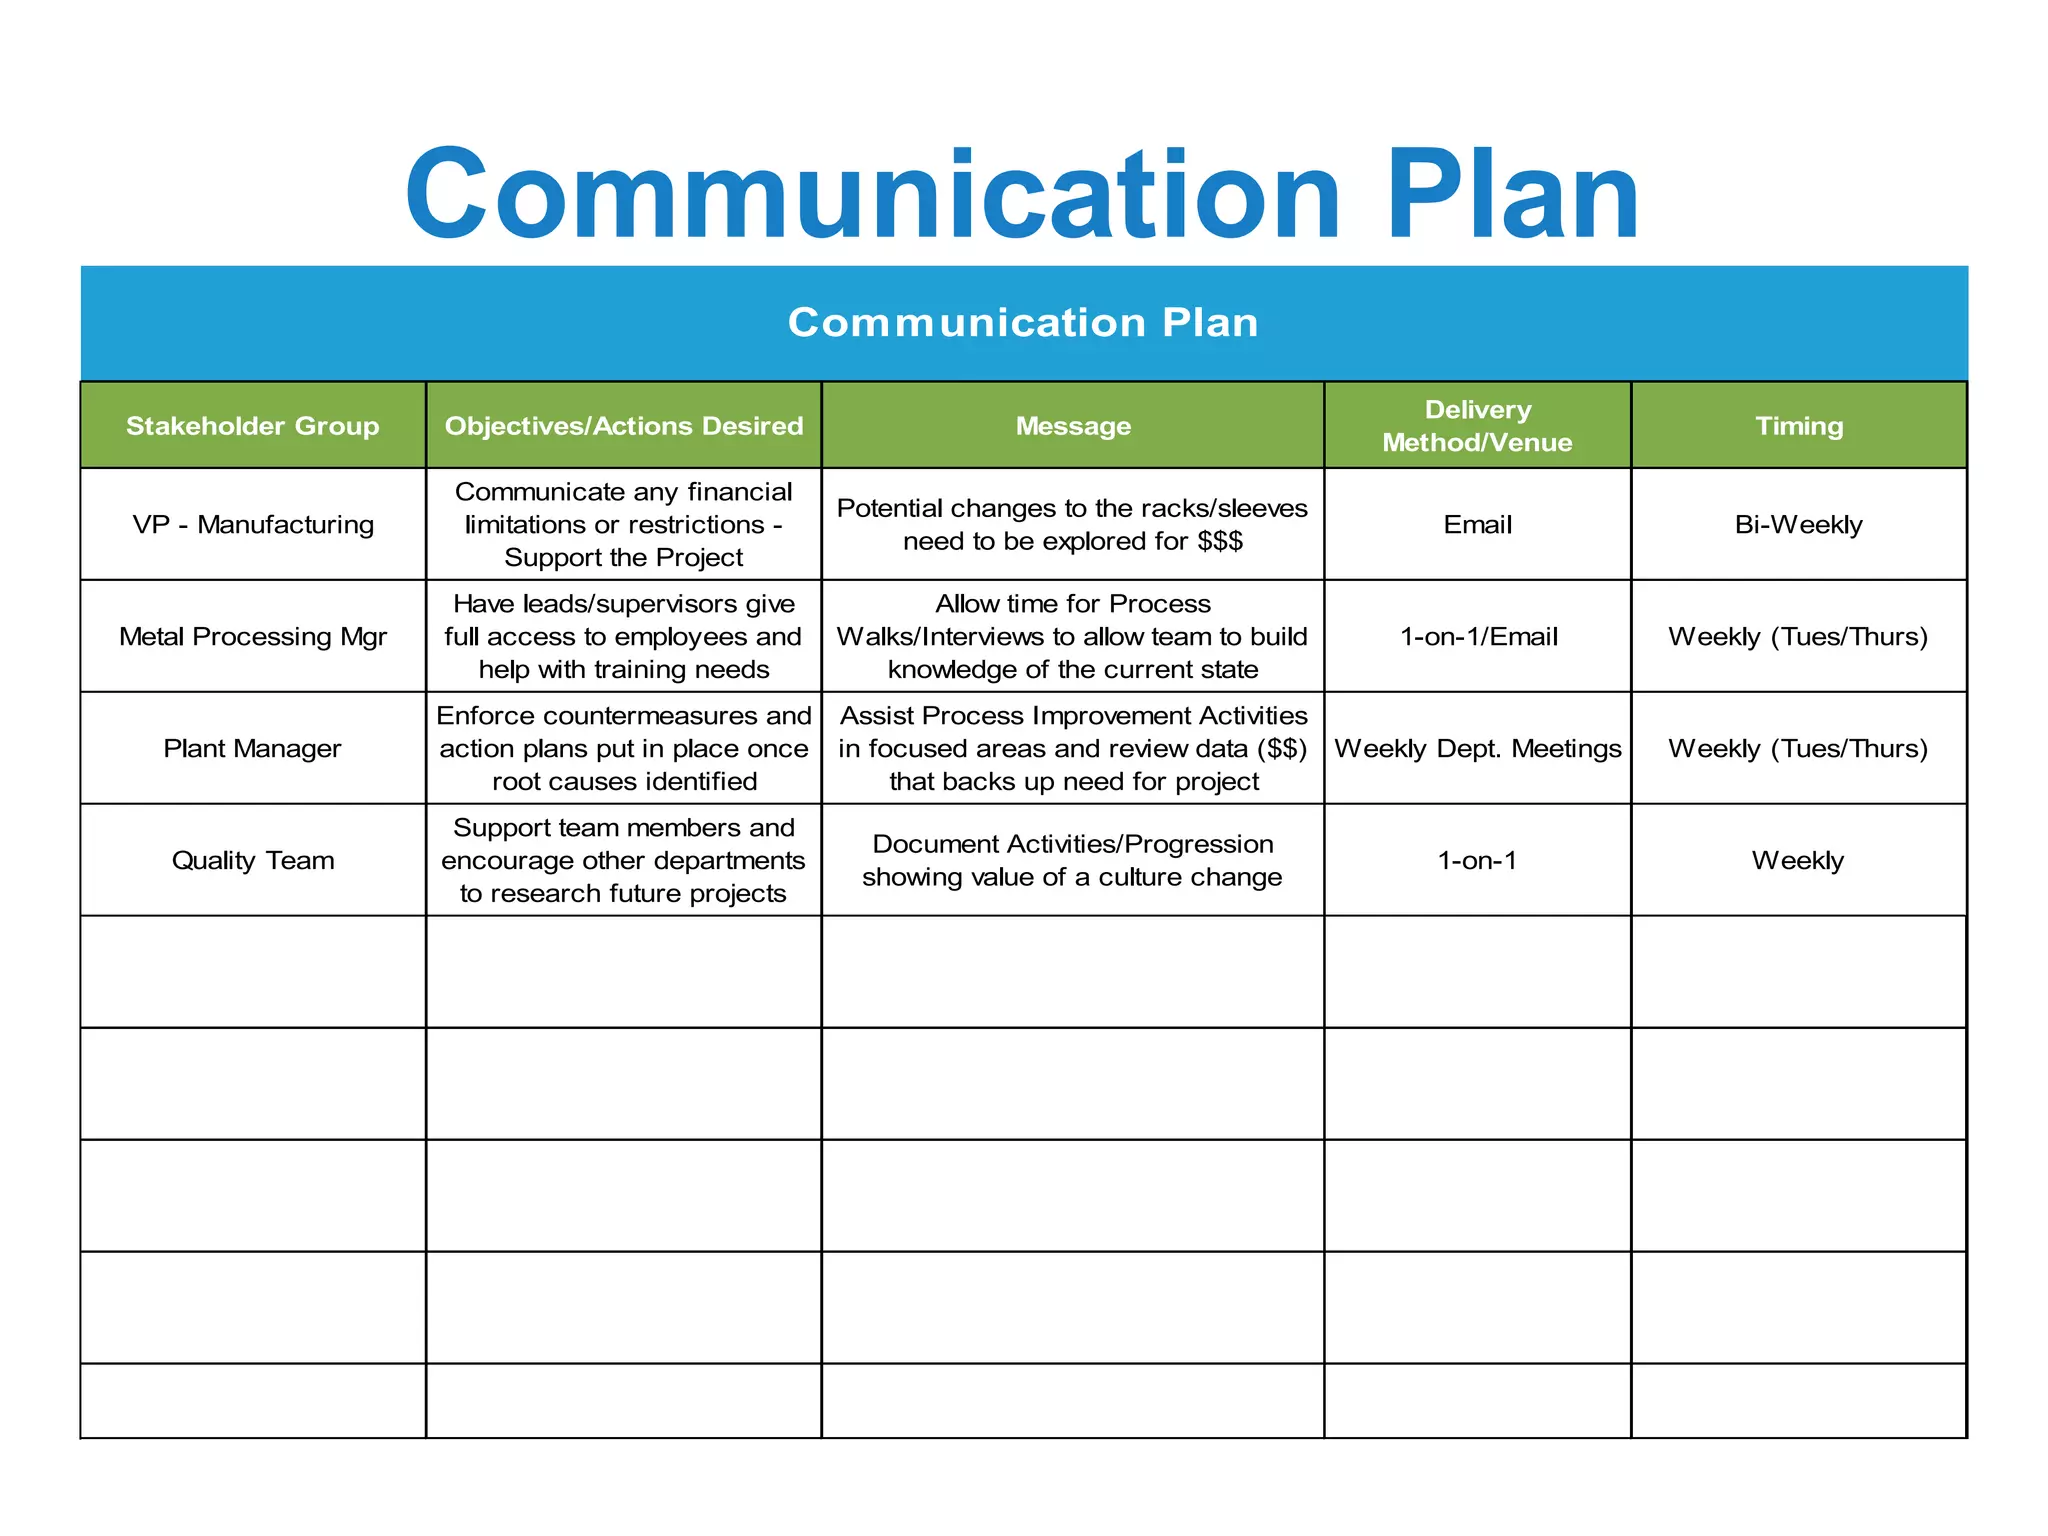
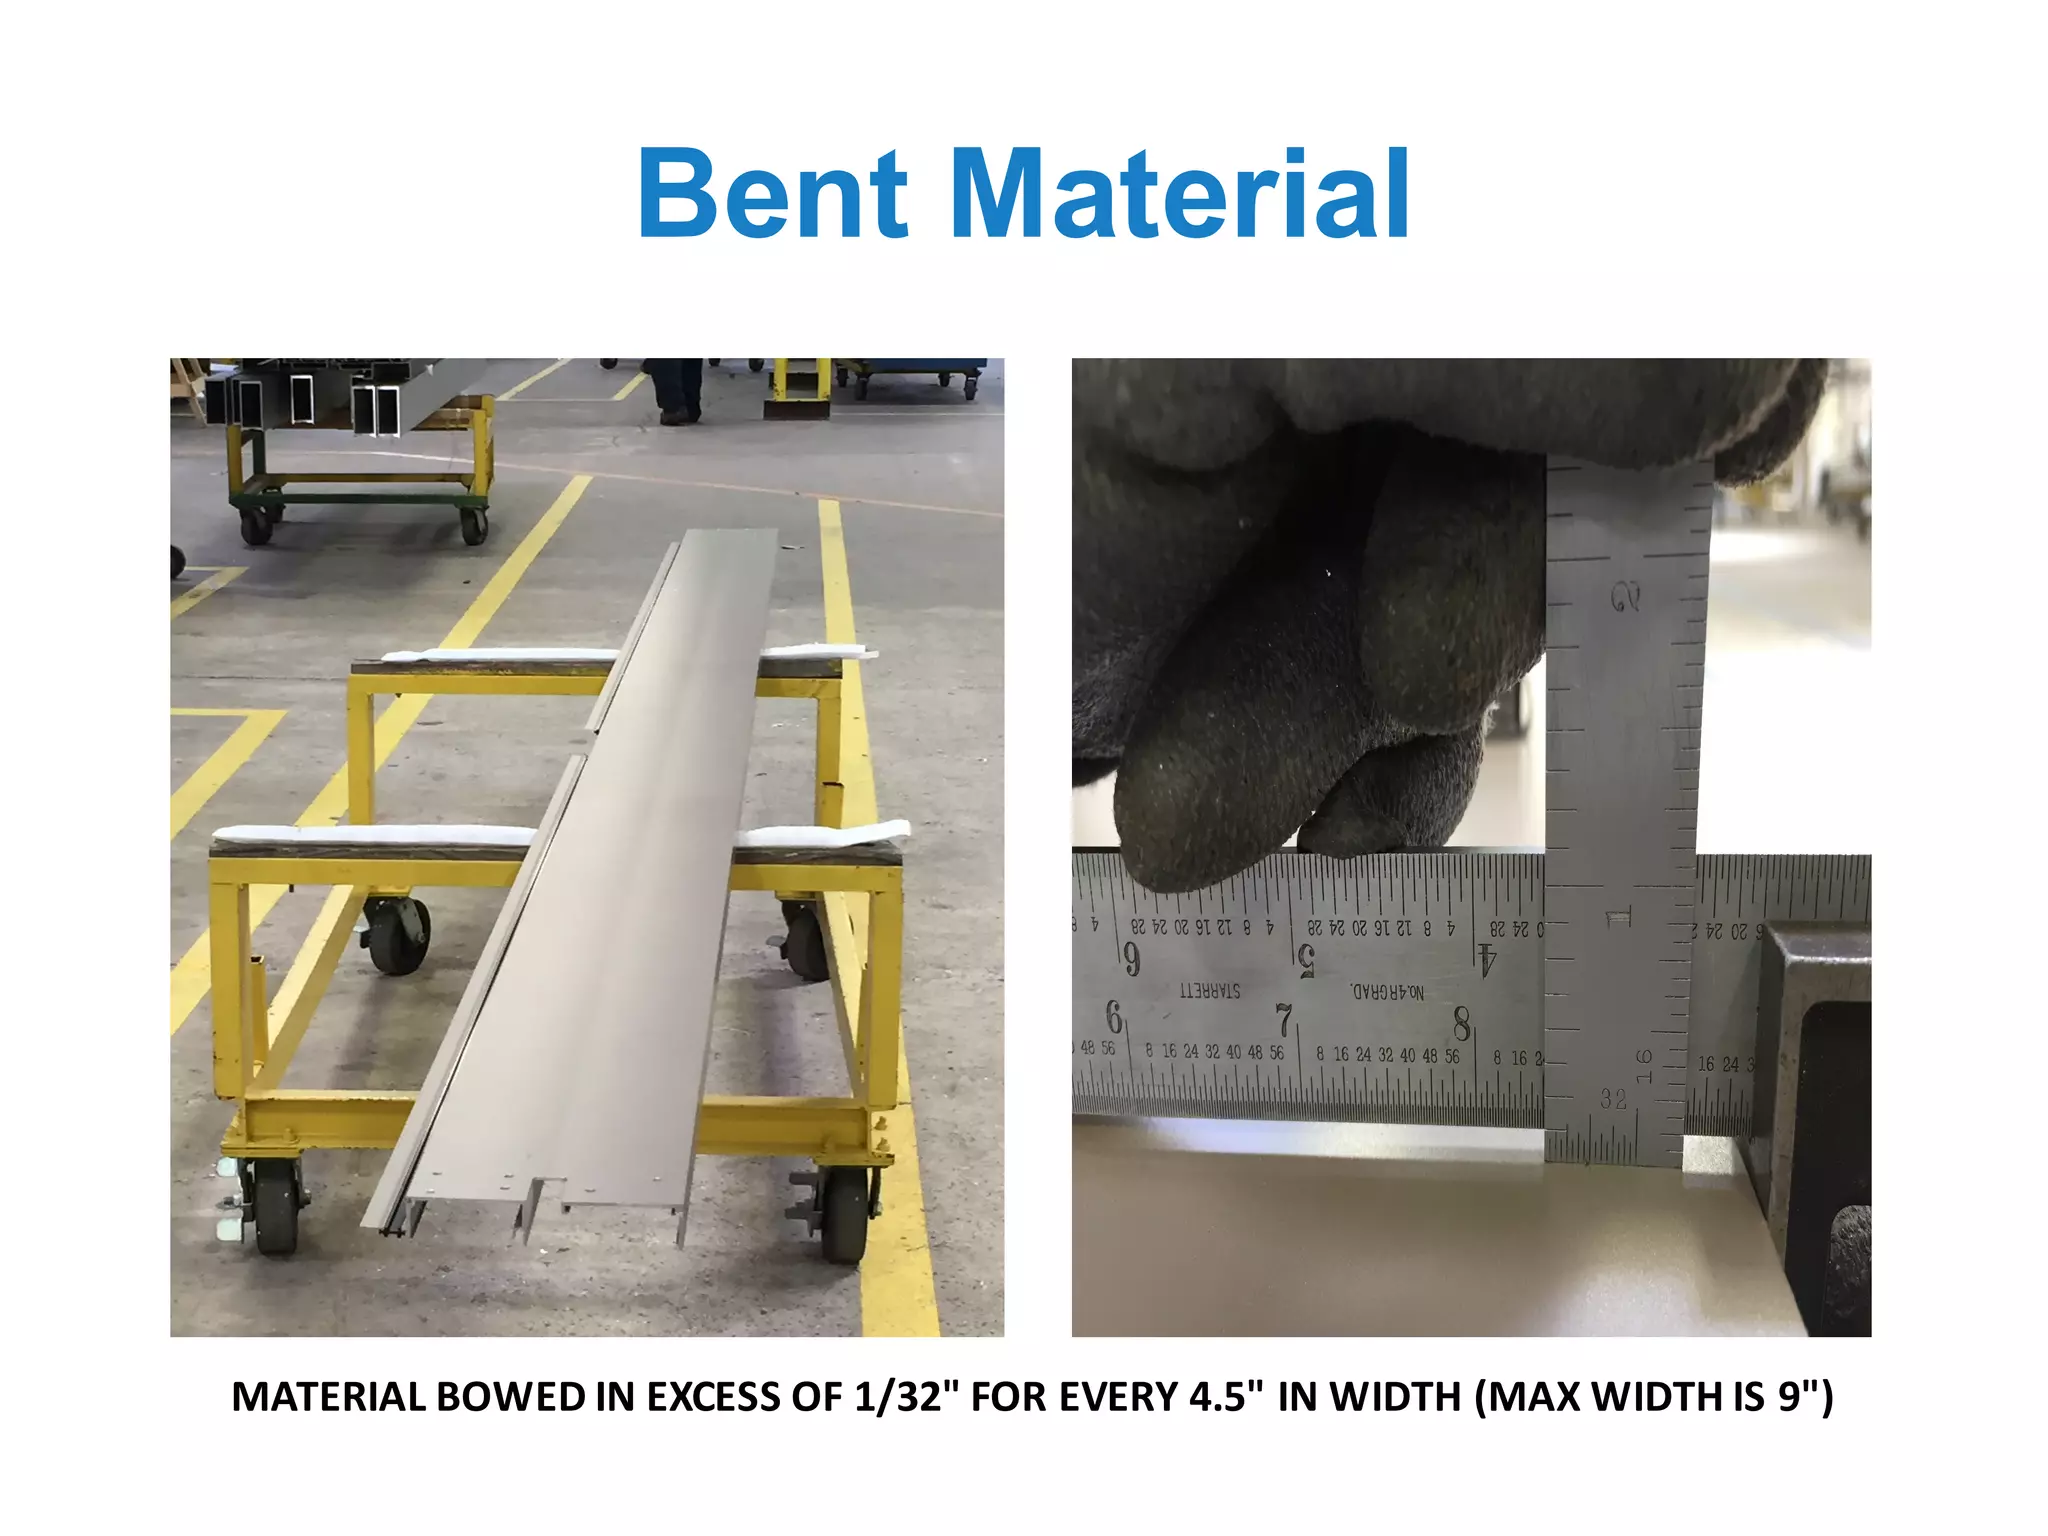
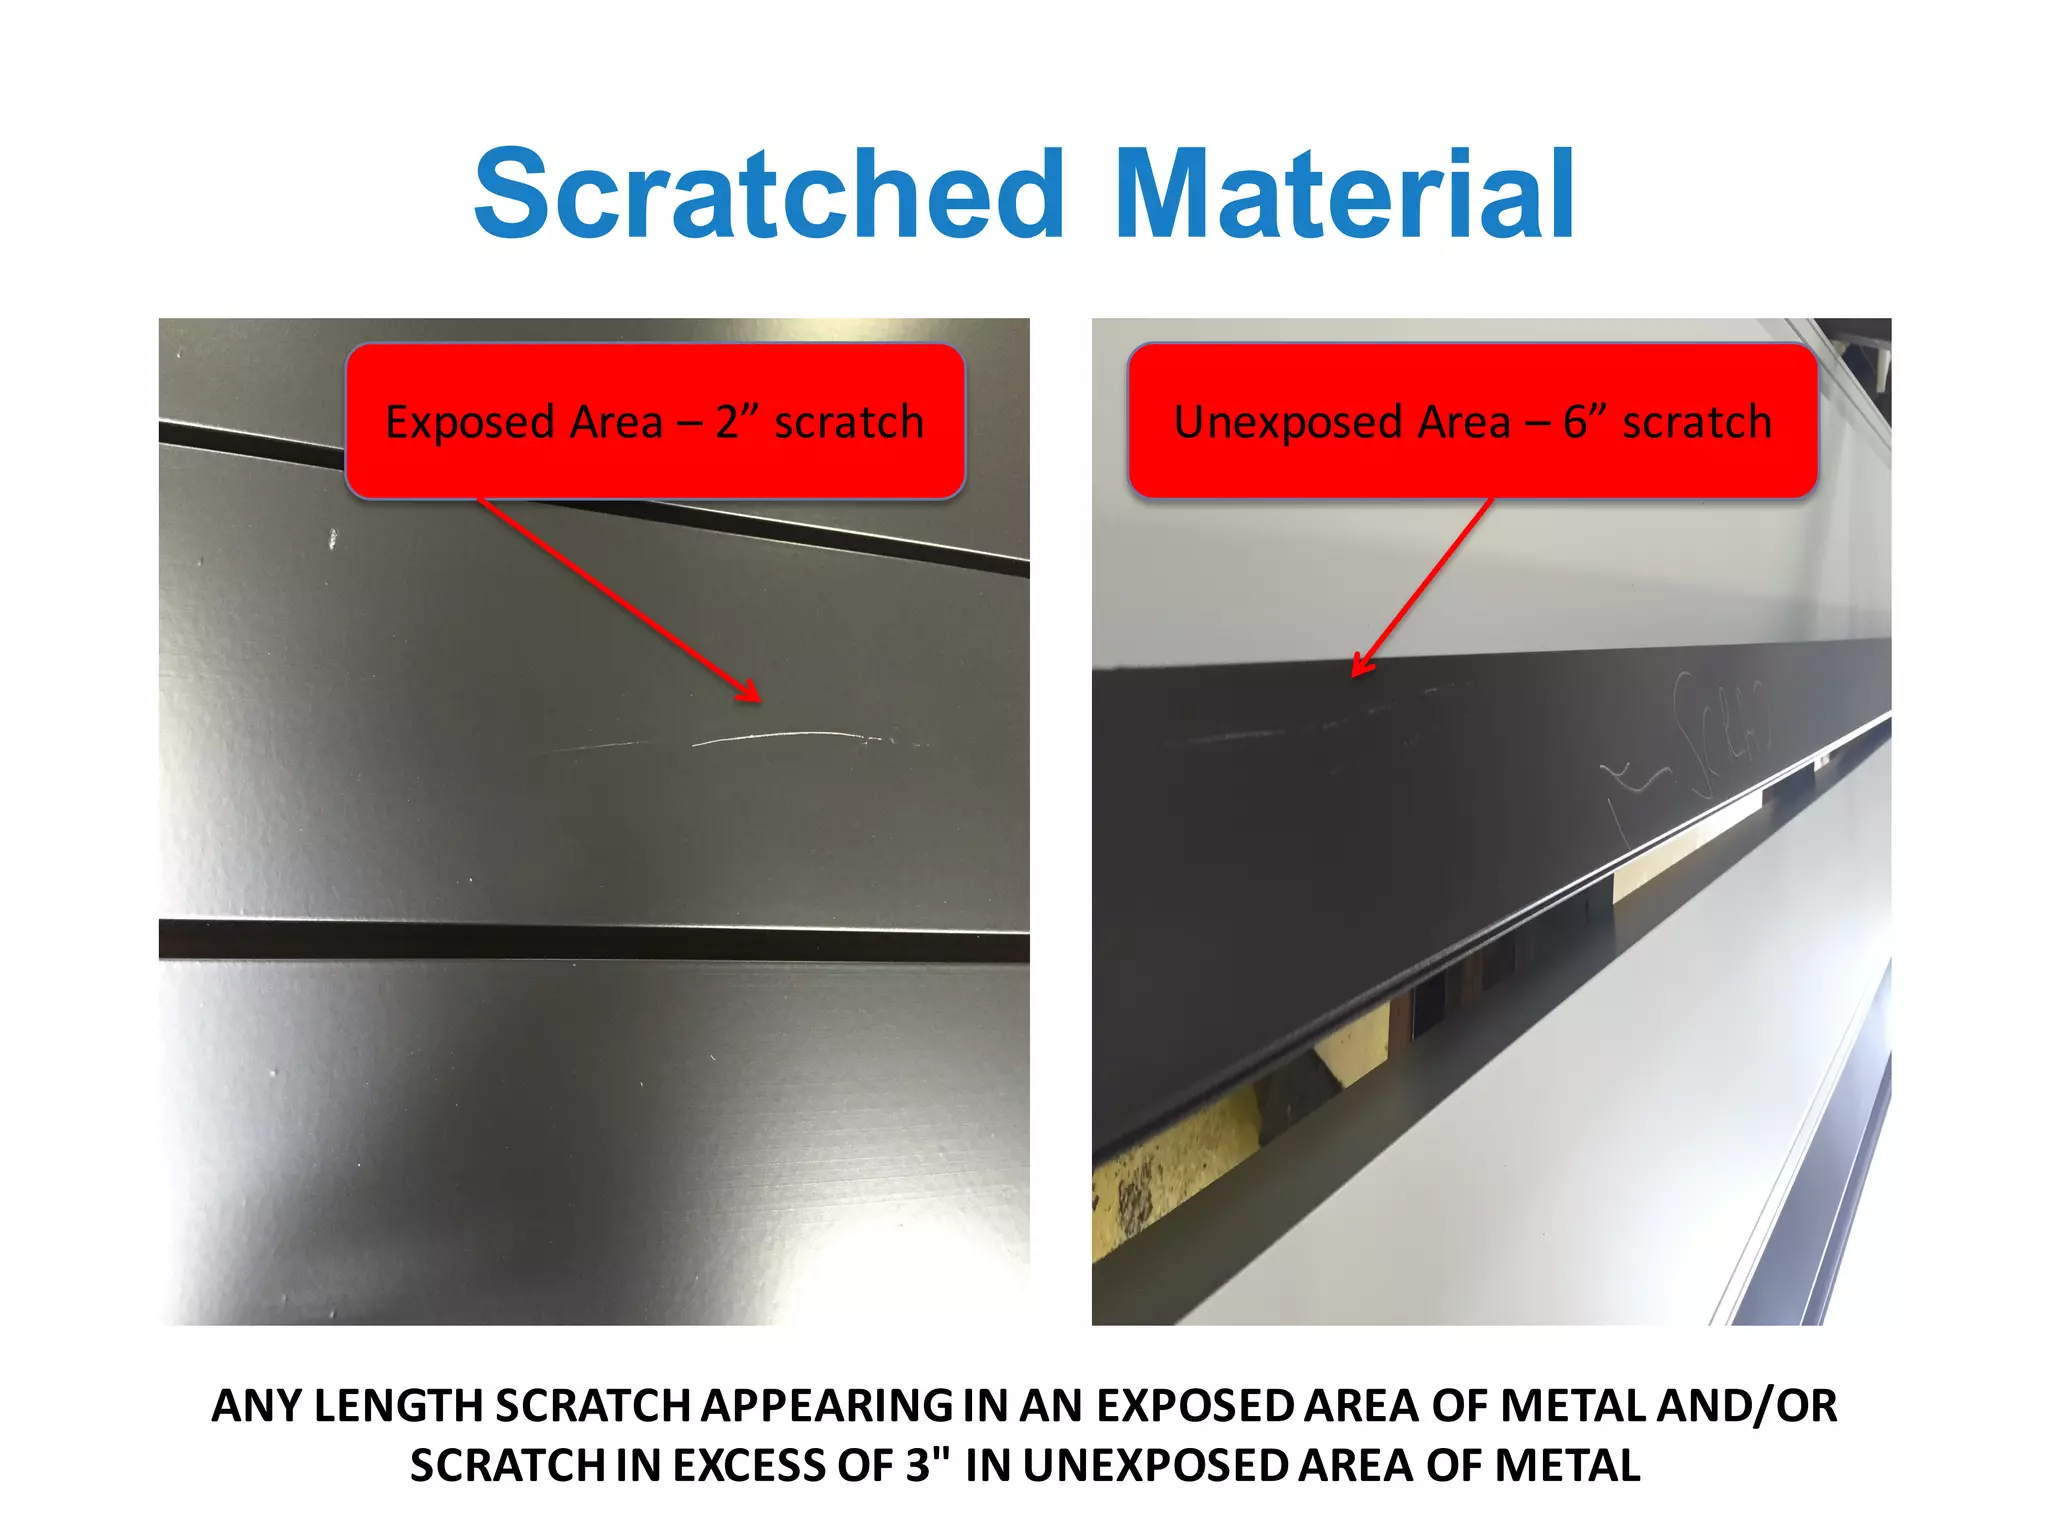
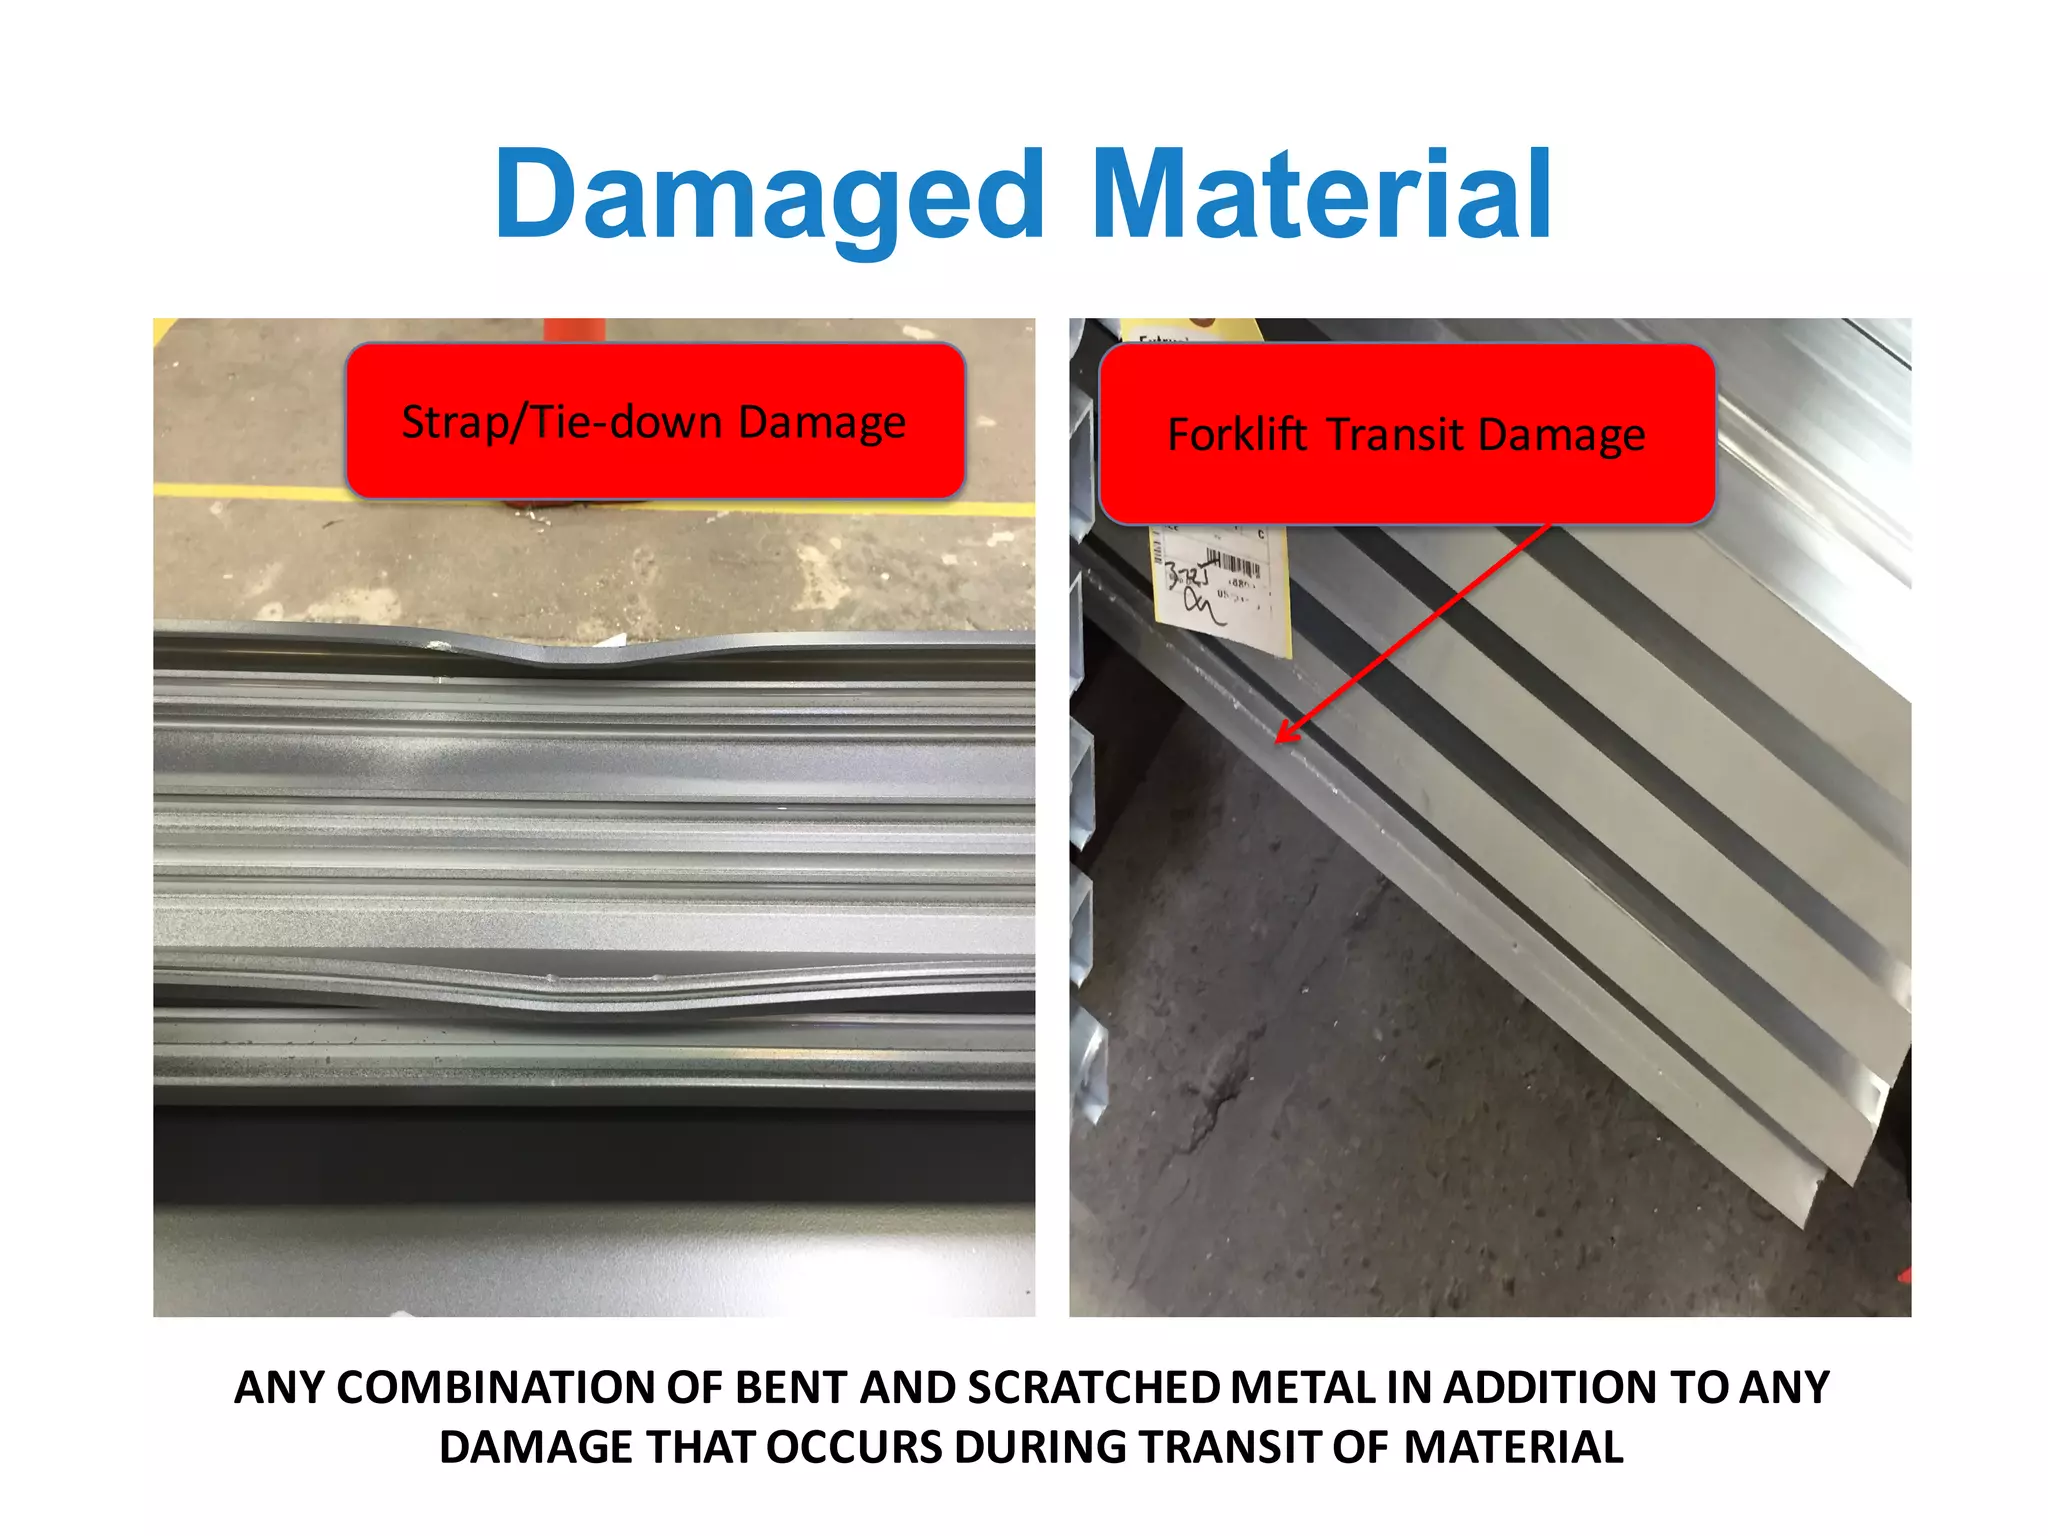
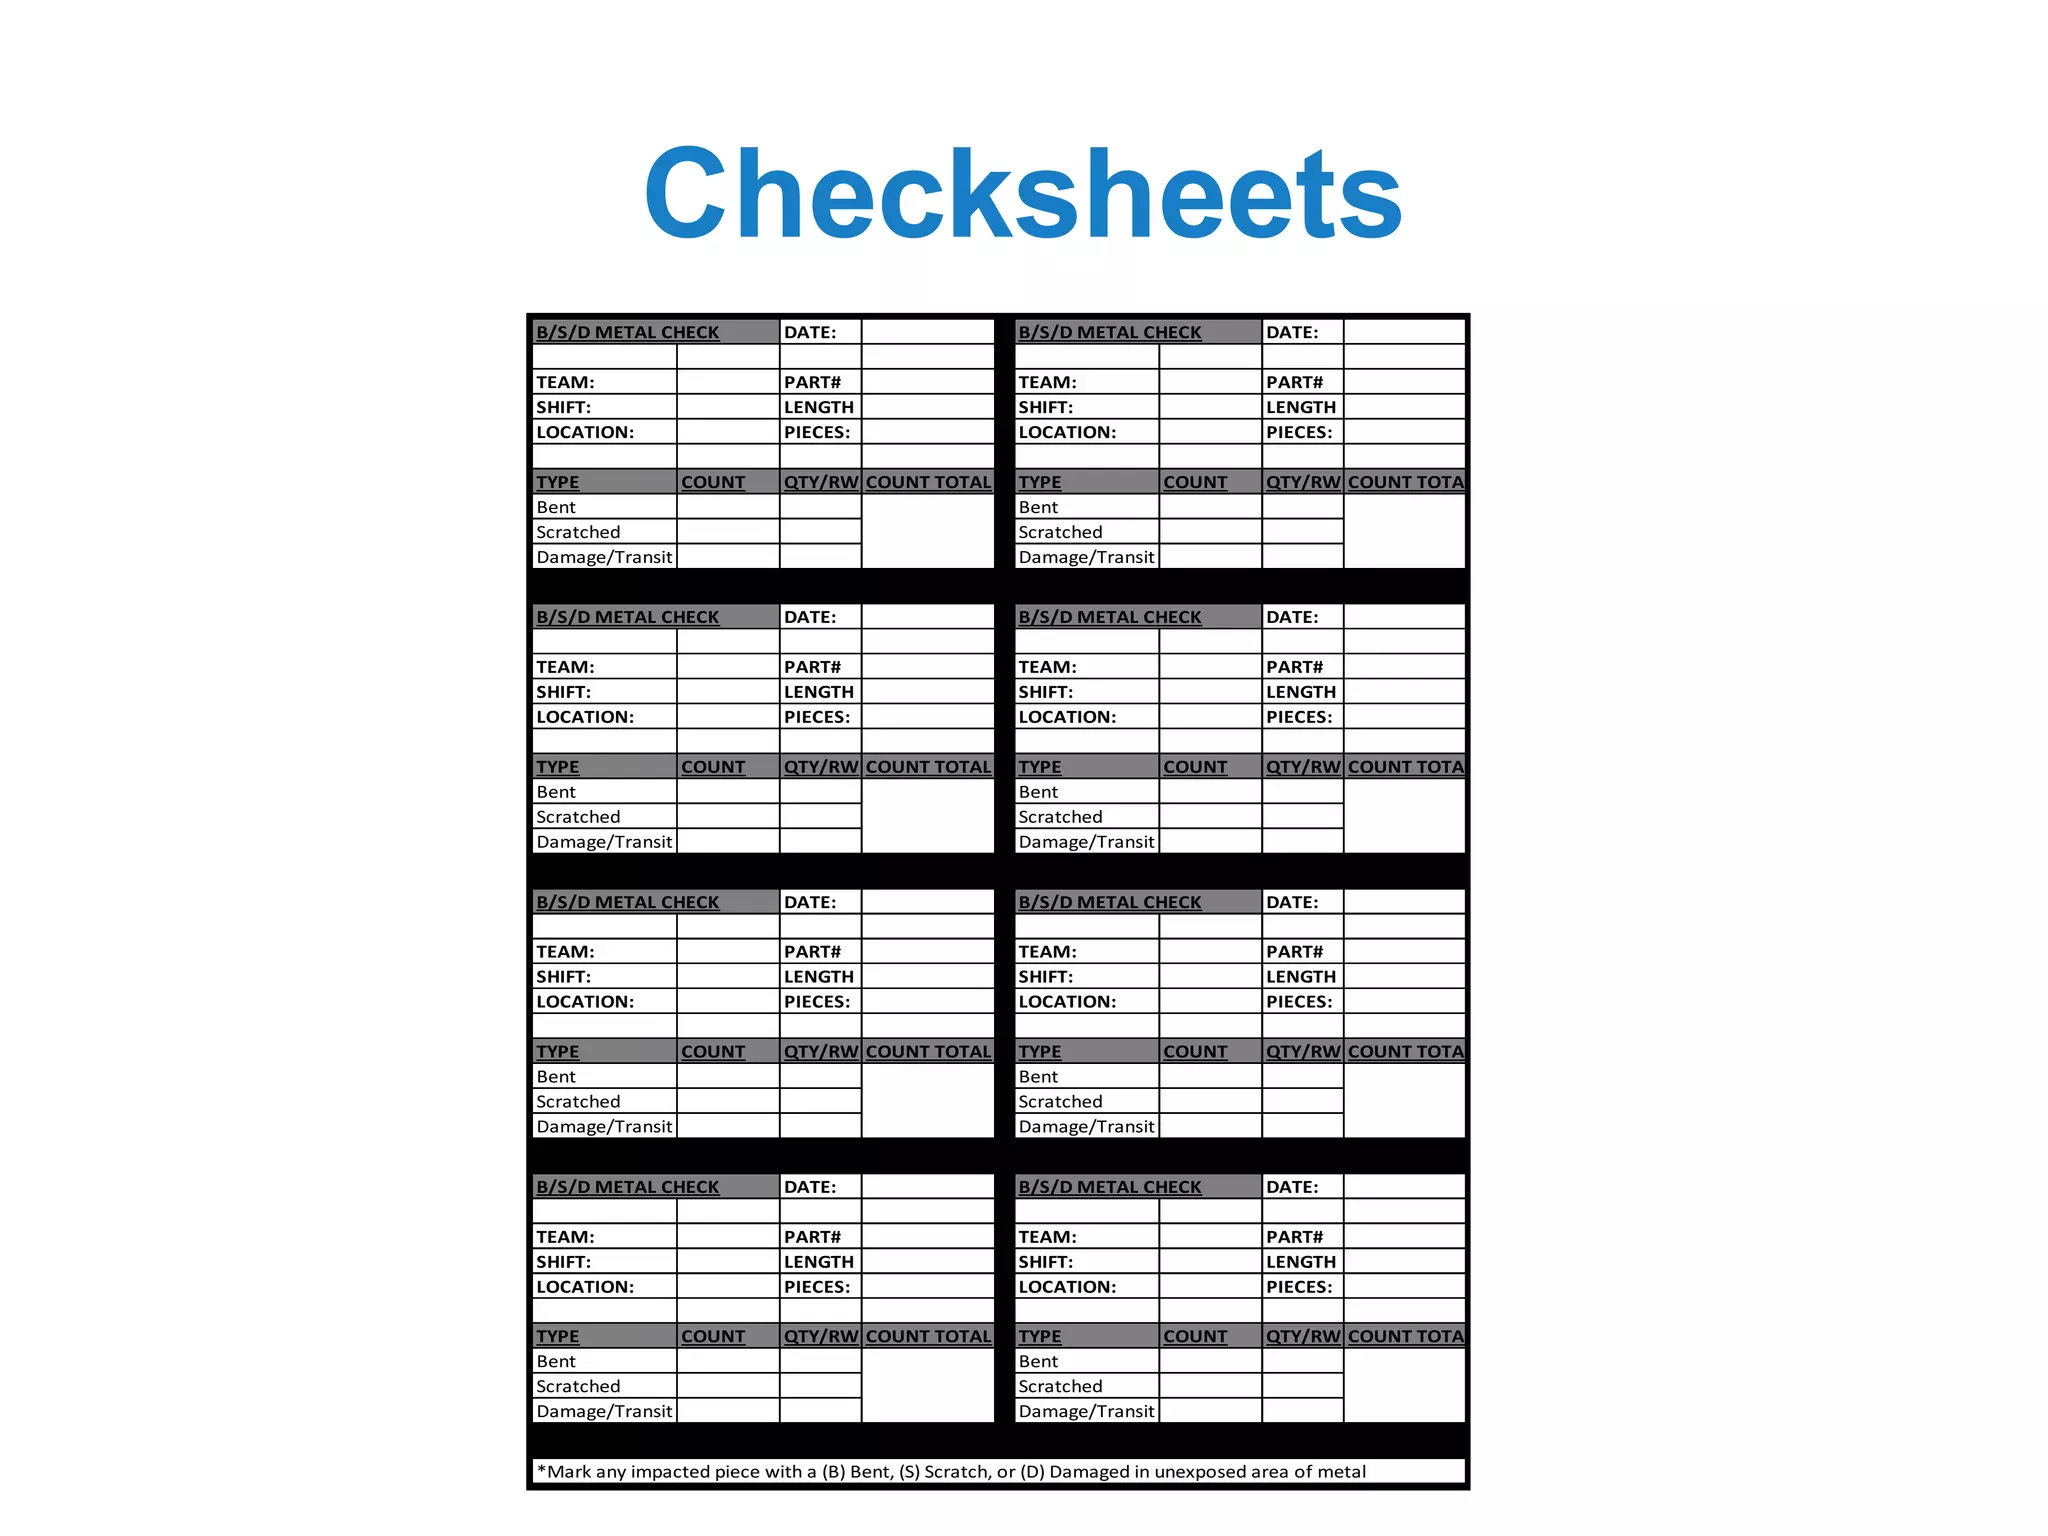
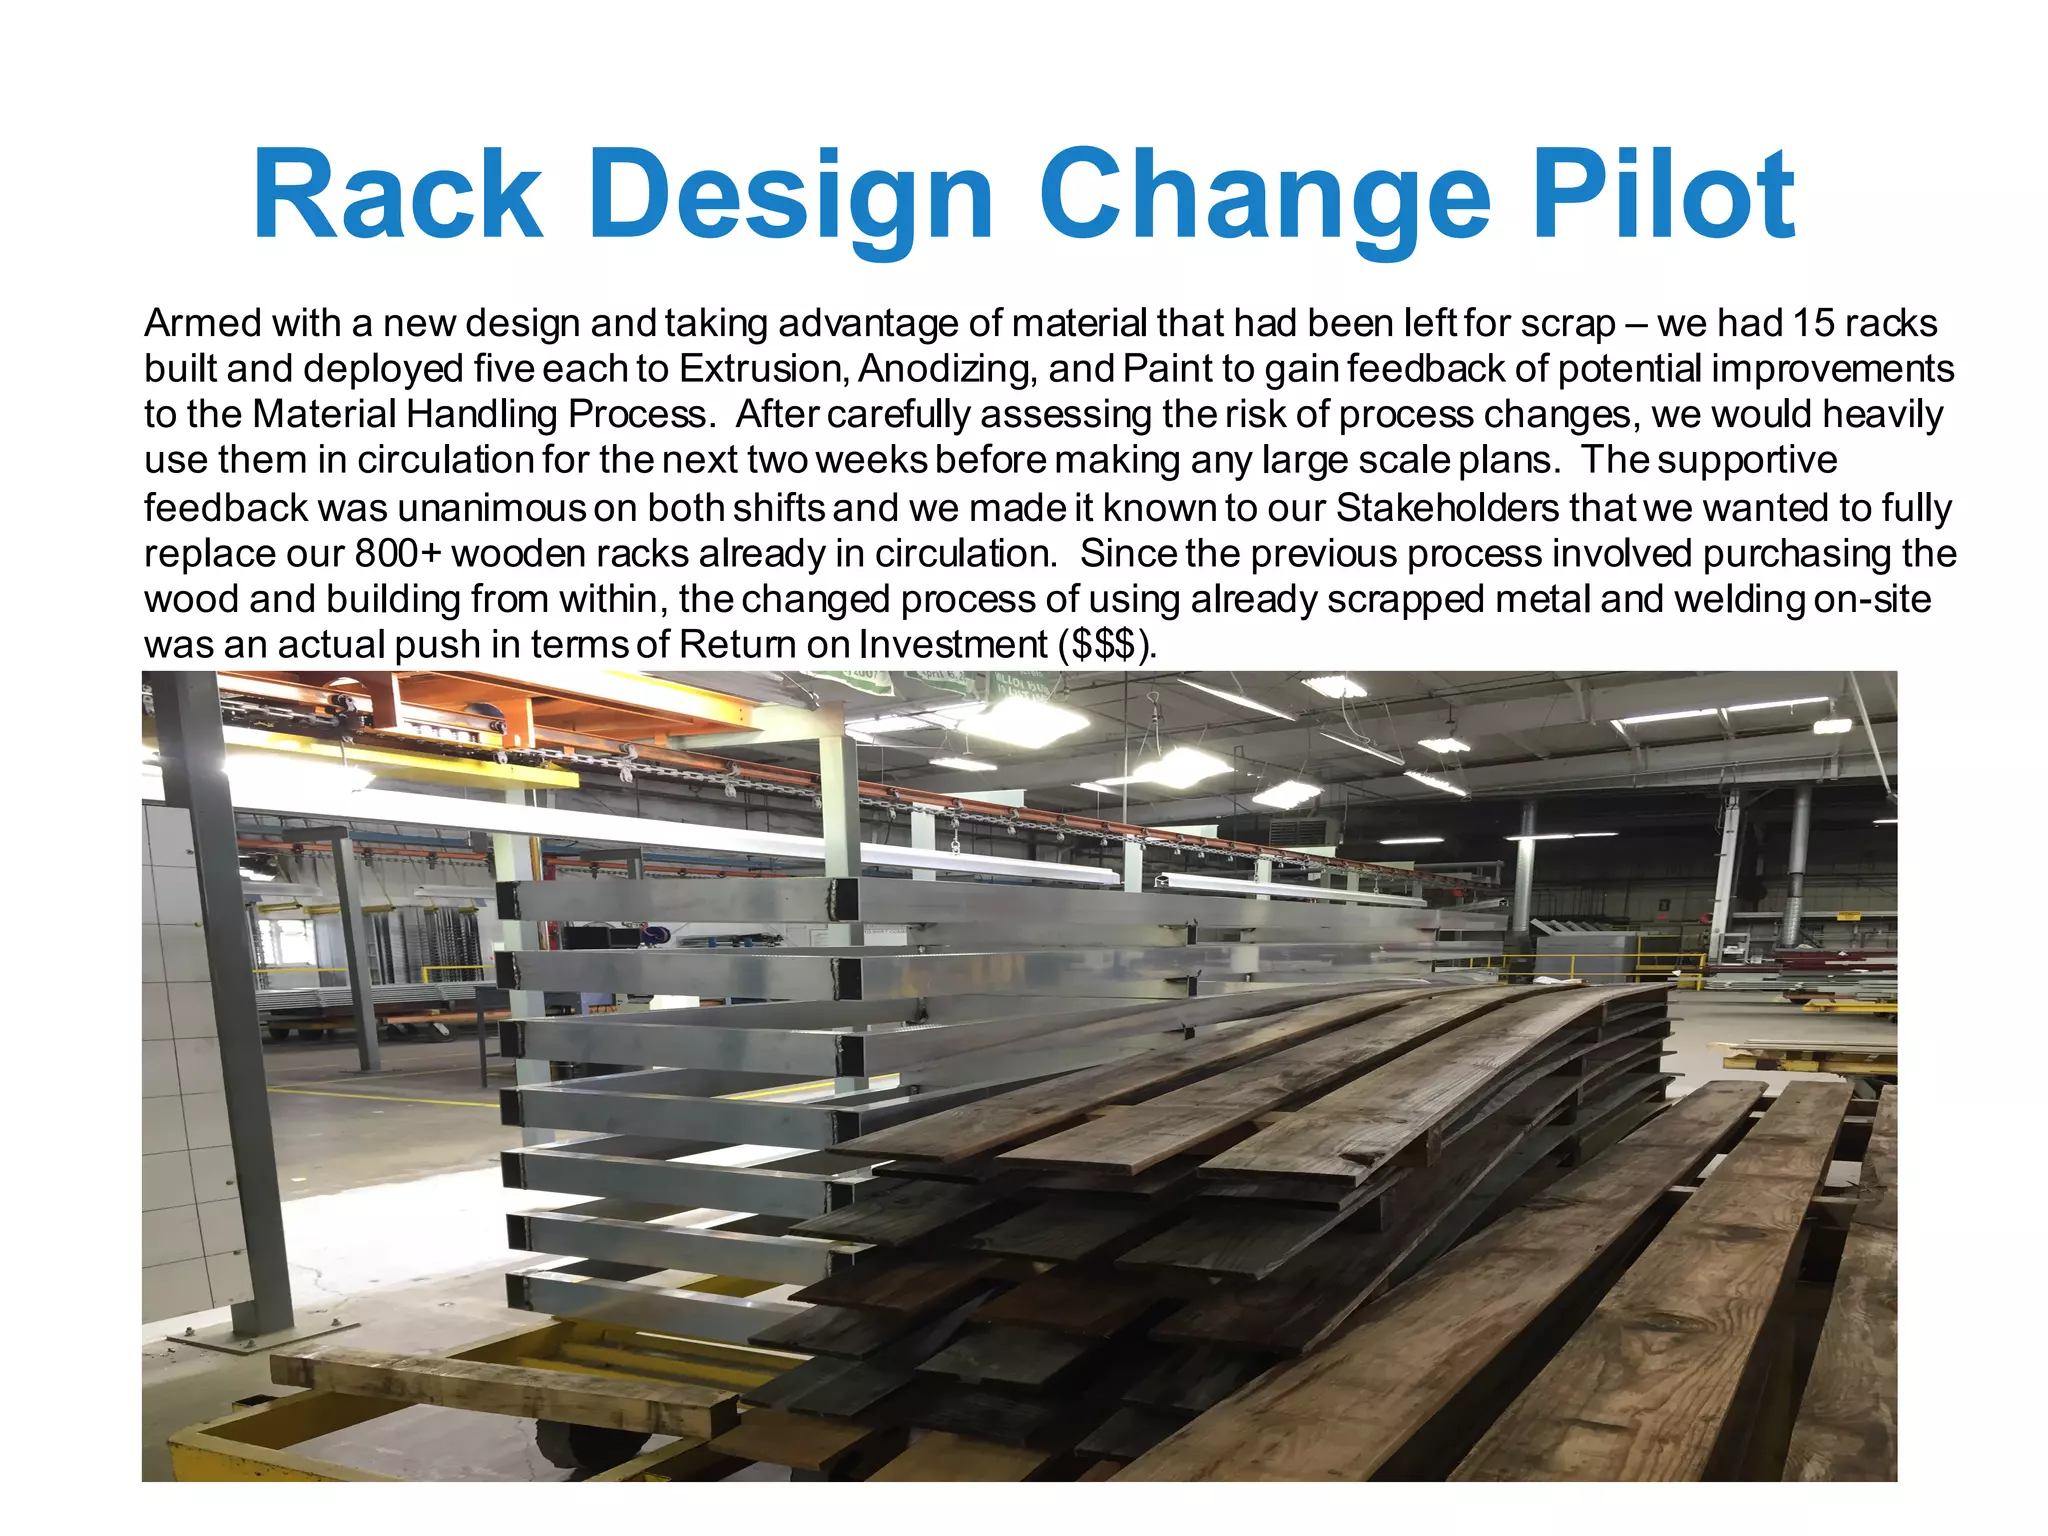
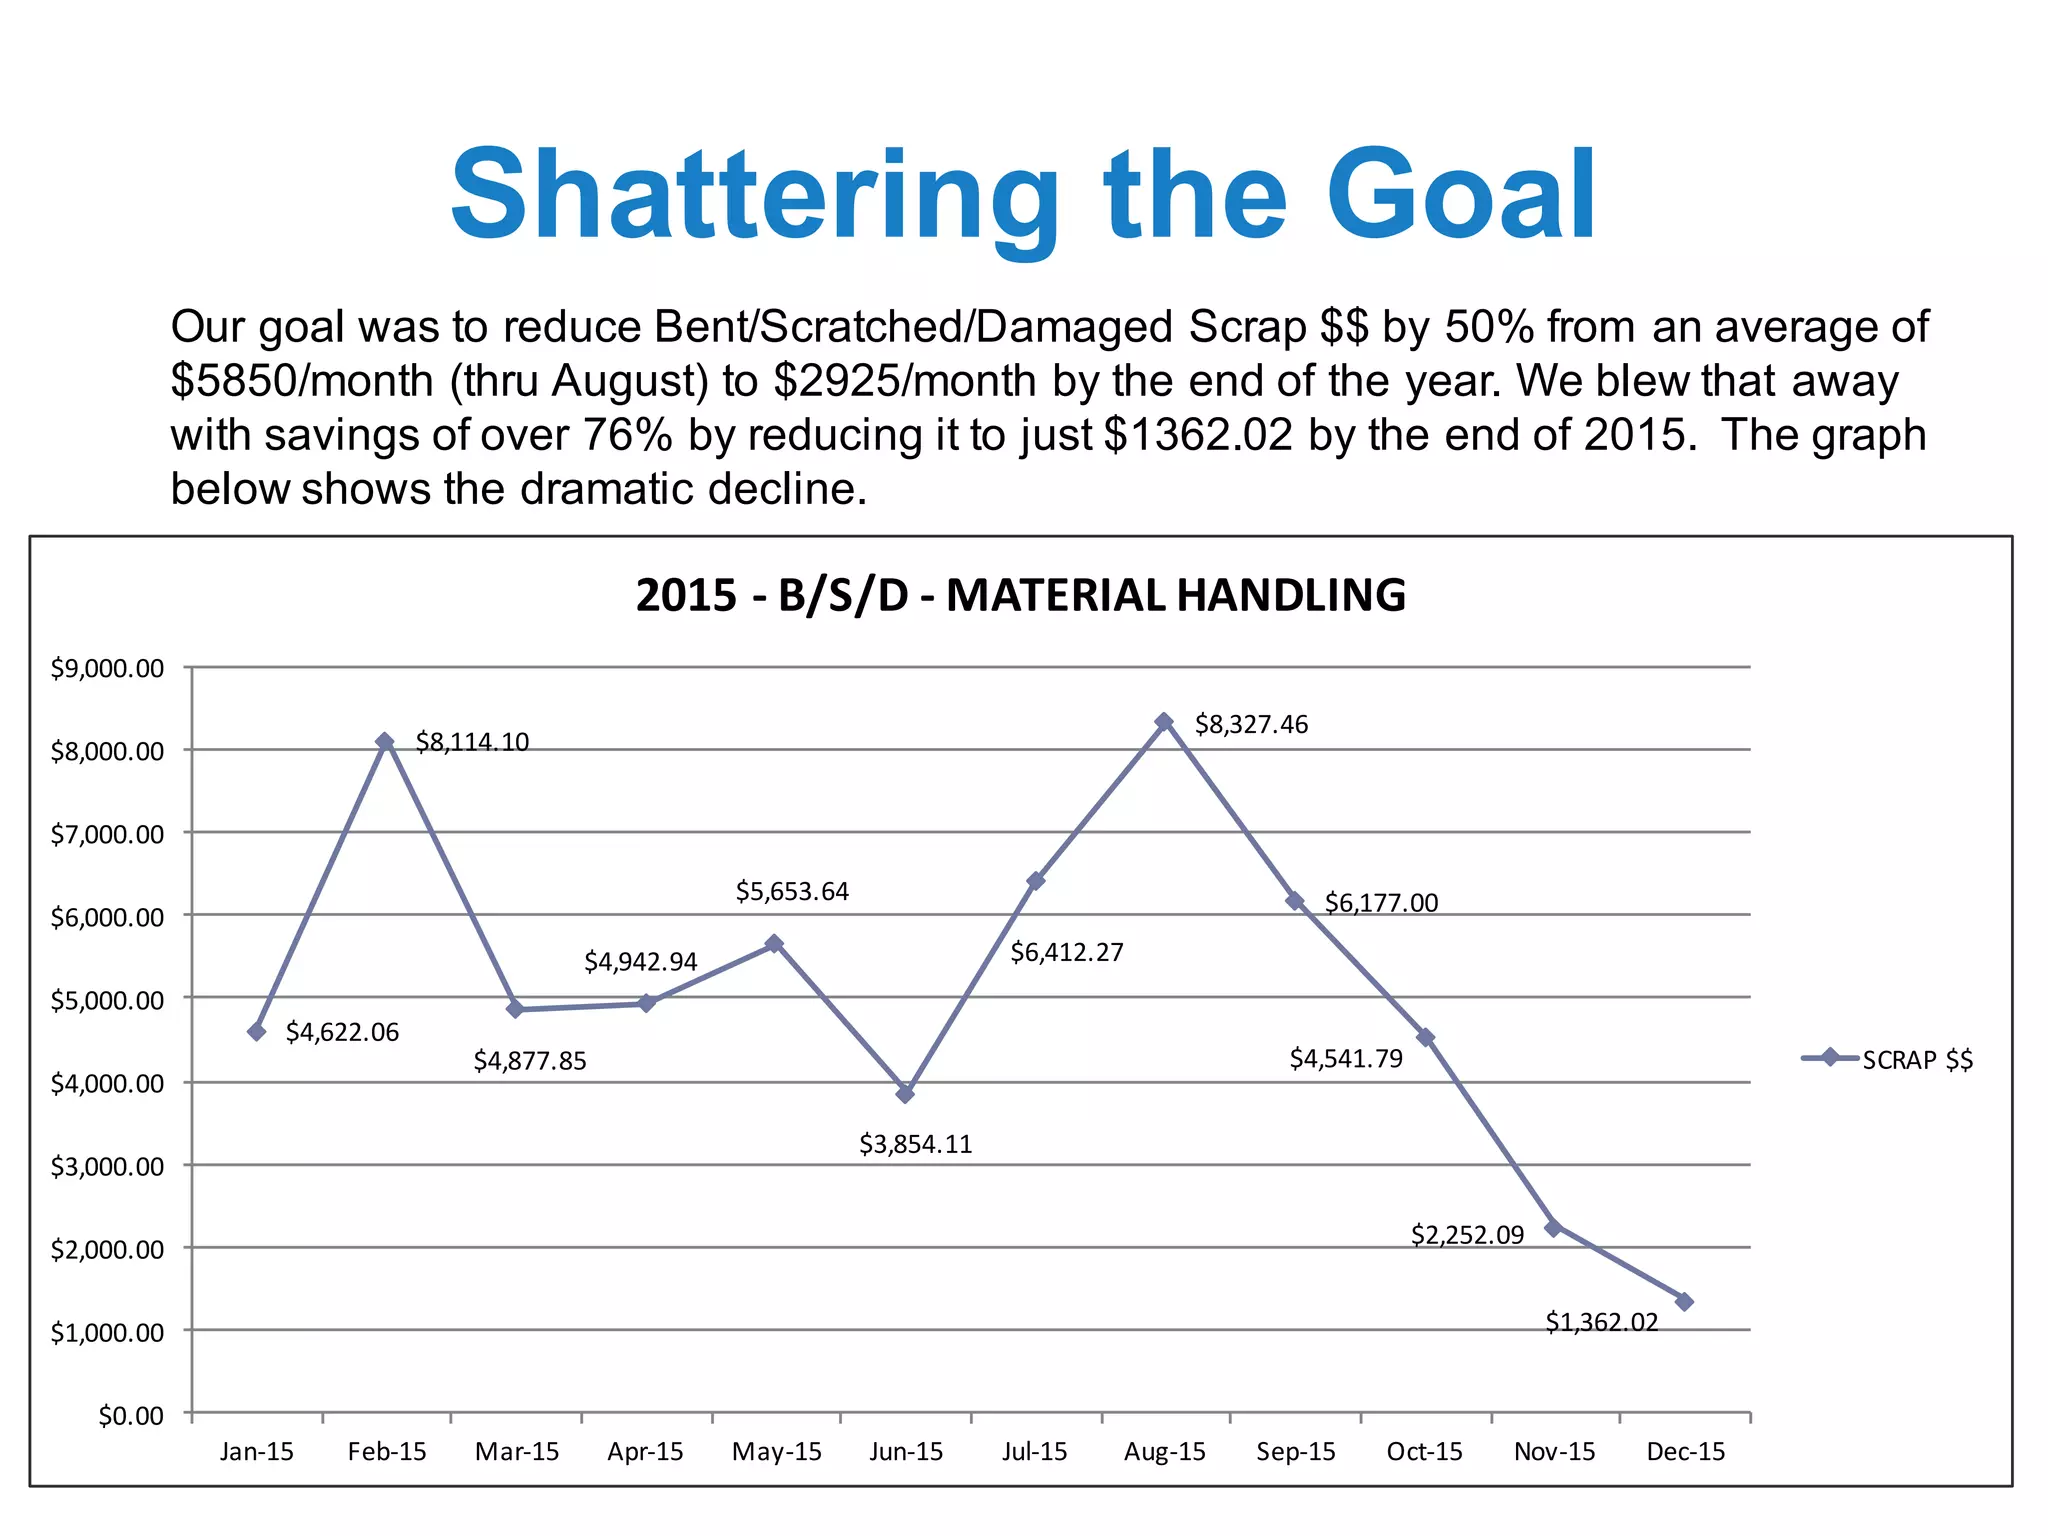
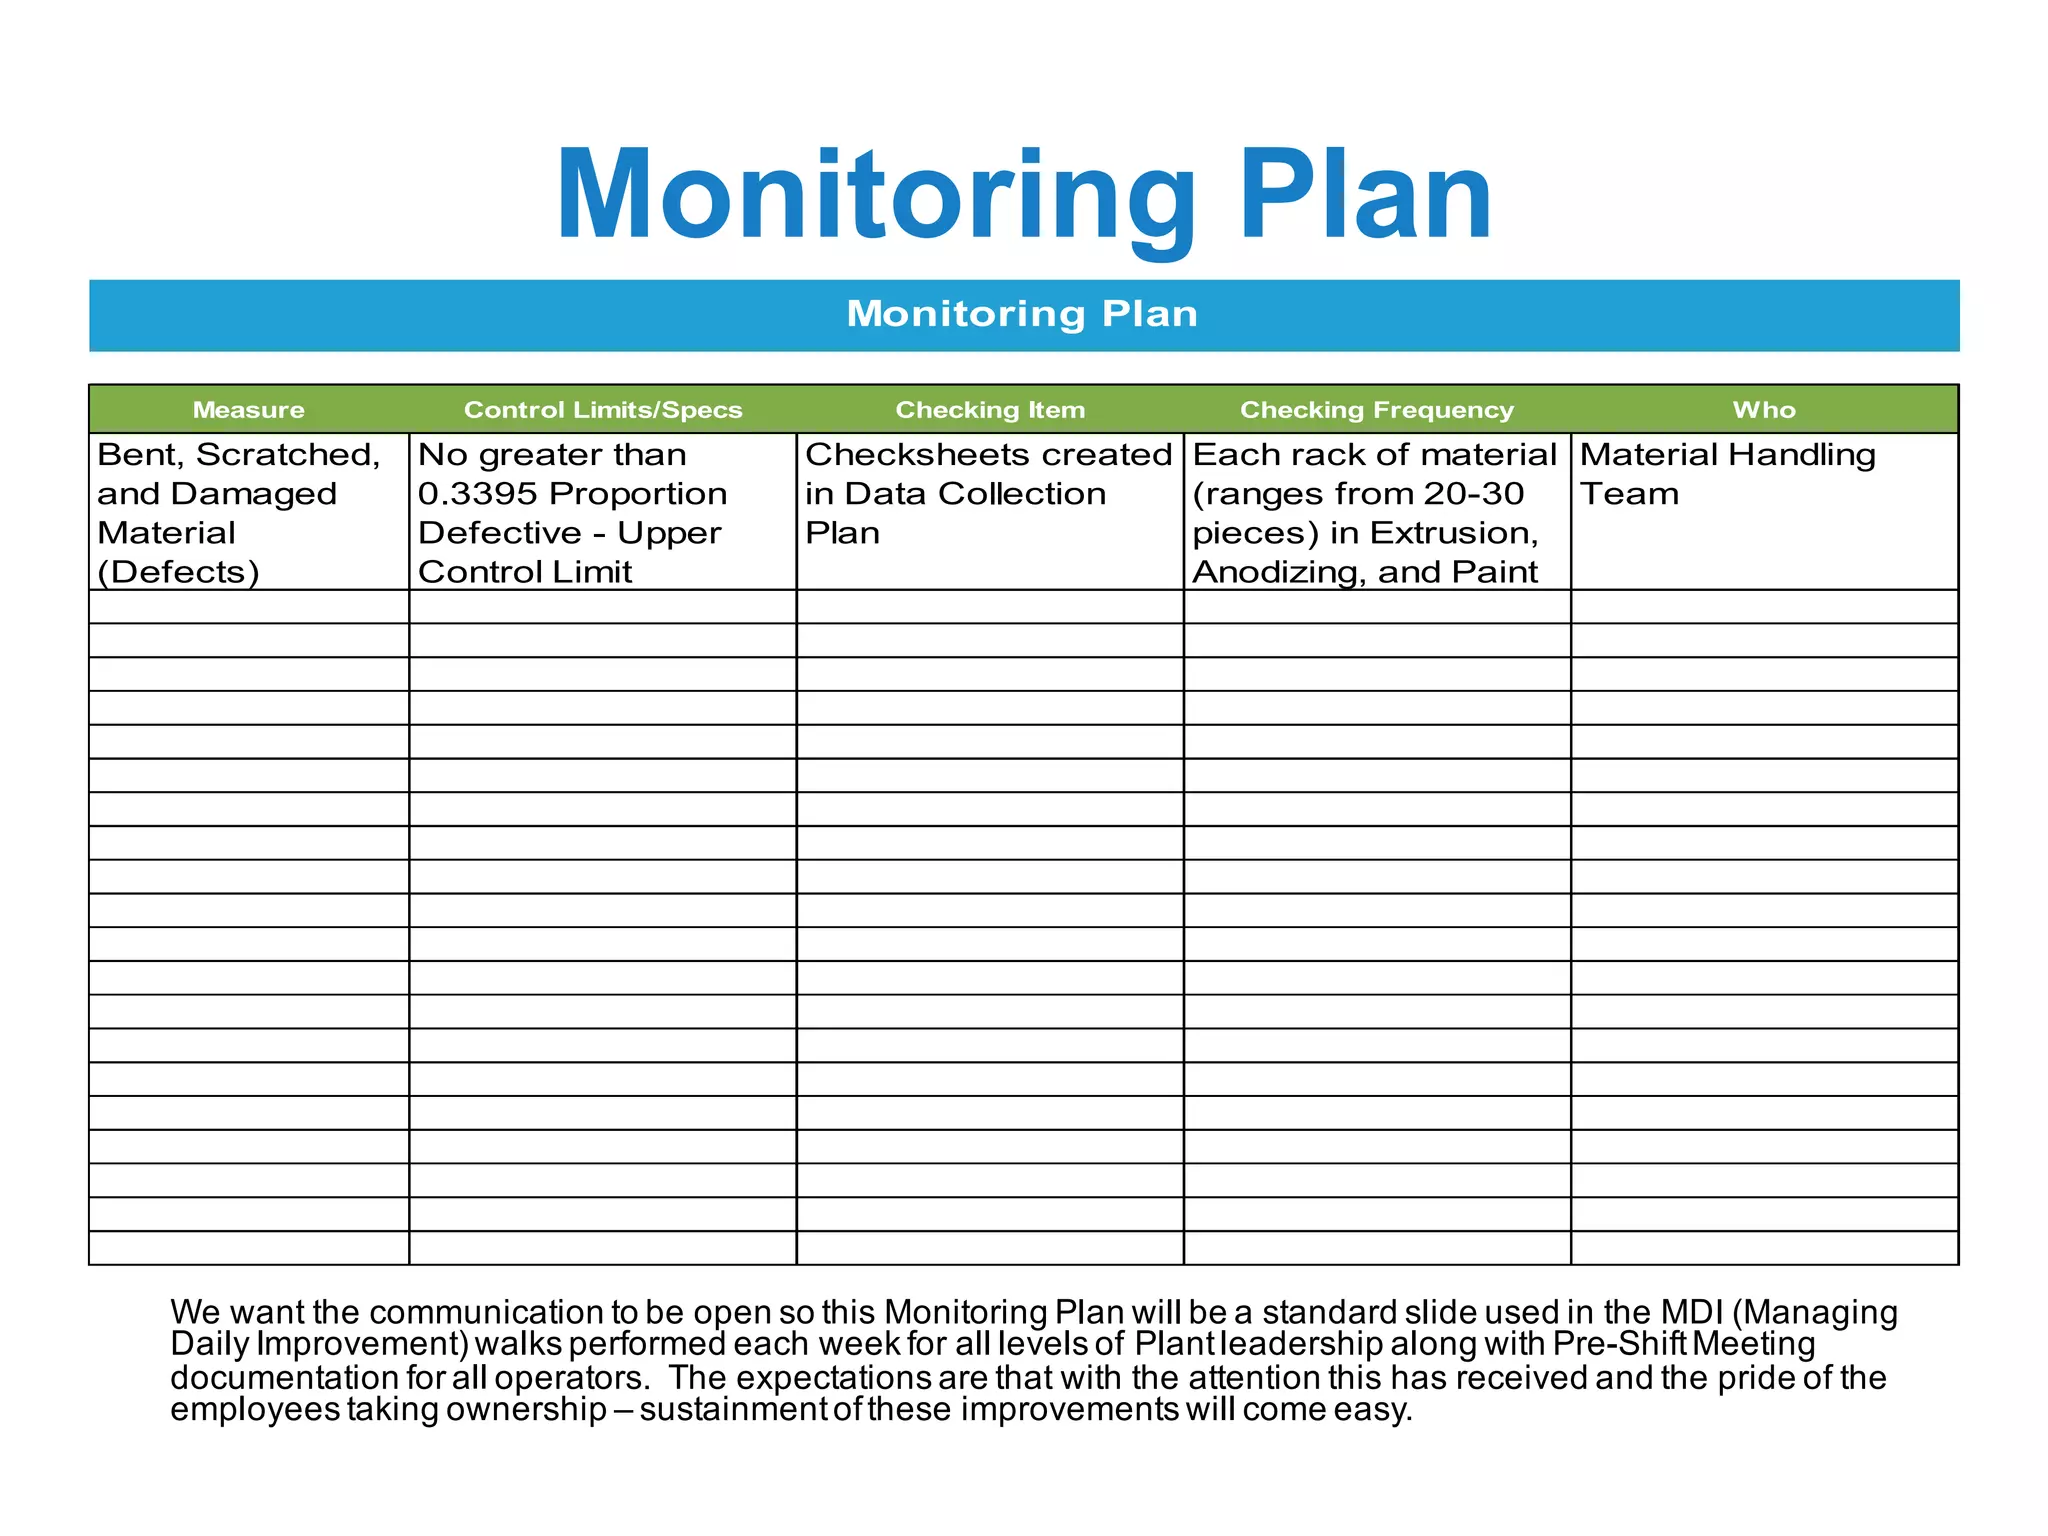
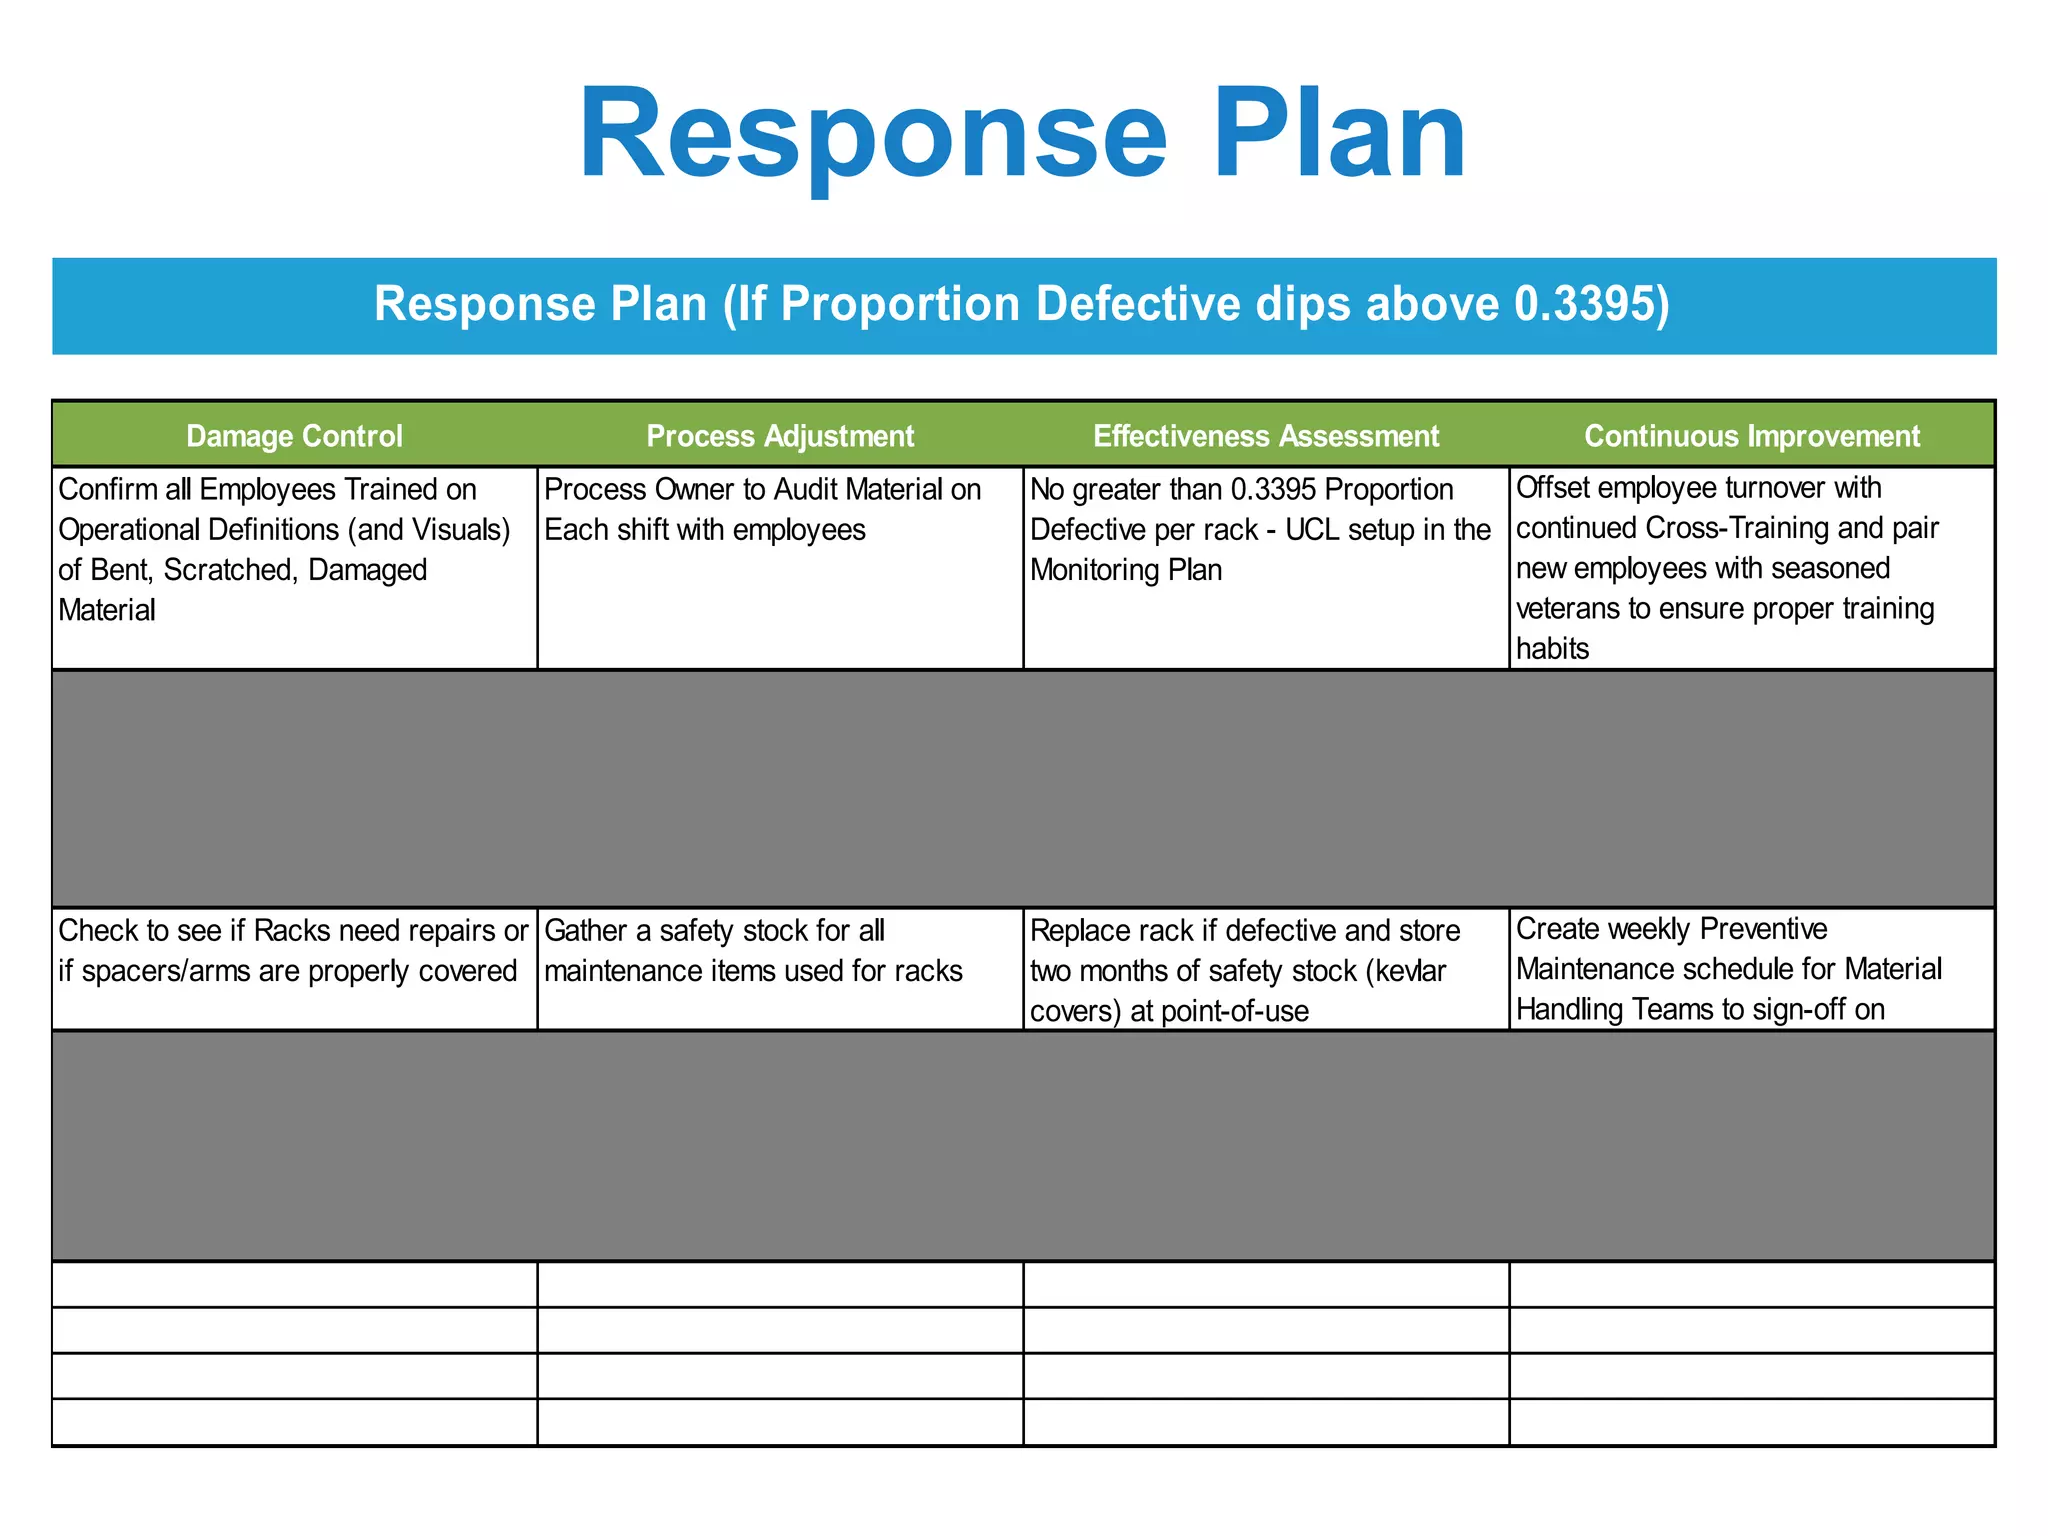
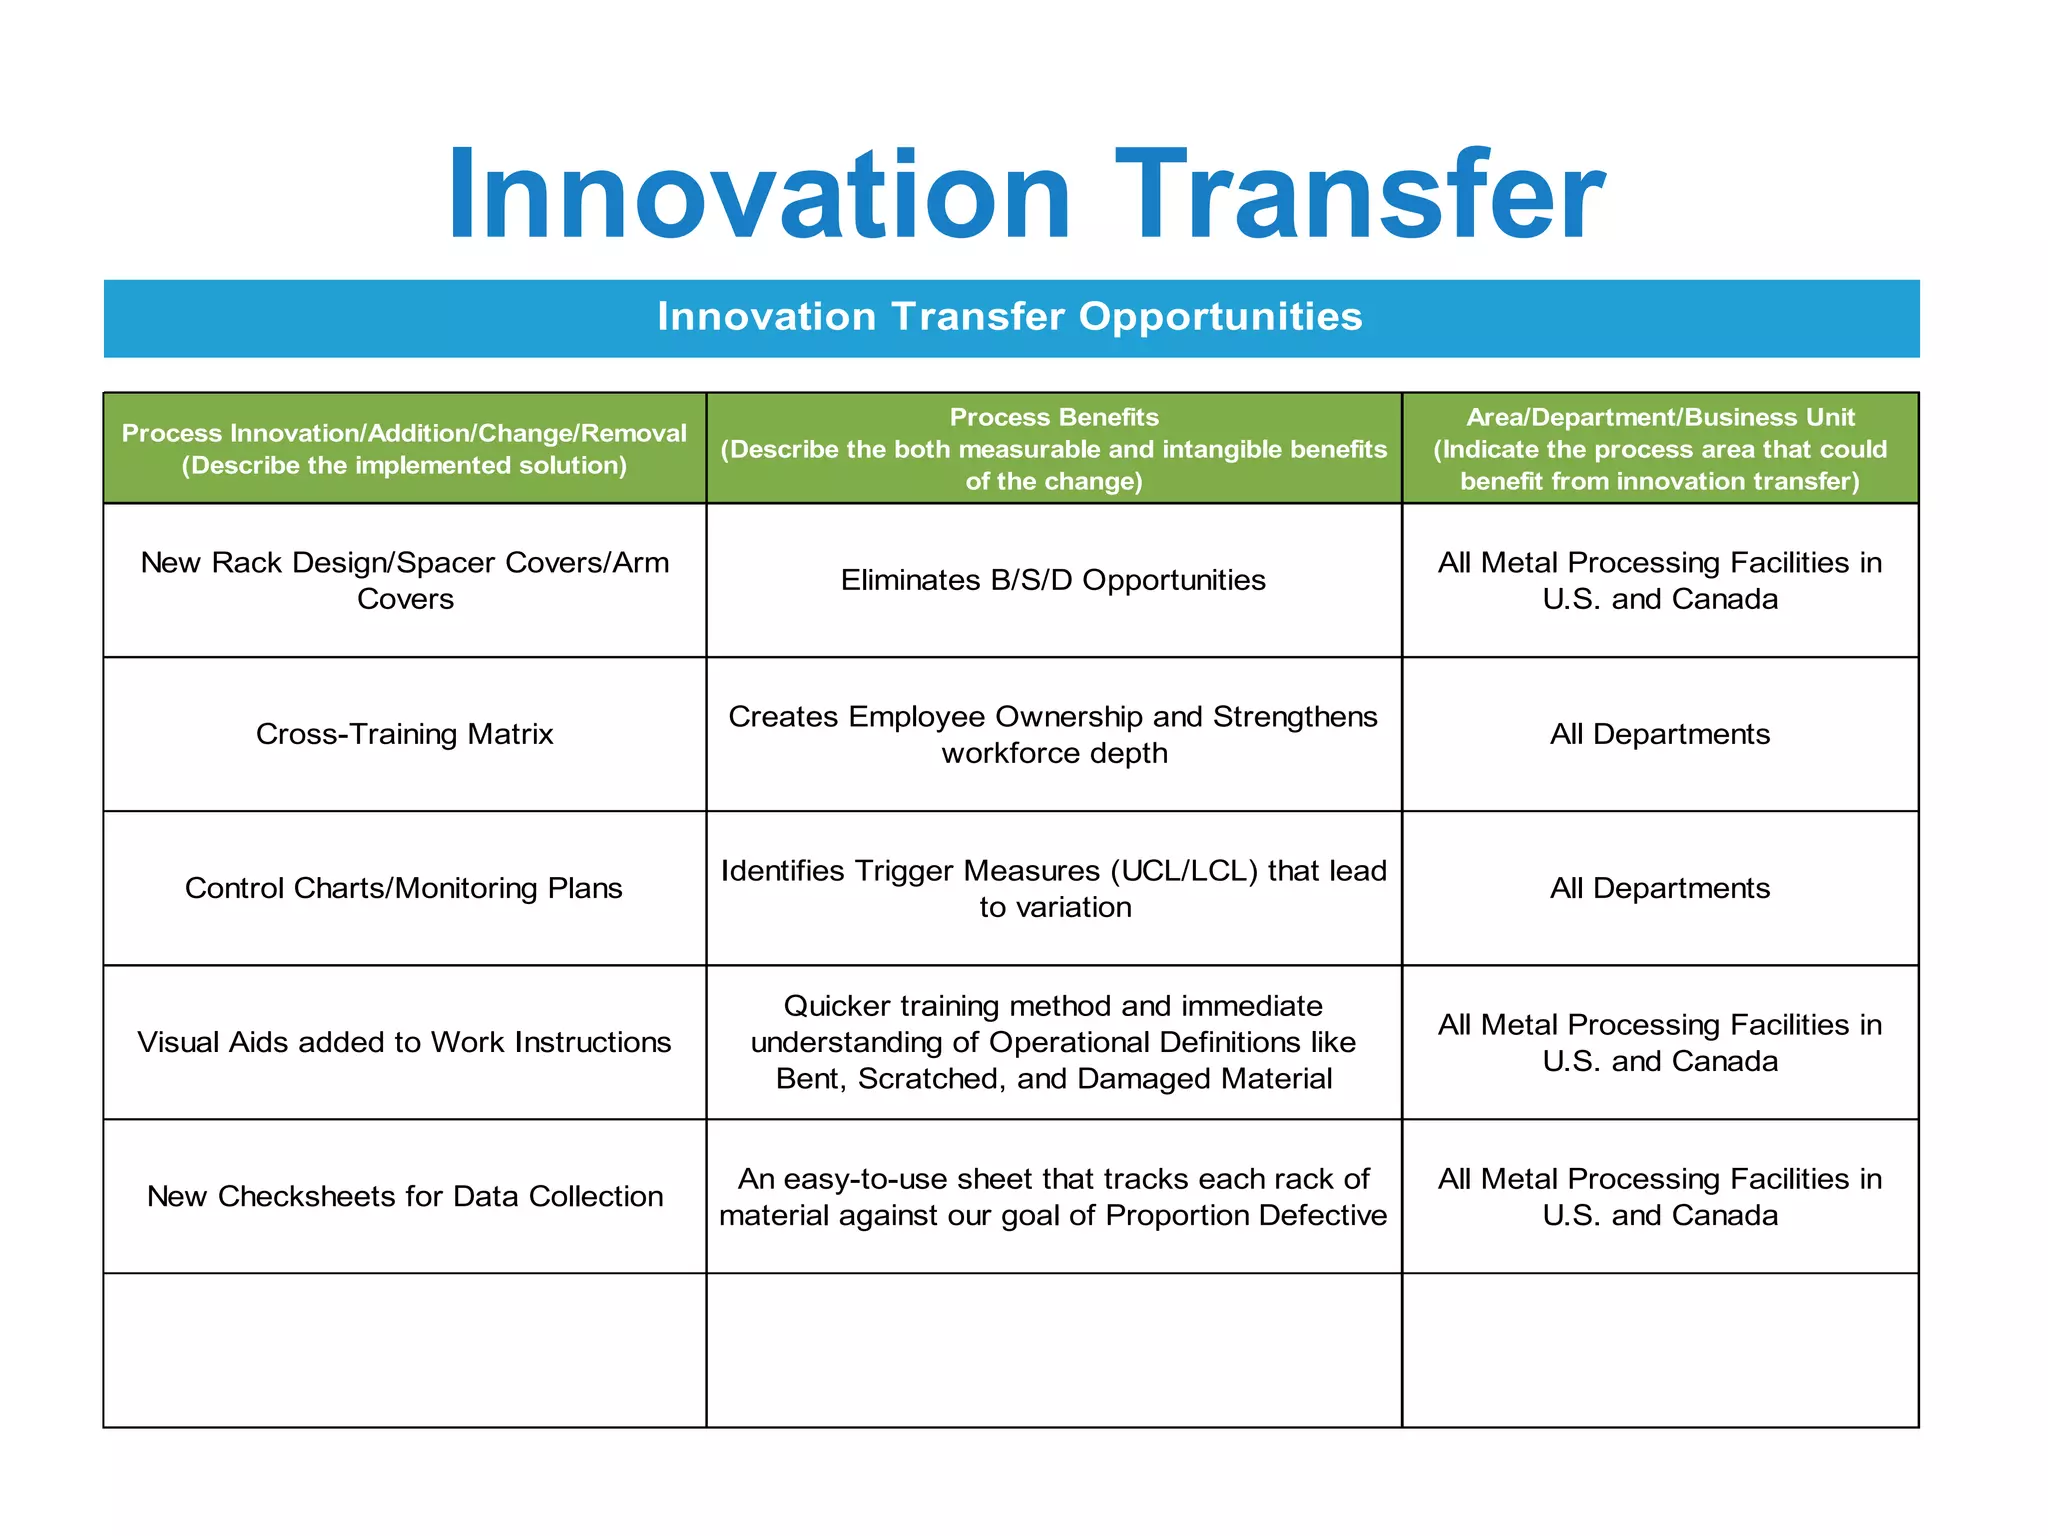
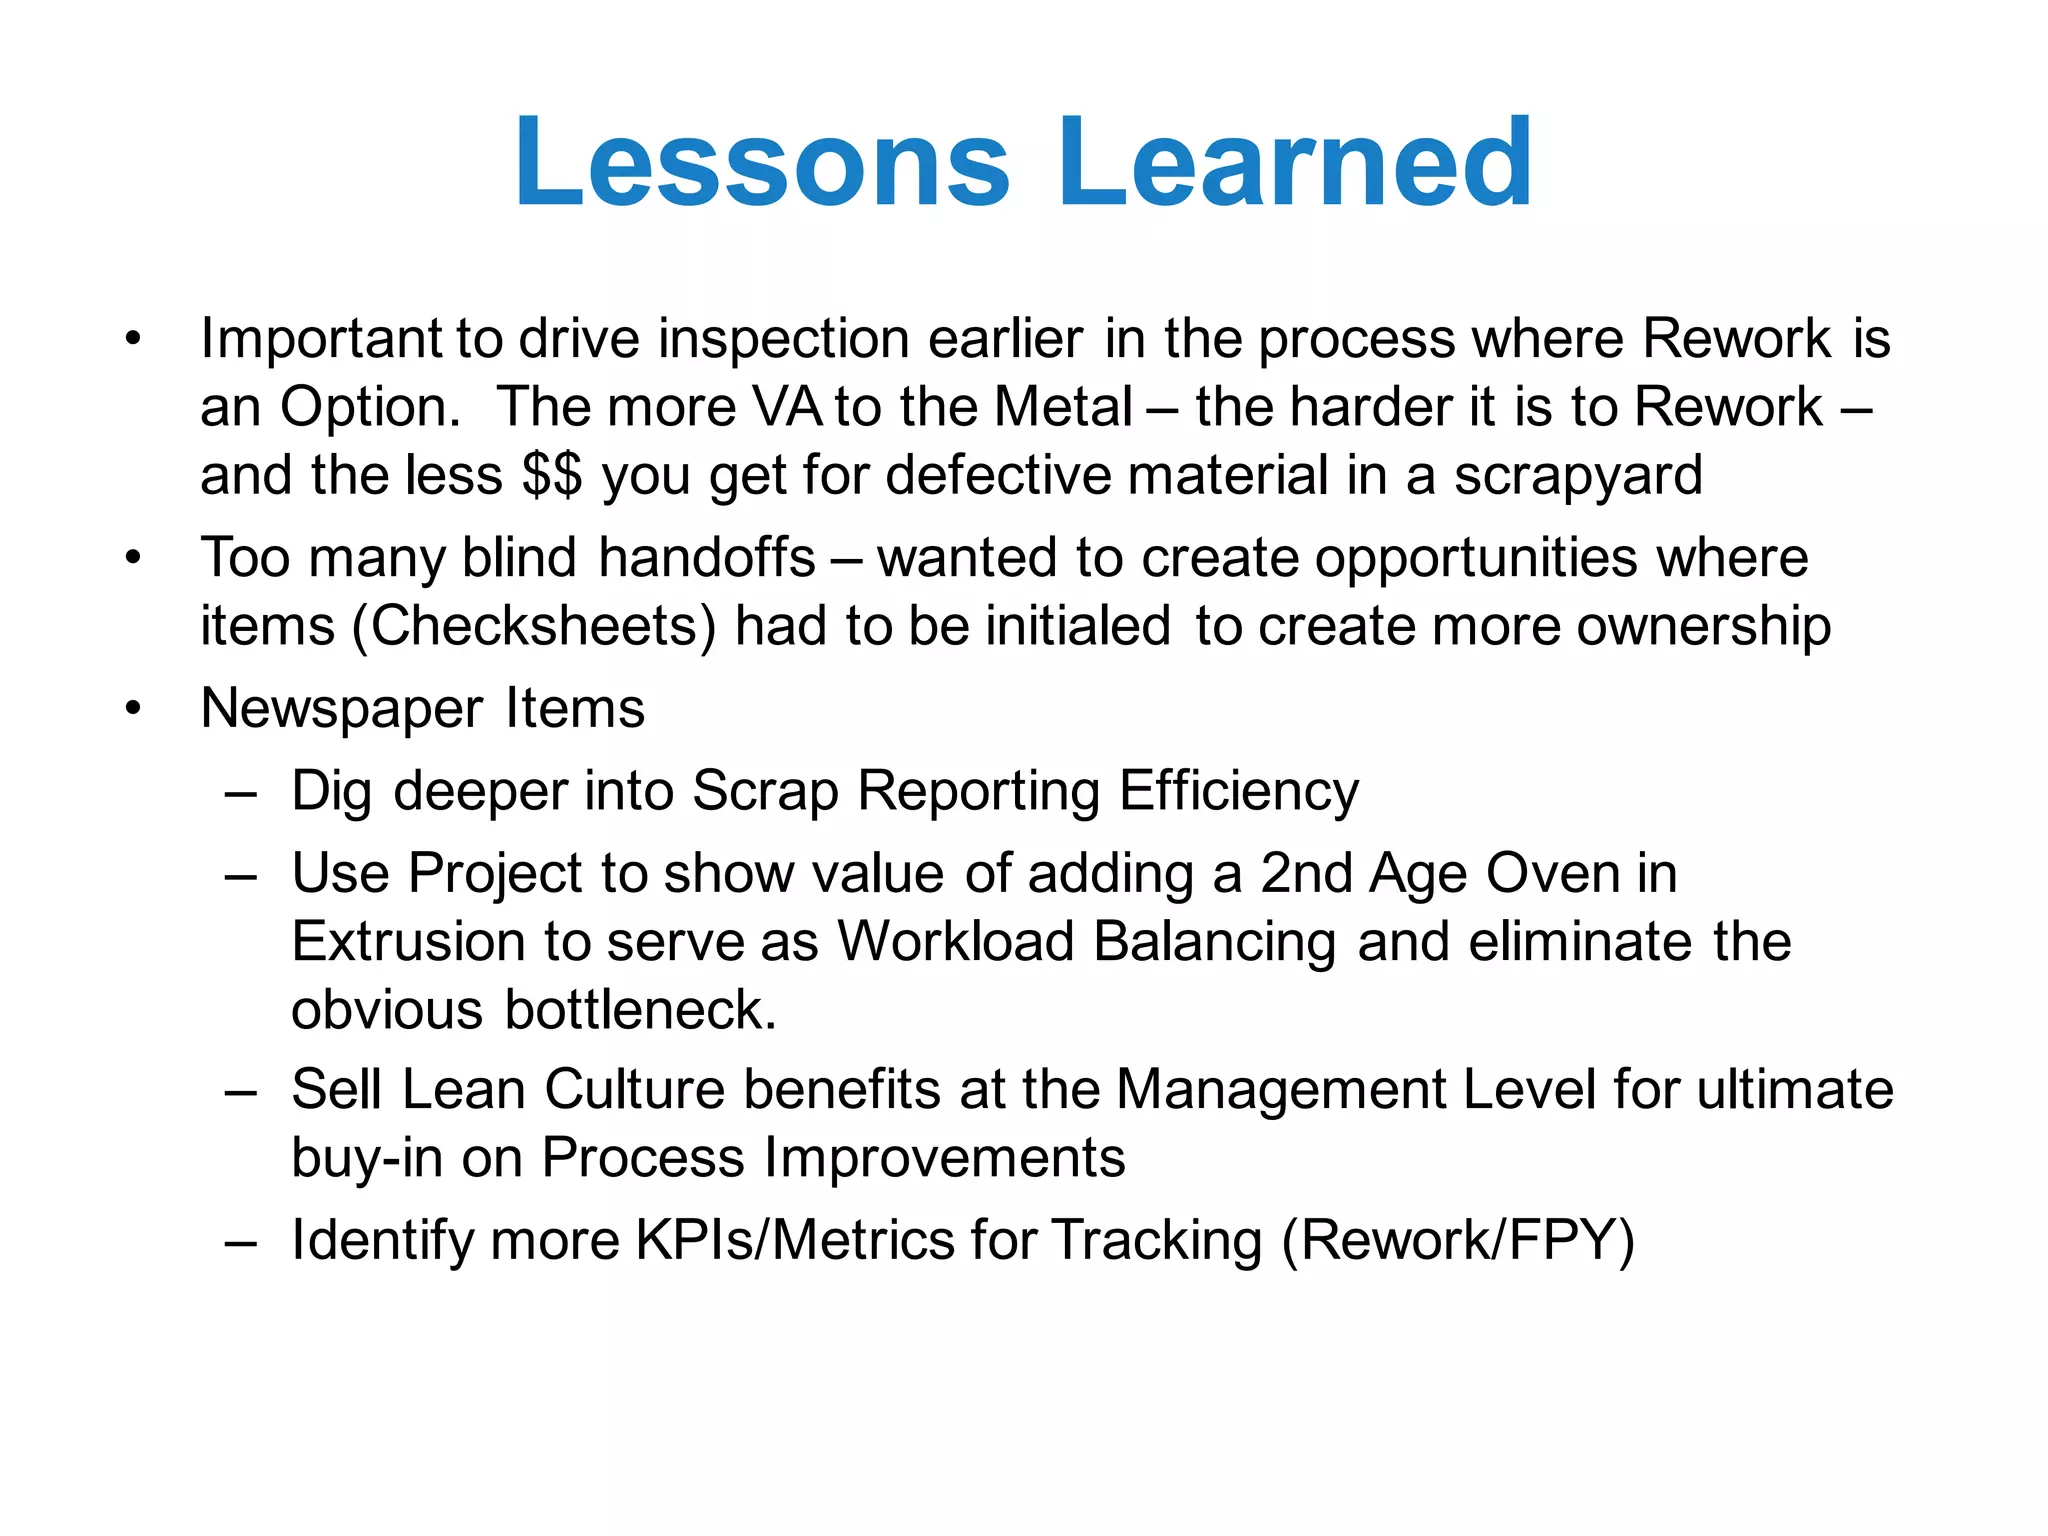

The document details a project aimed at reducing bent, scratched, and damaged scrap costs in a material handling department by over 76%, from $5,850 to $1,362 monthly, through improved rack design, employee training, and optimized processes. Employing a DMAIC approach, the project identified root causes of scrap and implemented measures for sustainability, with emphasis on communication and collaboration across departments. The project's successful completion not only met its goals ahead of schedule but also established best practices for future initiatives across facilities in the U.S. and Canada.


