Downloaded 1,368 times


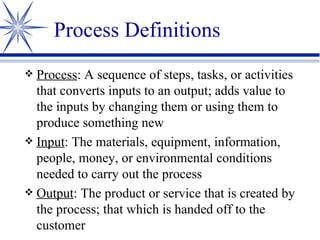


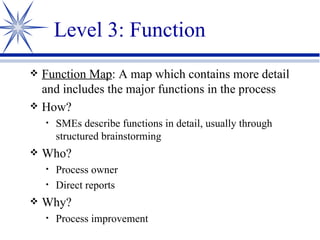


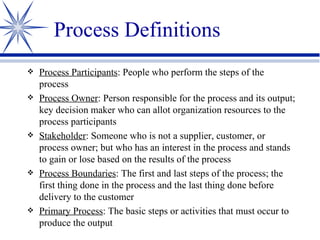


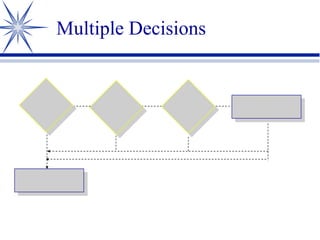


The document provides guidance on process mapping, which involves creating a visual representation of a process showing the sequence of tasks. The objectives are to map the current process, produce a working document, and recognize value in creation. Process mapping involves defining key elements like inputs, outputs, customers, and mapping at different levels of detail. The map should be flexible and represent alternative paths. Guidelines are provided for effective process mapping, including using specific symbols and analyzing the process to identify improvements.


